推薦:使用 NSDT場景編輯器助你快速搭建可二次編輯的3D應用場景
ChatGPT 已經成為一把可用于多種應用的瑞士軍刀,并且有大量的空間將 ChatGPT 集成到數據科學工作流程中。
如果您曾經在真實數據集上訓練過機器學習模型,您就會知道數據清理和預處理的步驟對于構建可靠的機器學習模型非常重要。在本指南中,我們將了解如何使用 ChatGPT 在示例數據集上執行這些任務。
我們將使用 UCI 機器學習存儲庫中的銀行營銷數據集,并提示 ChatGPT 執行以下操作:
- 獲取并加載數據集
- 檢查缺失值
- 對分類變量進行編碼
您可以通過登錄您的 OpenAI 帳戶并開始新的 ChatGPT 會話來跟進。如果你愿意,你也可以在谷歌Colab中編碼。
獲取和加載數據集
數據集有幾個不同版本。我們將使用銀行滿.csv。
提示:今天我們將對真實數據集進行數據清理和預處理。編寫代碼以執行以下操作:1. 從 UCI 機器學習存儲庫中提取銀行營銷數據集。使用請求或 urllib 等庫。2. 下載 zip 文件,解壓縮內容,并將銀行已滿.csv文件讀取到 pandas 數據幀中(稱為數據)。
在數據集中獲取和讀取的代碼如下:
import pandas as pd
import urllib
import zipfile# URL of the dataset
url = "https://archive.ics.uci.edu/ml/machine-learning-databases/00222/bank.zip"# Fetch and extract the dataset
urllib.request.urlretrieve(url, "bank.zip")with zipfile.ZipFile("bank.zip", "r") as zip_ref:zip_ref.extractall()# Load the dataset into a pandas DataFrame
data = pd.read_csv("bank-full.csv", delimiter=";",skipinitialspace=True)
獲取數據集的基本信息
讓我們更好地理解數據集。
# Display the first few rows of the dataset
print(data.head())
這輸出:
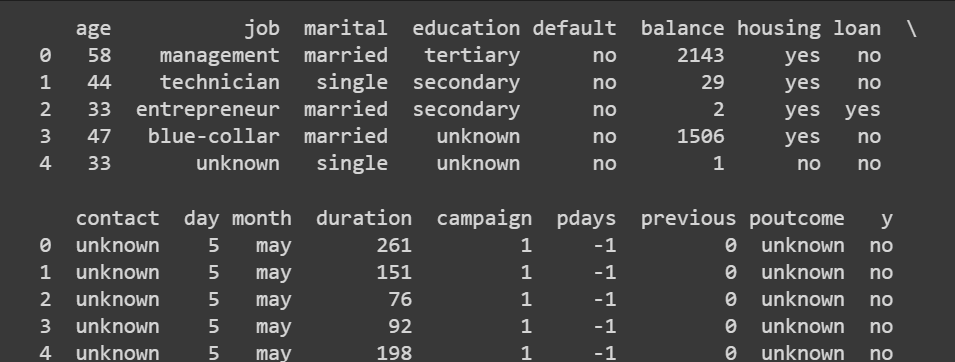
截斷的輸出 data.head()
提示:使用 pandas 獲取數據幀的維度、列的描述性統計信息以及各種列的數據類型。
這一步并不需要提示 ChatGPT,因為 pandas 方法非常簡單。
# Get the dimensions of the dataset (rows, columns)
print(data.shape)
Output >>> (45211, 17)我們有超過 45000 條記錄和 16 個特征(因為 17 個也包括輸出標簽)。
# Get statistical summary of numerical columns
print(data.describe())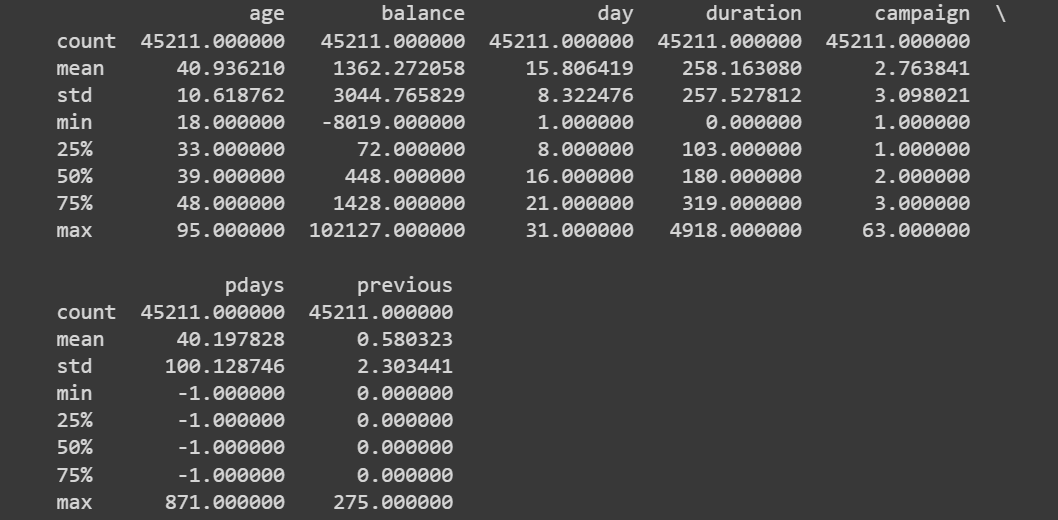
數據.describe() 的截斷輸出
獲取各個列的數據類型的概述也很有幫助。當我們對分類變量進行編碼時,我們將仔細研究它們。
# Check data types of each column
print(data.dtypes)
Output >>>age int64
job object
marital object
education object
default object
balance int64
housing object
loan object
contact object
day int64
month object
duration int64
campaign int64
pdays int64
previous int64
poutcome object
y object
dtype: object到目前為止,我們已經了解了銀行營銷數據集。輸出標簽表示客戶是否會訂閱定期存款。該數據集包含多個要素,例如年齡、月份、教育程度、婚姻狀況、先前廣告系列的結果等。
檢查缺失值
提示:我想知道每列中缺失值的數量。請給我代碼來做這件事。使用熊貓。
# Check for missing values in each column
missing_values = data.isnull().sum()
print(missing_values)
下面是輸出:
Output >>>age          0
job          0
marital      0
education    0
default      0
balance      0
housing      0
loan         0
contact      0
day          0
month        0
duration     0
campaign     0
pdays        0
previous     0
poutcome     0
y            0
dtype: int64
此版本的銀行營銷數據集(包含超過 45000 條記錄)沒有任何缺失值。但實際上,大多數真實世界的數據集都有缺失值。您應該使用合適的插補技術來處理缺失值。
作為可選的練習,您可以在此處添加一個步驟,提示 ChatGPT 從列的子集中刪除一小部分值,以便您可以練習如何處理缺失值。
編碼分類變量
下一步是對數據集中的分類變量進行編碼。我們將首先獲取所有分類列的列表。
提示:提供代碼以獲取此數據集中所有分類列的列表。
# Count the number of categorical variables
categorical_columns = data.select_dtypes(include=['object']).columns
print(categorical_columns)
num_categorical_variables = len(categorical_columns)# Display the count
print("Number of categorical variables:", num_categorical_variables)分類列列表還包括輸出標簽?y。但是,讓我們先關注其他分類變量。
Output >>>
Index(['job', 'marital', 'education', 'default', 'housing', 'loan', 'contact','month', 'poutcome', 'y'],dtype='object')
Number of categorical variables: 10
仔細查看分類變量的值
接下來,讓我們看看每個分類變量采用的值。
提示:我想了解每個分類變量采用的各種值。給熊貓代碼來做到這一點。
# Get the different values and their counts for each categorical column
categorical_columns = ['job', 'marital', 'education', 'default', 'housing', 'loan', 'contact', 'month', 'poutcome']
for column in categorical_columns:value_counts = data[column].value_counts()print(f"Column: {column}")print(value_counts,"\n")
輸出很難解析:
Output >>>Column: job
blue-collar      9732
management       9458
technician       7597
admin.           5171
services         4154
retired          2264
self-employed    1579
entrepreneur     1487
unemployed       1303
housemaid        1240
student           938
unknown           288
Name: job, dtype: int64 ...
...
...
Column: poutcome
unknown    36959
failure     4901
other       1840
success     1511
Name: poutcome, dtype: int64
可視化分類變量的值
讓我們提示 ChatGPT 創建一個可視化,以便更容易理解分類變量采用的值。
提示:我想要一個顯示每個分類變量取值的圖。排除輸出標簽 y。包括所有其他分類變量。
我們開始吧!
import matplotlib.pyplot as plt# Get the different values and their counts for each categorical column
categorical_columns = ['job', 'marital', 'education', 'default', 'housing', 'loan', 'contact', 'month', 'poutcome']# Set up the subplot grid
fig, axes = plt.subplots(3, 3, figsize=(10,8))# Iterate over each categorical column and plot the value counts
for i, column in enumerate(categorical_columns):row = i // 3col = i % 3value_counts = data[column].value_counts()ax = axes[row, col]value_counts.plot(kind='bar', ax=ax)ax.set_xlabel(column)ax.set_ylabel('Count')ax.set_title(f'{column.title()} Value Counts')# Adjust spacing between subplots
plt.tight_layout()# Show the plot
plt.show()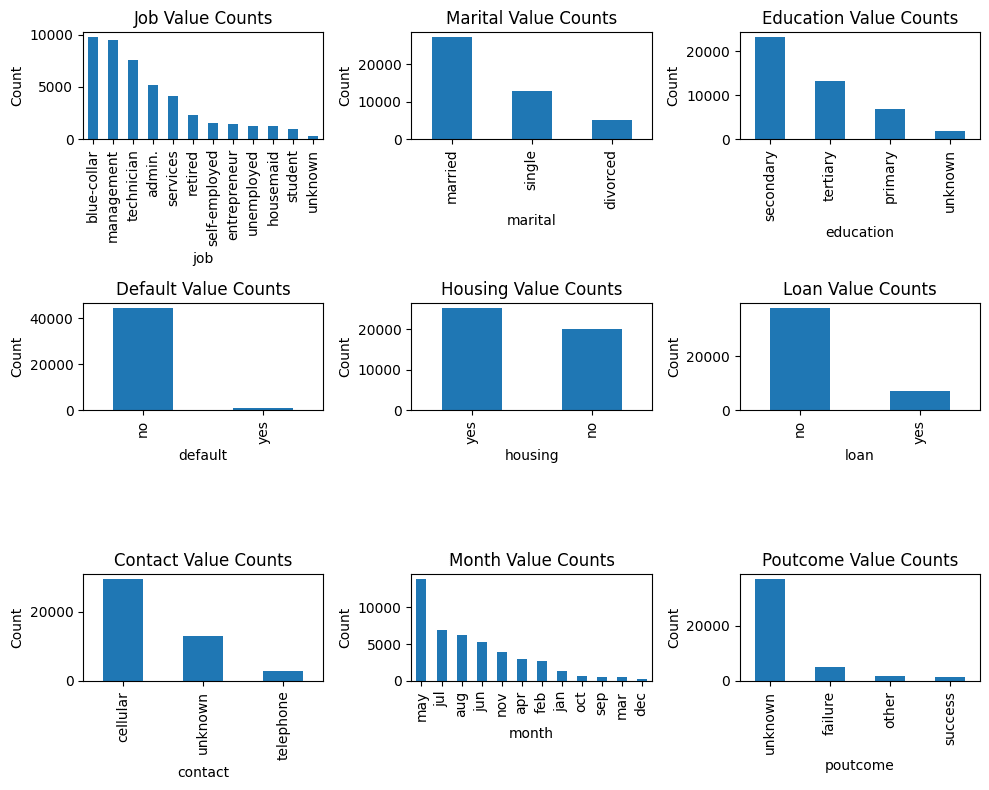
分類變量的值
獨熱編碼
對于分類列的子集,我們可以使用獨熱編碼。
提示:給 pandas 代碼以對列列表執行獨熱編碼。
我們使用從熊貓到獨熱編碼以下列:get_dummies
# Select the categorical columns (excluding education and poutcome)
categorical_columns = ['job', 'marital', 'default', 'housing', 'loan', 'contact']# Perform one-hot encoding
encoded_data = pd.get_dummies(data, columns=categorical_columns)提示:我想打印出新添加列的前幾行。編寫代碼以執行相同的操作。
# Select the newly added columns
new_columns = encoded_data.columns.difference(data.columns)# Print the head of the newly added columns
print(encoded_data[new_columns].head())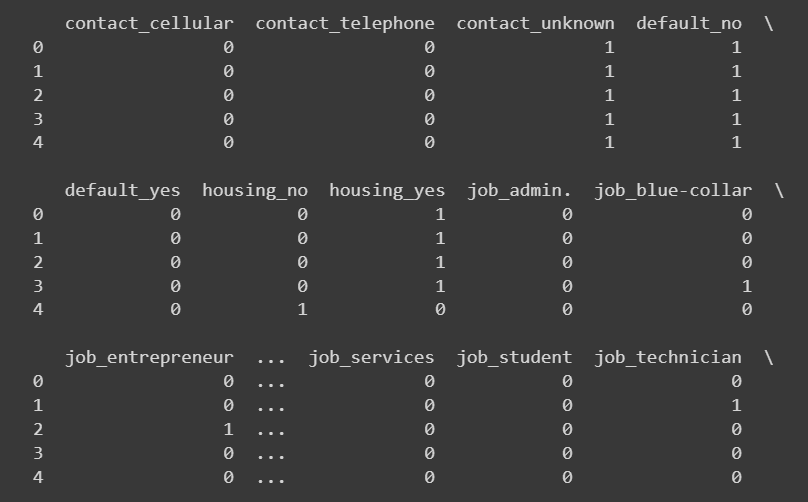
截斷的輸出 encoded_data['new_colums'].head()
定義自定義映射
對于“education”和“poutcome”(先前結果)等變量的列,而不是獨熱編碼,最好使用自定義映射在值之間進行一定程度的比較。
此外,當我們使用獨熱編碼來編碼一個分類變量時,該變量采用 k 個不同的值 k 個新列。對于像“月”這樣的分類列,如果不添加太多信息,這將是多余的。
因此,對于這兩種情況,我們將定義一個自定義映射,然后轉換值。我們可以提示 ChatGPT 獲取一個通用代碼片段,然后我們可以修改該代碼片段以定義特定列的映射。
提示:我想做一個自定義映射來編碼一些分類變量。首先給我一個通用代碼片段,該代碼片段定義了從分類列中的唯一值到一組不同輸出值的自定義映射。然后,我們應該使用此映射來轉換列中的值。
# Define the custom mapping dictionary
custom_mapping = {'category1': 'value1','category2': 'value2','category3': 'value3',# Add more categories and corresponding values as needed
}# Specify the categorical column
categorical_column = 'column_name'  # Replace 'column_name' with the actual column name# Perform the mapping using the custom mapping dictionary
data[categorical_column] = data[categorical_column].map(custom_mapping)
對于“月”列,讓我們像這樣轉換月份字符串:
# Define the mapping dictionary for months
month_mapping = {'jan': 1,'feb': 2,'mar': 3,'apr': 4,'may': 5,'jun': 6,'jul': 7,'aug': 8,'sep': 9,'oct': 10,'nov': 11,'dec': 12
}# Map the values in the month column
encoded_data['month'] = encoded_data['month'].map(month_mapping)
讓我們將“結果”和“教育”列映射到數值,如下所示:
# Define the custom mapping for poutcome and education
poutcome_mapping = {'unknown': 0,'failure': 1,'other': 2,'success': 3
}education_mapping = {'unknown': 0,'primary': 1,'secondary': 2,'tertiary': 3
}# Perform ordinal encoding using pandas map
encoded_data['poutcome'] = encoded_data['poutcome'].map(poutcome_mapping)
encoded_data['education'] = encoded_data['education'].map(education_mapping)# Select the newly added columns
new_columns = ['month','poutcome', 'education']# Print the head of the newly added columns
print(encoded_data[new_columns].head(10))
對輸出標簽進行編碼
我們還將輸出標簽“是”和“否”分別映射到 1 和 0。
encoded_data['y'] = encoded_data['y'].replace({'no': 0, 'yes': 1})
print(encoded_data['y'])
Output >>>0 0
1 0
2 0
3 0
4 0..
45206 1
45207 1
45208 1
45209 0
45210 0
Name: y, Length: 45211, dtype: int64回想一下,我們對“住房”、“默認”和“貸款”列使用了獨熱編碼。由于這些列還采用“是”和“否”值,因此您還可以將“是”和“否”分別映射到 1 和 0。
可視化類標簽的分布
檢查類標簽的分布也很有幫助,這樣我們就可以在需要時在構建模型時考慮類不平衡。
提示:我想了解類標簽的分布。請給我代碼以生成合適的圖。
以下是在Seaborn中生成計數圖的代碼:
import seaborn as sns
import matplotlib.pyplot as plt# Plot the distribution of output labels
sns.countplot(data=data, x='y')
plt.xlabel('Output Label')
plt.ylabel('Count')
plt.title('Output Label Distribution')
plt.show()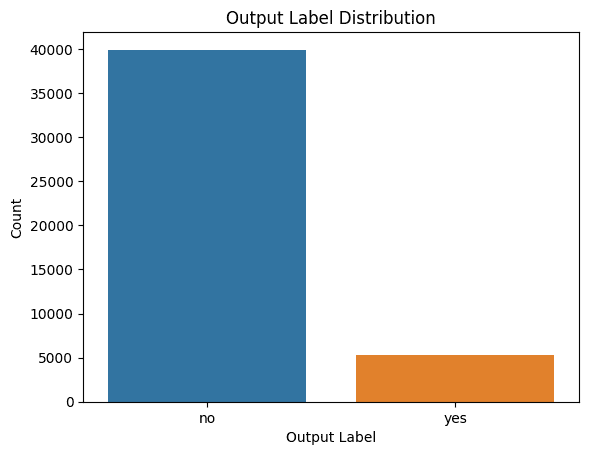
類標簽的分發
我們看到存在階級失衡。因此,如果要構建模型,則應確保使用適當的重采樣方法解決類不平衡問題。
通用數據清理和預處理管道
盡管數據清理和預處理需要開發人員的努力,但讓我們嘗試獲取一個通用的步驟序列,該步驟序列對于簡單的數據集來說相當有效。
提示:您能否根據我們到目前為止所做的工作給我一個通用的數據清理和預處理管道。獲取數據集的基本信息,檢查和處理缺失值,標識分類列,并對分類列進行編碼。只使用熊貓。
這是:
import pandas as pd# Load the dataset into a DataFrame
data = pd.read_csv('data.csv')# Step 1: Basic Info
print(data.info())# Step 2: Missing Values
missing_values = data.isnull().sum()
print(missing_values)# Step 3: Handle Missing Values
# Identify columns with missing values
columns_with_missing_values = missing_values[missing_values > 0].index# Impute missing values using fillna() or other suitable method
data[columns_with_missing_values] = data[columns_with_missing_values].fillna(data[columns_with_missing_values].mean())# Step 4: Get Categorical Columns
categorical_columns = data.select_dtypes(include=['object']).columns# Step 5: Encode Categorical Columns
# Perform ordinal encoding or one-hot encoding using pandas' get_dummies() function
encoded_data = pd.get_dummies(data, columns=categorical_columns)# Print the encoded data
print(encoded_data.head())
總結
可以看出,與 ChatGPT 協同作用的數據科學專業知識可以幫助使數據清理和預處理更簡單、更快捷。現在,您已經準備好了預處理的數據集,您可以通過在此銀行營銷數據集上構建一個簡單的預測模型來進一步實現這一點。
原文鏈接:如何利用 ChatGPT 進行自動數據清理和預處理 (mvrlink.com)


)


![[centos]設置主機名](http://pic.xiahunao.cn/[centos]設置主機名)

![[python] 使用Jieba工具中文分詞及文本聚類概念](http://pic.xiahunao.cn/[python] 使用Jieba工具中文分詞及文本聚類概念)


