圖表,是指將既得數據用圖形的方式表示出來。在前文中我們介紹過如何使用Java程序來為Excel文檔創建圖表的方法。本文將通過使用Java程序來演示如何創建PowerPoint圖表及為圖表添加趨勢線。趨勢線的運用能夠顯示數據的變化趨勢,同時能夠幫助預測數據的未來值。
Jar文件獲取及導入:
方法1:通過官網下載獲取jar包。解壓后將lib文件夾下的Spire.Presentation.jar文件導入Java程序。(如下圖)
方法2:通過maven倉庫安裝導入。具體安裝教程參見此網頁。
【示例1】創建圖表
import com.spire.presentation.*;
import com.spire.pdf.tables.table.*;
import com.spire.presentation.charts.*;
import com.spire.presentation.drawing.FillFormatType;
import java.awt.geom.Rectangle2D;
import java.lang.Object;
public class AddChart {
public static void main(String[] args) throws Exception {
//實例化一個Presentation對象
Presentation presentation = new Presentation();
//插入柱形圖
Rectangle2D.Double rect = new Rectangle2D.Double(40, 100, 550, 320);
IChart chart = null;
chart = presentation.getSlides().get(0).getShapes().appendChart(ChartType.COLUMN_CLUSTERED, rect);
//添加表名
chart.getChartTitle().getTextProperties().setText("銷售報表");
chart.getChartTitle().getTextProperties().isCentered(true);
chart.getChartTitle().setHeight(30);
chart.hasTitle(true);
//創建后臺數據表
DataTable dataTable = new DataTable();
dataTable.getColumns().add(new DataColumn("銷售額", DataTypes.DATATABLE_STRING));
dataTable.getColumns().add(new DataColumn("谷物", DataTypes.DATATABLE_INT));
dataTable.getColumns().add(new DataColumn("糧油", DataTypes.DATATABLE_INT));
dataTable.getColumns().add(new DataColumn("百貨", DataTypes.DATATABLE_INT));
DataRow row1 = dataTable.newRow();
row1.setString("銷售額", "門店1");
row1.setInt("谷物", 250);
row1.setInt("糧油", 150);
row1.setInt("百貨", 99);
DataRow row2 = dataTable.newRow();
row2.setString("銷售額", "門店2");
row2.setInt("谷物", 270);
row2.setInt("糧油", 150);
row2.setInt("百貨", 99);
DataRow row3 = dataTable.newRow();
row3.setString("銷售額", "門店3");
row3.setInt("谷物", 310);
row3.setInt("糧油", 120);
row3.setInt("百貨", 49);
DataRow row4 = dataTable.newRow();
row4.setString("銷售額", "門店4");
row4.setInt("谷物", 330);
row4.setInt("糧油", 120);
row4.setInt("百貨", 49);
DataRow row5 = dataTable.newRow();
row5.setString("銷售額", "門店5");
row5.setInt("谷物", 360);
row5.setInt("糧油", 150);
row5.setInt("百貨", 141);
DataRow row6 = dataTable.newRow();
row6.setString("銷售額", "門店6");
row6.setInt("谷物", 380);
row6.setInt("糧油", 150);
row6.setInt("百貨", 135);
dataTable.getRows().add(row1);
dataTable.getRows().add(row2);
dataTable.getRows().add(row3);
dataTable.getRows().add(row4);
dataTable.getRows().add(row5);
dataTable.getRows().add(row6);
//將數據寫入圖表
for (int c = 0; c < dataTable.getColumns().size(); c++) {
chart.getChartData().get(0, c).setText(dataTable.getColumns().get(c).getColumnName());
}
for (int r = 0; r < dataTable.getRows().size(); r++) {
Object[] datas = dataTable.getRows().get(r).getArrayList();
for (int c = 0; c < datas.length; c++) {
chart.getChartData().get(r + 1, c).setValue(datas[c]);
}
}
//設置系列標簽
chart.getSeries().setSeriesLabel(chart.getChartData().get("B1", "D1"));
//設置類別標簽
chart.getCategories().setCategoryLabels(chart.getChartData().get("A2", "A7"));
//為各個系列賦值
chart.getSeries().get(0).setValues(chart.getChartData().get("B2", "B7"));
chart.getSeries().get(1).setValues(chart.getChartData().get("C2", "C7"));
chart.getSeries().get(2).setValues(chart.getChartData().get("D2", "D7"));
chart.getSeries().get(2).getFill().setFillType(FillFormatType.SOLID);
chart.getSeries().get(2).getFill().getSolidColor().setKnownColor(KnownColors.LIGHT_BLUE);
//設置系列重疊
chart.setOverLap(-50);
//設置類別間距
chart.setGapDepth(200);
//保存文檔
presentation.saveToFile("output/CreateChart.pptx", FileFormat.PPTX_2010);
}
}
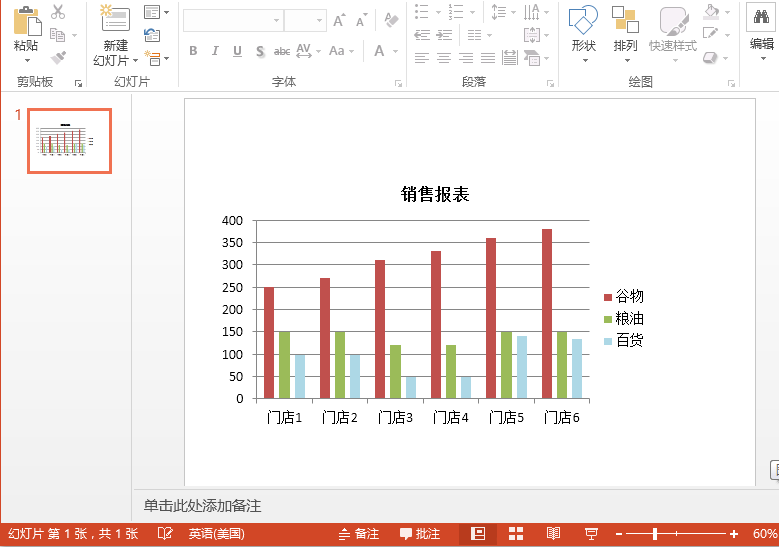
創建效果:
【示例2】為圖表添加趨勢線
import com.spire.presentation.FileFormat;
import com.spire.presentation.ISlide;
import com.spire.presentation.Presentation;
import com.spire.presentation.charts.IChart;
import com.spire.presentation.charts.ITrendlines;
import com.spire.presentation.charts.TrendlineSimpleType;
public class AddTrendline {
public static void main(String[] args) throws Exception {
//創建Presentation實例
Presentation ppt = new Presentation();
//加載PowerPoint文檔
ppt.loadFromFile("C:\\Users\\Test1\\Desktop\\CreateChart.pptx");
//獲取第一張幻燈片
ISlide slide = ppt.getSlides().get(0);
//獲取幻燈片上的圖表
IChart chart = (IChart)slide.getShapes().get(0);
//給圖表的第一個數據系列添加線性趨勢線
ITrendlines trendLine = chart.getSeries().get(0).addTrendLine(TrendlineSimpleType.LINEAR);
//不顯示公式
//trendLine.setdisplayEquation(false);
//不顯示R平方值
//trendLine.setdisplayRSquaredValue(false);
//保存結果文檔
ppt.saveToFile("output/AddTrendline.pptx", FileFormat.PPTX_2013);
}
}
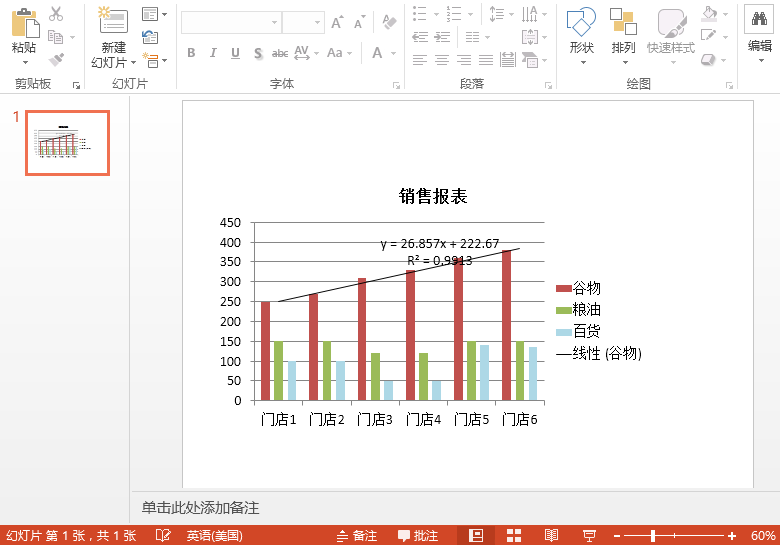
添加效果:
(本文完)


:system()函數使用【轉】)

組件開發詳解)
![[App Store Connect幫助]八、維護您的 App(4.2)查看評分與評論](http://pic.xiahunao.cn/[App Store Connect幫助]八、維護您的 App(4.2)查看評分與評論)


)


