上一篇推文中我們解釋了GO富集分析及可視化(GO富集分析及可視化),除了GO富集分析,我們經常在paper中看到KEGG分析,KEGG是什么呢,Kyoto Encyclopedia of Genes and Genomes,京都基因和基因組百科全書,是系統分析基因功能,聯系基因組信息和功能信息的知識庫,其中包含有大量的通路圖。
我們今天來介紹如何繪制KEGG的barplot和dotplot。
library(DOSE)
library(org.Hs.eg.db)
library(clusterProfiler)
geneNames <- names(geneList)[1:100] ##數據來自DOSE這個包
enrich <- enrichKEGG(gene = geneNames,organism = "hsa",pvalueCutoff = .1,qvalueCutoff = .1)
我們先來看看結果
> head(enrich)ID                                                   Description GeneRatio  BgRatio       pvalue     p.adjust       qvalue       geneID Count
hsa04110 hsa04110                                                    Cell cycle 8/48 124/8081 5.530092e-07 6.470207e-05 5.937572e-05    8318/991/9133/890/983/4085/7272/1111     8
hsa04218 hsa04218                                           Cellular senescence 7/48 156/8081 3.308115e-05 1.935248e-03 1.775936e-03    2305/4605/9133/890/983/51806/1111     7
hsa04114 hsa04114                                                Oocyte meiosis 6/48 129/8081 1.043242e-04 4.068644e-03 3.733708e-03    991/9133/983/4085/51806/6790     6
hsa04657 hsa04657                                       IL-17 signaling pathway 5/48  94/8081 2.206944e-04 5.747656e-03 5.274502e-03    4312/6280/6279/6278/3627     5
hsa04061 hsa04061 Viral protein interaction with cytokine and cytokine receptor 5/48 100/8081 2.947516e-04 5.747656e-03 5.274502e-03    3627/10563/6373/4283/6362     5
hsa04914 hsa04914                       Progesterone-mediated oocyte maturation 5/48 100/8081 2.947516e-04 5.747656e-03 5.274502e-03    9133/890/983/4085/6790     5
因為這個包里的數據已經是ENTREZID所以不需要對基因名稱做轉化,如果基因名字不是ENTREZID,需要添加一行轉換基因名稱的代碼,把SYMBOL id轉化為entrezid,代碼如下:
gene <- mapIds(org.Hs.eg.db, geneNames, 'ENTREZID', 'SYMBOL')接下來開始圖形的繪制
barplot(enrich,showCategory=30)
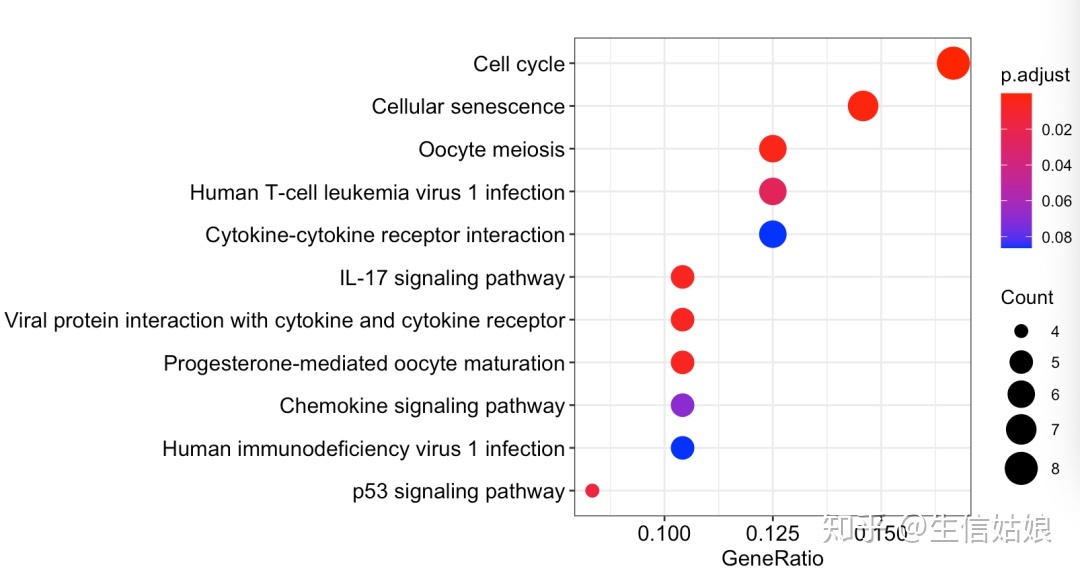
dotplot(enrich,showCategory=30)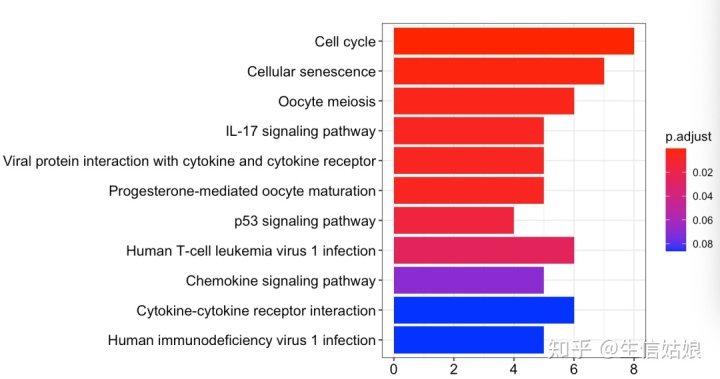


)


)


)


)
