樣本均值的抽樣分布
One of the most important concepts discussed in the context of inferential data analysis is the idea of sampling distributions. Understanding sampling distributions helps us better comprehend and interpret results from our descriptive as well as predictive data analysis investigations. Sampling distributions are also frequently used in decision making under uncertainty and hypothesis testing.
在推論性數據分析的背景下討論的最重要的概念之一是采樣分布的想法。 了解采樣分布有助于我們更好地理解和解釋描述性和預測性數據分析調查的結果。 抽樣分布也經常用于不確定性和假設檢驗的決策中。
什么是抽樣分布? (What are sampling distributions?)
You may already be familiar with the idea of probability distributions. A probability distribution gives us an understanding of the probability and likelihood associated with values (or range of values) that a random variable may assume. A random variable is a quantity whose value (outcome) is determined randomly. Some examples of a random variable include, the monthly revenue of a retail store, the number of customers arriving at a car wash location on any given day, the number of accidents on a certain highway on any given day, weekly sales volume at a retail store, etc. Although the outcome of a random variable is random, the probability distribution allows us to gain and understanding about the likelihood and probabilities of different values occurring in the outcome. Sampling distributions are probability distributions that we attach to sample statistics of a sample.
您可能已經熟悉概率分布的概念。 概率分布使我們對與隨機變量可能采用的值(或值的范圍)相關的概率和似然性有所了解。 隨機變量是其值(結果)是隨機確定的數量。 隨機變量的一些示例包括:零售商店的月收入,在任何給定的一天到達洗車地點的顧客數量,在任何給定的一天在特定高速公路上發生的事故數量,在零售店的每周銷量盡管隨機變量的結果是隨機的,但概率分布使我們獲得并了解結果中出現的不同值的可能性和概率。 抽樣分布是我們附加到樣本的樣本統計量的概率分布。
樣本均值作為樣本統計量 (Sample mean as a sample statistic)
A sample statistic (also known simply as a statistic) is a value learned from a sample. Here is an example, suppose you collect the results of a survey filled out by 250 randomly selected individuals who live in a certain neighborhood. Based on the survey results you realize that the average annual income of the individuals in this sample is $82,512. This is a sample statistic and is denoted by x? = $82,512. The sample mean is also a random variable (denoted by X?) with a probability distribution. The probability distribution for X? is called the sampling distribution for the sample mean. Sampling distribution could be defined for other types of sample statistics including sample proportion, sample regression coefficients, sample correlation coefficient, etc.
樣本統計量(也簡稱為統計量)是從樣本中學到的值。 這是一個示例,假設您收集由居住在某個社區中的250個隨機選擇的個人填寫的調查結果。 根據調查結果,您會發現此樣本中的個人平均年收入為$ 82,512。 這是一個樣本統計量,用x?= $ 82,512表示。 樣本均值也是具有概率分布的隨機變量(用X表示)。 X?的概率分布稱為樣本均值的采樣分布。 可以為其他類型的樣本統計定義樣本分布,包括樣本比例,樣本回歸系數,樣本相關系數等。
You might be wondering why X? is a random variable while the sample mean is just a single number! The key to understanding this lies in the idea of sample to sample variability. This idea refers to the fact that samples drawn from the same population are not identical. Here’s an example, suppose in the example above, instead of conducting only one survey of 250 individuals living in a particular neighborhood, we conducted 35 samples of the same size in that neighborhood. If we calculated the sample mean x? for each of the 35 samples, you would be getting 35 different values. Now suppose, hypothetically, we conducted many many surveys of the same size in that neighborhood. We would be getting many many (different) values for sample means. The distribution resulting from those sample means is what we call the sampling distribution for sample mean. Thinking about the sample mean from this perspective, we can imagine how X? (note the big letter) is the random variable representing sample means and x? (note the small letter) is just one realization of that random variable.
您可能想知道為什么X?是一個隨機變量,而樣本均值只是一個數字! 理解這一點的關鍵在于樣本之間的差異性 。 這個想法指的是從相同總體中抽取的樣本不完全相同的事實。 這是一個示例,假設在上面的示例中,我們沒有對居住在特定社區中的250個人進行一次調查,而是在該社區中進行了35個相同大小的樣本。 如果我們為35個樣本中的每個樣本計算樣本均值x? ,您將獲得35個不同的值。 現在假設,我們在該鄰里進行了許多相同規模的調查。 我們將獲得許多(不同)樣本均值值。 由這些樣本均值得出的分布就是所謂的樣本均值的采樣分布。 從這個角度考慮樣本均值,我們可以想象X?(注意大字母)是代表樣本均值和x? (注意小字母)的隨機變量的方式。 只是該隨機變量的一種實現。
樣本均值的抽樣分布 (Sampling distribution of the sample mean)
Assuming that X represents the data (population), if X has a distribution with average μ and standard deviation σ, and if X is approximately normally distributed or if the sample size n is large,
假設X代表數據(種群),如果X具有平均μ和標準差σ的分布,并且X近似呈正態分布,或者樣本量n大,

The above distribution is only valid if,
以上分配僅在以下情況下有效:
X is approximately normal or sample size n is large, and,
X近似正常或樣本大小n大,并且,
- the data (population) standard deviation σ is known. 數據(種群)標準偏差σ是已知的。
If X is normal, then X? is also normally distributed regardless of the sample size n. Central Limit Theorem tells us that even if X is not normal, if the sample size is large enough (usually greater than 30), then X?’s distribution is approximately normal (Sharpe, De Veaux, Velleman and Wright, 2020, pp. 318–320). If X? is normal, we can easily standardize and convert it to the standard normal distribution Z.
如果X是正態的,則X′也將呈正態分布,而與樣本大小n無關。 中心極限定理告訴我們,即使X不是正態的,如果樣本量足夠大(通常大于30),則X的分布近似正態(Sharpe,De Veaux,Velleman和Wright,2020年,第318-320頁) )。 如果X?是正態的,我們可以輕松地將其標準化并將其轉換為標準正態分布Z。
If the population standard deviation σ is not known, we cannot assume that the sample mean X? is normally distributed. If certain conditions are satisfied (explained below), then we can transform X? to another random variable t such that,
如果總體標準差σ是不知道,我們不能假設樣本均值的正態分布。 如果滿足某些條件(如下所述),那么我們可以將X transform轉換為另一個隨機變量t,這樣,

The random variable t is said to follow the t-distribution with n-1 degrees of freedom, where n is the sample size. The t-distribution is bell-shaped and symmetric (just like the normal distribution) but has fatter tails compared to the normal distribution. This means values further away from the mean have a higher likelihood of occurring compared to that in the normal distribution.
據說隨機變量t跟隨t分布具有n-1個自由度,其中n是樣本大小。 t分布呈鐘形且對稱(就像正態分布一樣),但與正態分布相比,其尾部更胖。 這意味著與正態分布相比,遠離平均值的值出現的可能性更高。
The conditions to use the t-distribution for the random variable t are as follows (Sharpe et al., 2020, pp. 415–420):
將t分布用于隨機變量t的條件如下(Sharpe等人,2020年,第415-420頁):
If X is normally distributed, even for small sample sizes (n<15), the t-distribution can be used.
如果X是正態分布的,即使對于小樣本量( n < 15),也可以使用t分布。
- If the sample size is between 15 and 40, the t-distribution can be used as long as X is unimodal and reasonably symmetric. 如果樣本大小在15到40之間,則只要X是單峰且合理對稱,就可以使用t分布。
- For sample sizes greater than 40, the t-distribution can be used unless X’s distribution is heavily skewed. 對于大于40的樣本,除非X的分布嚴重偏斜,否則可以使用t分布。
用Python模擬 (Simulation with Python)
Let’s draw a sample of size n=250 from the normal distribution. Here we are assuming that our data is normally distributed and has parameters μ = 20 and σ = 3. Collecting one sample from this population
讓我們從正態分布中繪制一個大小為n = 250的樣本。 這里我們假設我們的數據是正態分布的,并且參數μ= 20和σ=3。從該總體中收集一個樣本
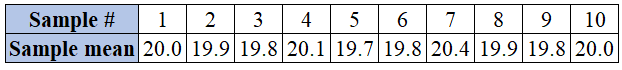
Running this code once gives me one instance (or realization) of the random variable X?. Below are 10 values for x? after I ran this code 10 times.
運行此代碼一次,便為我提供了隨機變量X?的一個實例(或實現)。 在我運行此代碼10次后,下面是x?的 10個值。
But if I ran this code 10,000 times and recorded the values of x? and plotted the frequency (or density) of the values, I would get the following result.
但是,如果我運行此代碼10,000次并記錄了x values的值并繪制了這些值的頻率(或密度),我將得到以下結果。
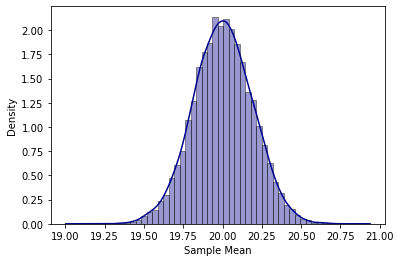
As you can see, the distribution is approximately symmetric and bell-shaped (just like the normal distribution) with an average of approximately 20 and a standard error that is approximately equal to 3/sqrt(250) = 0.19.
如您所見,分布近似對稱且呈鐘形(就像正態分布一樣),平均分布約20,標準誤差約等于3 / sqrt(250)= 0.19。
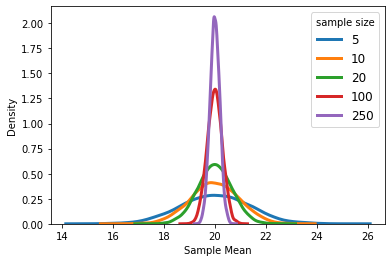
Sampling from the same population with different sample sizes will result in different measures of spread in the outcome distribution. As we expect, increasing the sample size will reduce the standard error and therefore, the distribution will be narrower around its average. Note that the distribution of X? is normal even for extremely small sample sizes. This is because X is normally distributed.
從具有不同樣本量的同一總體中進行采樣將導致結果分布中差異的度量不同。 正如我們所期望的,增加樣本量將減少標準誤差,因此,分布將在其平均值附近變窄。 請注意,即使樣本量非常小,X?的分布也是正常的。 這是因為X是正態分布的。
如果總體(數據)不正常怎么辦? (What if the population (data) is not normal?)
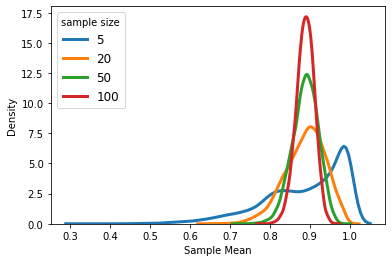
No worries! Even if your data is not normally distributed, if the sample size is large enough, the distribution of X? can still be approximated using the normal distribution (according to Central Limit Theorem). The following figure shows the distribution of X? when X is heavily skewed to the left. As you can see, X?’s distribution tends to mimic the distribution of X for small sample sizes. However, as sample size grows the distribution of X? becomes more symmetric and bell-shaped. As mentioned above, if sample size is large (usually larger than 30), X?’s distribution is approximately normal regardless of what the distribution of X is.
別擔心! 即使您的數據不是正態分布的,如果樣本量足夠大,仍可以使用正態分布(根據中心極限定理)來近似估計X?的分布。 下圖顯示了X嚴重偏向左側時X?的分布。 如您所見,對于小樣本量,X?的分布趨向于模仿X的分布。 但是,隨著樣本量的增加,X 1的分布變得更加對稱和呈鐘形。 如上所述,如果樣本量較大(通常大于30),則X的分布近似為正態,而與X的分布無關。
示例和應用 (Example and applications)
Knowing the distribution of X? can help us solve problems, where we need to use inferential data analysis to make decisions under uncertainty. Many business problems require decision making tools that are able to address the stochastic and probabilistic nature of random event. Hypothesis testing is one of those tools frequently used in many different business domains including retail operations, marketing, quality assurance, etc.
知道X?的分布可以幫助我們解決問題,在這種情況下,我們需要使用推斷數據分析來在不確定的情況下做出決策。 許多業務問題都需要決策工具,這些工具必須能夠解決隨機事件的隨機性和概率性。 假設檢驗是許多不同業務領域(包括零售運營,市場營銷,質量保證等)中經常使用的工具之一。
For example, suppose a retail store has run a major marketing campaign and is interested to investigate the effects of the campaign on average sales of the store. Suppose that the management would like to investigate if average daily sales is now greater than $8,000. The following hypotheses demonstrate this research question:
例如,假設一家零售商店進行了一次大規模的營銷活動,并且有興趣調查該活動對商店平均銷售額的影響。 假設管理層想調查現在的平均每日銷售額是否大于8,000美元。 以下假設證明了該研究問題:

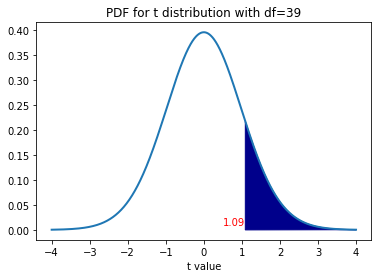
Note that we are conducting a test on the population average sales, hence the μ. To address the test, suppose we record sales volumes over 40 days (sample with n=40) and calculate the required statistics. Suppose the average and standard deviation of daily sales volumes are calculated as x?=$8,100 and s=$580, respectively. Since the value of σ is not known, and given that the above hypothesis test is being addressed, we can convert X? to the random variable t with n-1=39 degrees of freedom where,
請注意,我們正在對人口平均銷售額(即μ)進行測試。 為了進行測試,假設我們記錄了40天的銷售量( n = 40的樣本)并計算所需的統計數據。 假設每日銷售量的平均偏差和標準偏差分別計算為x?= $ 8,100和s = $ 580 。 由于σ的值未知,并且鑒于上述假設檢驗正在解決,我們可以將X?轉換為n-1 = 39自由度的隨機變量t ,其中,

To address the test, we need to find the p-value associated with the test. This property is calculated as,
要處理該測試,我們需要找到與該測試關聯的p值。 此屬性的計算公式為

The probability density function for the random variable t along with the p-value of the test are depicted below.
下面描述了隨機變量t的概率密度函數以及檢驗的p值。
The following will find the p-value for the test.
以下將找到測試的p值。
The calculations give a p-value equal to approximately 0.14. By most standards (significance levels), this is a large p-value indicating that we fail to reject the null hypothesis. In other words, based on the distribution of X? and the sample collected, we cannot conclude that the average daily sales volume at the retail store, μ, is greater than $8000. This calculation was possible only because we knew what the distribution of X? was.
計算得出的p值大約等于0.14。 按照大多數標準(顯著性水平),這是一個很大的p值,表明我們無法拒絕原假設。 換句話說,根據X的分布和收集的樣本,我們不能得出結論,零售商店的平均日銷售量μ大于$ 8000。 僅因為我們知道X?的分布是什么,才可能進行此計算。
Sampling distributions could be defined for other sample statistics (e.g., sample proportions, regression predictor coefficients, etc.) and are also used in other contexts like confidence and prediction intervals or inferential analysis on regression results.
可以為其他樣本統計數據(例如,樣本比例,回歸預測系數等)定義采樣分布,也可以在其他情況下使用采樣分布,例如置信度和預測區間或對回歸結果進行推論分析。
[1]: Sharpe N. R., De Veaux R. D., Velleman P. F., Wright D. (2020) Business Statistics, Fourth Canadian Edition. Pearson Canada Inc.
[1]:Sharpe NR,De Veaux RD,Velleman PF,Wright D.(2020) 商業統計,加拿大第四版 。 培生加拿大公司
翻譯自: https://towardsdatascience.com/sampling-distribution-sample-mean-fcf69484535e
樣本均值的抽樣分布
本文來自互聯網用戶投稿,該文觀點僅代表作者本人,不代表本站立場。本站僅提供信息存儲空間服務,不擁有所有權,不承擔相關法律責任。 如若轉載,請注明出處:http://www.pswp.cn/news/389346.shtml 繁體地址,請注明出處:http://hk.pswp.cn/news/389346.shtml 英文地址,請注明出處:http://en.pswp.cn/news/389346.shtml
如若內容造成侵權/違法違規/事實不符,請聯系多彩編程網進行投訴反饋email:809451989@qq.com,一經查實,立即刪除!相關文章
)
玩轉ceph性能測試---對象存儲(一)
![[BZOJ 4300]絕世好題](http://pic.xiahunao.cn/[BZOJ 4300]絕世好題)
[BZOJ 4300]絕世好題

因果關系和相關關系 大數據_數據科學中的相關性與因果關系

Pytorch構建模型的3種方法

vue取數據第一個數據_我作為數據科學家的第一個月

Flask-SocketIO 簡單使用指南


Symbol Mc1000 聲音的設置以及播放

/bin/bash^M: 壞的解釋器: 沒有那個文件或目錄

rcp rapido_為什么氣流非常適合Rapido

pandas處理丟失數據與數據導入導出

Mysql5.7開啟遠程

分類結果可視化python_可視化分類結果的另一種方法

算法組合 優化算法_算法交易簡化了風險價值和投資組合優化

Symbol Mc1000 快捷鍵 的 設置 事件 開發

pandas合并concatmerge和plot畫圖

Android跳轉WIFI界面的四種方式

PS摳發絲技巧 「選擇并遮住…」

covid 19如何重塑美國科技公司的工作文化
