1. 通過 myChart.getZr().on('click', fn) 監聽整個圖表的點擊事件,注冊回調
myChart.getZr().on('click', () => {//拿到index即可取出被點擊數據的所有信息console.log(clickIndex)
})
2. 在 tooltip 的 formatter 函數中,每次調用都記錄下需要的參數(一般取dataIndex),在回調中使用參數
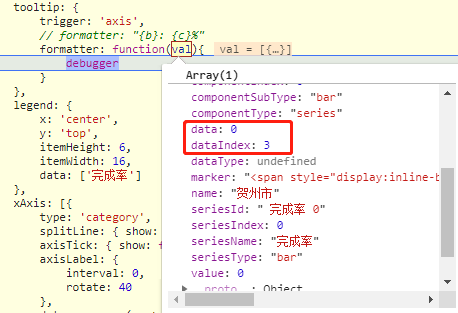
var clickIndex
let option = {tooltip: 'axis',formatter: val => {clickIndex = val[0].dataIndexreturn 'tooltip'}
}
參考: https://github.com/apache/incubator-echarts/issues/4375


...)


