一:背景
1. 講故事
哈哈,再次見到物流類軟件,上個月有位朋友找到我,說他的程序出現了 CPU 爆高,讓我幫忙看下什么原因,由于那段時間在苦心研究 C++,分析和經驗分享也就懈怠了,今天就給大家安排上。
話不多說,上 windbg 說話。
二:WinDbg 分析
1. CPU 真的爆高嗎
既然說 CPU 爆高,那就用 !tp 驗證下。
0:000>?!tpMethod?table?is?shared?(not?implemented):?System.Threading.ThreadPool
CPU?utilization:?81?Unknown?format?characterUnknown?format?control?characterWorker?Thread:?Total:?203?Running:?183?Idle:?0?MaxLimit:?300?MinLimit:?150
Work?Request?in?Queue:?0
--------------------------------------
Number?of?Timers:?40
--------------------------------------
Completion?Port?Thread:Total:?21?Free:?21?MaxFree:?80?CurrentLimit:?21?MaxLimit:?300?MinLimit:?150
從卦中看確實 CPU=81%,不過輸出信息很奇怪,方法表都出錯了,猜的不錯應該是觸發 GC 把 托管堆給關閉了,源碼如下:
GCScan::GcRuntimeStructuresValid?(FALSE);plan_phase?(n);GCScan::GcRuntimeStructuresValid?(TRUE);也可以用 !dumpheap -stat 來驗證。
0:000>?!dumpheap?-stat
The?garbage?collector?data?structures?are?not?in?a?valid?state?for?traversal.
It?is?either?in?the?"plan?phase,"?where?objects?are?being?moved?around,?or
we?are?at?the?initialization?or?shutdown?of?the?gc?heap.?Commands?related?to?
displaying,?finding?or?traversing?objects?as?well?as?gc?heap?segments?may?not?
work?properly.?!dumpheap?and?!verifyheap?may?incorrectly?complain?of?heap?
consistency?errors.
Could?not?request?method?table?data?for?object?000001E49376D520?(MethodTable:?FFFFFFFFFFE026C0).
2. 為什么會觸發 GC
此時我們已知道是 GC 觸發,接下來可以通過 !t + !clrstack 找到那個觸發 GC 的線程,通過線程棧看看正在干嘛 ?
0:000>?!t?
ThreadCount:??????382
UnstartedThread:??0
BackgroundThread:?340
PendingThread:????0
DeadThread:???????0
Hosted?Runtime:???noLock??DBG???ID?????OSID?ThreadOBJ???????????State?GC?Mode?????GC?Alloc?Context??????????????????Domain???????????Count?Apt?Exception0????1?????1ba4?000001E45C018C90????2a020?Preemptive??0000000000000000:0000000000000000?000001e45c368cb0?1?????MTA?297??286?????2144?000001E478521200??1029220?Cooperative?0000000000000000:0000000000000000?000001e45c368cb0?0?????MTA?(GC)?(Threadpool?Worker)?0:297>?!clrstack?
OS?Thread?Id:?0x2144?(297)Child?SP???????????????IP?Call?Site0e?0000002f`2927ade0?00007ffa`afda2096?????coreclr!WKS::gc_heap::garbage_collect+0x2a1?[e:\a\_work\191\s\src\gc\gc.cpp?@?16967]?
0f?0000002f`2927aee0?00007ffa`afdbe746?????coreclr!WKS::GCHeap::GarbageCollectGeneration+0x156?[e:\a\_work\191\s\src\gc\gc.cpp?@?35107]?
10?(Inline?Function)?--------`--------?????coreclr!WKS::gc_heap::try_allocate_more_space+0x1f5?[e:\a\_work\191\s\src\gc\gc.cpp?@?13197]?
11?0000002f`2927af30?00007ffa`afd80c9f?????coreclr!WKS::gc_heap::allocate_more_space+0x216?[e:\a\_work\191\s\src\gc\gc.cpp?@?13490]?
12?(Inline?Function)?--------`--------?????coreclr!WKS::gc_heap::allocate+0x37e?[e:\a\_work\191\s\src\gc\gc.cpp?@?13521]?
13?(Inline?Function)?--------`--------?????coreclr!WKS::GCHeap::Alloc+0x3e5?[e:\a\_work\191\s\src\gc\gc.cpp?@?34419]?
14?(Inline?Function)?--------`--------?????coreclr!Alloc+0x4be?[e:\a\_work\191\s\src\vm\gchelpers.cpp?@?241]?
15?(Inline?Function)?--------`--------?????coreclr!AllocateObject+0x512?[e:\a\_work\191\s\src\vm\gchelpers.cpp?@?1156]?
16?0000002f`2927af90?00007ffa`51c05122?????coreclr!JIT_New+0x5ff?[e:\a\_work\191\s\src\vm\jithelpers.cpp?@?2810]?
...
0000002F2927B228?00007ffaafd63aff?[HelperMethodFrame:?0000002f2927b228]?
0000002F2927B340?00007ffa51c05122?Jint.Native.Object.ObjectInstance..ctor(Jint.Engine)
0000002F2927B380?00007ffa51c058aa?Jint.Native.Array.ArrayConstructor.CreateArrayConstructor(Jint.Engine)
0000002F2927B3D0?00007ffa51c0407c?Jint.Engine..ctor(System.Action`1<Jint.Options>)
...
由于信息比較敏感,我就不過多的輸出了,不過可以看出 GC 的引發是由于 Jint 組件,查了下資料是 JavaScript 和 .NET 用來交互的,為了進一步驗證,觀察下此時 GC 觸發的代以及什么原因。
0:297>?dx?-r1?(*((coreclr!WKS::gc_mechanisms?*)0x7ffab021df90))
(*((coreclr!WKS::gc_mechanisms?*)0x7ffab021df90))?????????????????[Type:?WKS::gc_mechanisms][+0x000]?gc_index?????????:?0x984ab?[Type:?unsigned?__int64][+0x008]?condemned_generation?:?0?[Type:?int][+0x00c]?promotion????????:?1?[Type:?int][+0x010]?compaction???????:?1?[Type:?int][+0x014]?loh_compaction???:?0?[Type:?int][+0x018]?heap_expansion???:?0?[Type:?int][+0x01c]?concurrent???????:?0x0?[Type:?unsigned?int][+0x020]?demotion?????????:?1?[Type:?int][+0x024]?card_bundles?????:?1?[Type:?int][+0x028]?gen0_reduction_count?:?0?[Type:?int][+0x02c]?should_lock_elevation?:?0?[Type:?int][+0x030]?elevation_locked_count?:?0?[Type:?int][+0x034]?elevation_reduced?:?0?[Type:?int][+0x038]?minimal_gc???????:?0?[Type:?int][+0x03c]?reason???????????:?reason_alloc_soh?(0)?[Type:?gc_reason][+0x040]?pause_mode???????:?pause_interactive?(1)?[Type:?WKS::gc_pause_mode][+0x044]?found_finalizers?:?1?[Type:?int][+0x048]?background_p?????:?0?[Type:?int][+0x04c]?b_state??????????:?bgc_not_in_process?(0)?[Type:?bgc_state][+0x050]?allocations_allowed?:?1?[Type:?int][+0x054]?stress_induced???:?0?[Type:?int][+0x058]?entry_memory_load?:?0x0?[Type:?unsigned?int][+0x05c]?exit_memory_load?:?0x0?[Type:?unsigned?int]
從卦中看,當前觸發的是 0 代GC,觸發原因是 0代 的閾值滿了,這是一個很正常的 GC 操作,理應不會造成 CPU 爆高,除非是那些傷害性比較大的 FULLGC,由于沒有更多的 dump 可以參考,到這里就沒法更進一步確認了。
3. 還有其他線索嗎
雖然 .NET 程序大多 CPU 爆高是由于 GC 的頻繁觸發所致,但也有其他情況,比如 CPU 密集型操作往往也會,就像我之前解讀 B站的LUA死循環導致的CPU爆高場景下如何通過 火焰圖 去尋找熱點函數。
那這個 dump 會不會也存在這種情況呢?不管有沒有,在一個 dump 的情況下也只能 死馬當作活馬醫 了,可以用 !runaway 查查當前線程運行時間。
0:297>?!runawayUser?Mode?TimeThread???????Time269:2354?????0?days?0:07:04.171274:15d4?????0?days?0:06:16.453280:1c98?????0?days?0:05:32.406284:438??????0?days?0:04:37.703283:183c?????0?days?0:04:29.531282:122c?????0?days?0:04:24.703288:2060?????0?days?0:03:59.953286:28d0?????0?days?0:03:56.640289:2a84?????0?days?0:03:50.859290:1224?????0?days?0:03:44.640291:2e4c?????0?days?0:03:29.937292:f0c??????0?days?0:03:28.656293:2454?????0?days?0:03:26.640275:2810?????0?days?0:03:23.828294:2f34?????0?days?0:03:22.312295:24ec?????0?days?0:03:17.625297:2144?????0?days?0:03:16.609298:2c34?????0?days?0:03:14.609299:2480?????0?days?0:03:11.218...線程還是蠻多的,采樣幾個看一下,發現有很多函數與 序列化 有關。
0:269>?!clrstack?
OS?Thread?Id:?0x2354?(269)Child?SP???????????????IP?Call?Site
0000002F080FD658?00007ffacb236124?[HelperMethodFrame:?0000002f080fd658]?
0000002F080FD770?00007ffab11d806b?System.Runtime.Serialization.Formatters.Binary.SizedArray..ctor()?[E:\A\_work\322\s\corefx\src\System.Runtime.Serialization.Formatters\src\System\Runtime\Serialization\Formatters\Binary\BinaryUtilClasses.cs?@?203]
0000002F080FD7A0?00007ffab11d6964?System.Runtime.Serialization.Formatters.Binary.BinaryParser.get_ObjectMapIdTable()?[E:\A\_work\322\s\corefx\src\System.Runtime.Serialization.Formatters\src\System\Runtime\Serialization\Formatters\Binary\BinaryParser.cs?@?57]
0000002F080FD7E0?00007ffa515132c1?System.Runtime.Serialization.Formatters.Binary.BinaryParser.ReadObjectWithMapTyped(System.Runtime.Serialization.Formatters.Binary.BinaryObjectWithMapTyped)?[E:\A\_work\322\s\corefx\src\System.Runtime.Serialization.Formatters\src\System\Runtime\Serialization\Formatters\Binary\BinaryParser.cs?@?532]
0000002F080FD8B0?00007ffab11d74ed?System.Runtime.Serialization.Formatters.Binary.BinaryParser.ReadObjectWithMapTyped(System.Runtime.Serialization.Formatters.Binary.BinaryHeaderEnum)?[E:\A\_work\322\s\corefx\src\System.Runtime.Serialization.Formatters\src\System\Runtime\Serialization\Formatters\Binary\BinaryParser.cs?@?504]0:280>?!clrstack?
OS?Thread?Id:?0x1c98?(280)Child?SP???????????????IP?Call?Site
0000002F185FCE38?00007ffacb236124?[HelperMethodFrame:?0000002f185fce38]?
0000002F185FCF30?00007ffaaf59bb61?System.String.Ctor(Char[],?Int32,?Int32)?[E:\A\_work\191\s\src\mscorlib\shared\System\String.cs?@?79]
0000002F185FCF90?00007ffa5033f984?Newtonsoft.Json.JsonTextReader.ParseReadString(Char,?Newtonsoft.Json.ReadType)
0000002F185FD040?00007ffa5099cd0b?Newtonsoft.Json.JsonTextReader.ReadStringValue(Newtonsoft.Json.ReadType)
0000002F185FD0B0?00007ffa5099cb0e?Newtonsoft.Json.JsonTextReader.ReadAsString()
0000002F185FD0E0?00007ffa514c68fc?Newtonsoft.Json.JsonReader.ReadForType(Newtonsoft.Json.Serialization.JsonContract,?Boolean)0:284>?!clrstack?
OS?Thread?Id:?0x438?(284)Child?SP???????????????IP?Call?Site
0000002F1ED7C9C8?00007ffacb236124?[RedirectedThreadFrame:?0000002f1ed7c9c8]?
0000002F1ED7CA48?00007ffaaf5a6863?System.Buffer.Memmove(Byte*,?Byte*,?UInt64)?[E:\A\_work\191\s\src\mscorlib\src\System\Buffer.cs?@?211]
0000002F1ED7CA50?00007ffaaf59bbb2?System.String.Ctor(Char[],?Int32,?Int32)?[E:\A\_work\191\s\src\mscorlib\shared\System\String.cs?@?83]
0000002F1ED7CAB0?00007ffa5033f984?Newtonsoft.Json.JsonTextReader.ParseReadString(Char,?Newtonsoft.Json.ReadType)
0000002F1ED7CB60?00007ffa5099cd0b?Newtonsoft.Json.JsonTextReader.ReadStringValue(Newtonsoft.Json.ReadType)
0000002F1ED7CBD0?00007ffa5099cb0e?Newtonsoft.Json.JsonTextReader.ReadAsString()
有了線索之后,接下來用 ~*e !clrstack 把所有的線程棧調出來,發現很多的 JsonConvert ,并且還有 5 個線程在做 DeepClone,截圖如下:
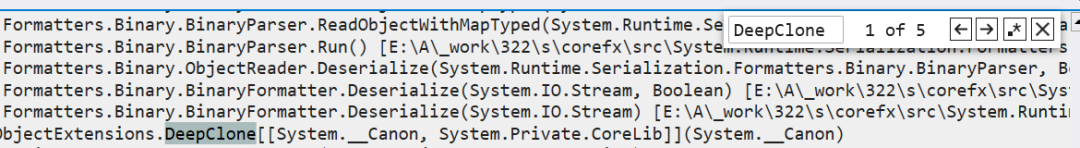
接下來把 DeepClone 函數導出來看看,發現是用 BinaryFormatter 來實現對象的深復制。
public?static?T?DeepClone<T>(this?T?obj)?where?T?:?class
{BinaryFormatter?binaryFormatter?=?new?BinaryFormatter();using?MemoryStream?memoryStream?=?new?MemoryStream();binaryFormatter.Serialize(memoryStream,?obj);memoryStream.Seek(0L,?SeekOrigin.Begin);return?(T)binaryFormatter.Deserialize(memoryStream);
}
把發現的這些線索反饋給朋友后,確實也驗證了是 序列化 造成的。

三:總結
分析完畢,這個 dump 給我們的教訓是:
對象的深復制慎用
BinaryFormatter這種流式操作,尤其是在大對象的情況下,它是一種 CPU 密集性的,建議采用 AutoMapper 這類 帶 ILEmit, ExpressionTree 還帶編譯緩存的開源工具包。高級調試是一場破案之旅,你第一眼看到的往往是程序故意讓你看到的,需要不斷的積累破案經驗練就一雙慧眼。


)


)

)


)
