pip install?mplfinance ;
python 安裝使用 TA-lib?
安裝主要在 http://www.lfd.uci.edu/~gohlke/pythonlibs/?
這個網站找到
TA_Lib-0.4.24-cp310-cp310-win_amd64.whl
pip install /pypi/TA_Lib-0.4.24-cp310-cp310-win_amd64.whl
編寫?mpf_kline_boll.py? 如下
# -*- coding: utf-8 -*-
import os
import sys
import matplotlib.pyplot as plt
import mplfinance as mpf
import pandas as pd
import tushare as ts
import talibif len(sys.argv) ==2:code = sys.argv[1]
else:print('usage: python mpf_kline_boll.py stockcode ')sys.exit(1)if len(code) !=6:print('stock code length: 6')sys.exit(2)# help(ts.get_k_data) 了解參數
df = ts.get_k_data(code, start='2023-01-01')
if len(df) <30:print(" len(df) <30 ")sys.exit(2)# 取收盤價
close = df['close'].values
# 計算布林線
df['upper'], df['mid20'], df['lower'] = talib.BBANDS(close, timeperiod=20, nbdevup=2, nbdevdn=2, matype=0)df.index = pd.to_datetime(df.date)
# 取樣 近期的數據
df2 = df[ df['date'] >'2023-05-01']
print(df2.tail(5))my_color = mpf.make_marketcolors(up='red', down='green', edge='black', wick='black')
my_style = mpf.make_mpf_style(marketcolors=my_color, gridaxis='both', gridstyle='-.', y_on_right=True)
#fig = mpf.figure(style=my_style, figsize=(12,6), facecolor=(0.82, 0.83, 0.85))
# 加畫3條布林線
ap = mpf.make_addplot(df2[['upper','mid20','lower']])
# 繪畫K線圖
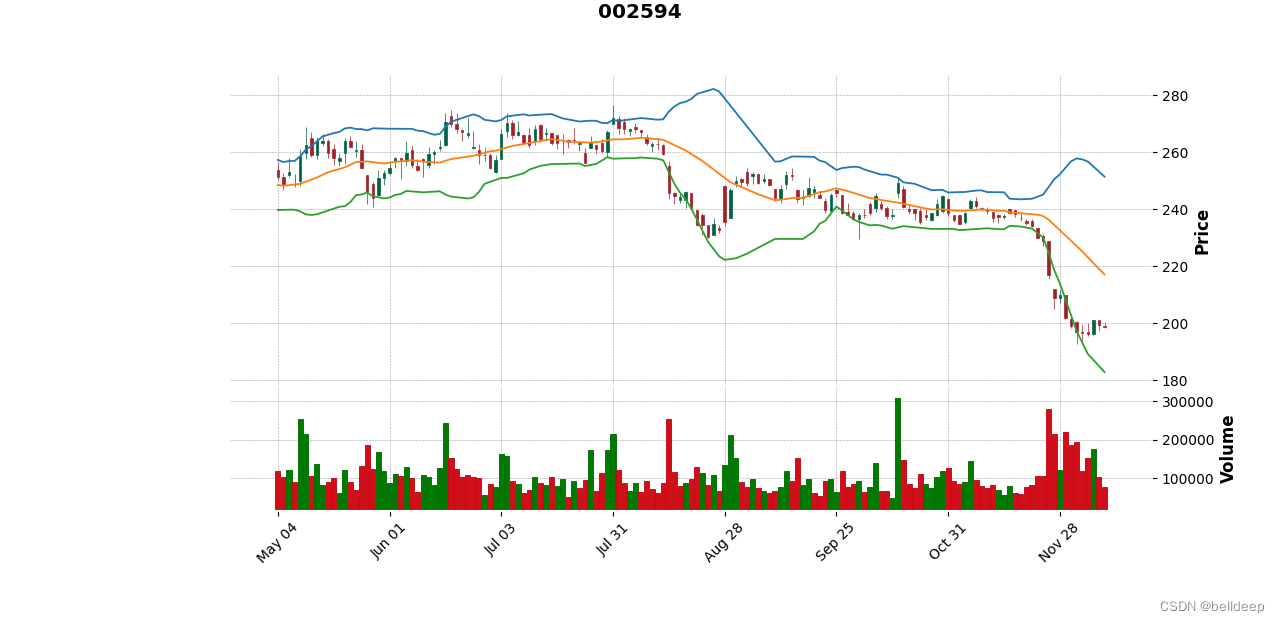
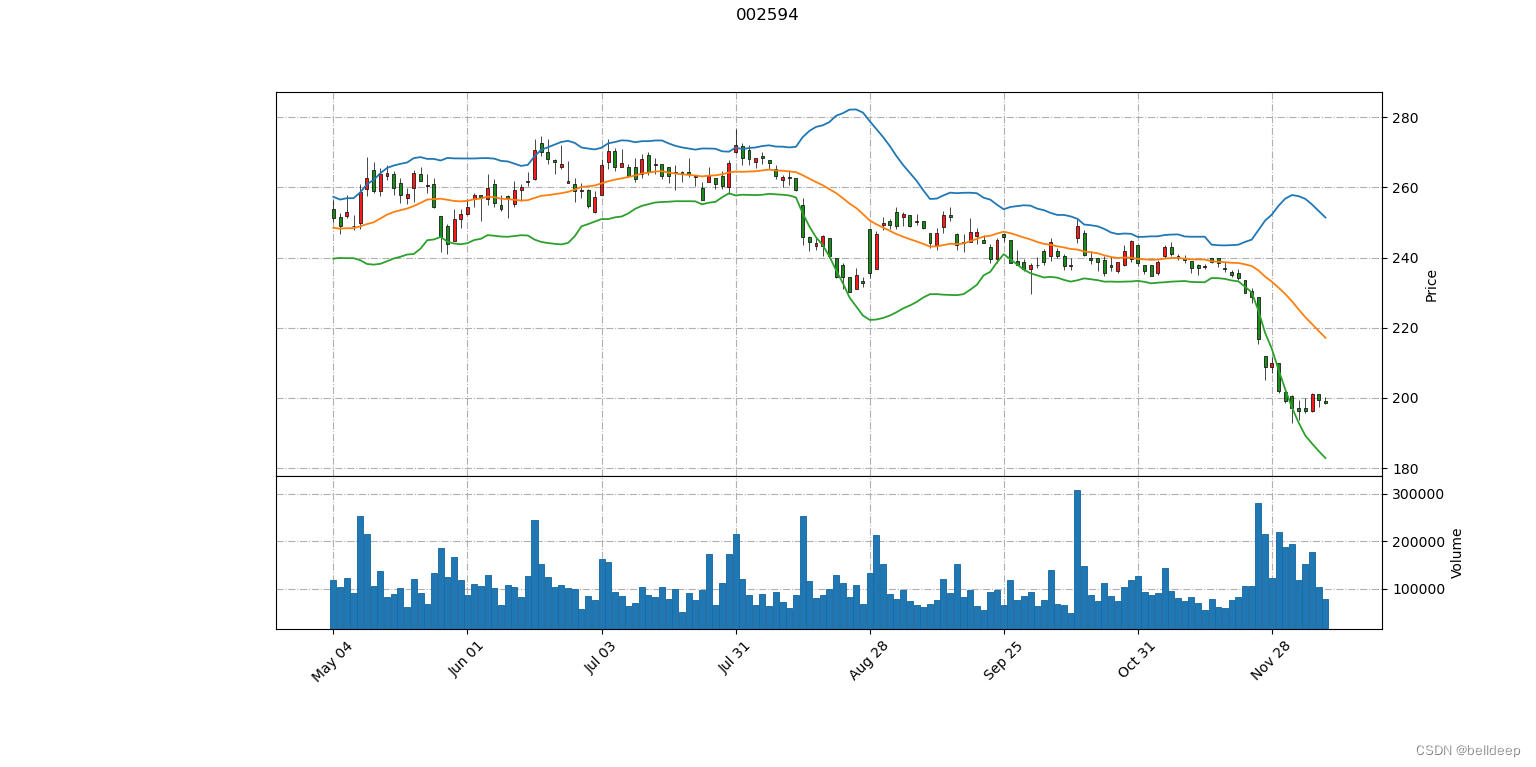
mpf.plot(df2, type='candle', style='charles', addplot=ap, volume=True, title=code)
#mpf.plot(df2, type='candle', style=my_style, addplot=ap, volume=True, title=code)
運行?python mpf_kline_boll.py 002594
參考:mplfinance最佳實踐:動態交互式高級K線圖(蠟燭圖)
)
)


)
,大卷積核提升不同特征感受野的注意力機制)


)
![smarty模版 [BJDCTF2020]The mystery of ip 1](http://pic.xiahunao.cn/smarty模版 [BJDCTF2020]The mystery of ip 1)

