1.安裝xdebug 擴展,phpinfo() 查看
2.配置php.ini
zend_extension=D:/phpstudy_pro/Extensions/php/php7.4.3nts/ext/php_xdebug.dll
xdebug.collect_params=1
xdebug.collect_return=1
xdebug.auto_trace=On
xdebug.trace_output_dir=D:/phpstudy_pro/Extensions/php_log/php7.4.3nts.xdebug.trace
xdebug.profiler_enable=On
xdebug.profiler_output_dir="D:\phpstudy_pro\Extensions\tmp\xdebug"
xdebug.remote_enable=On
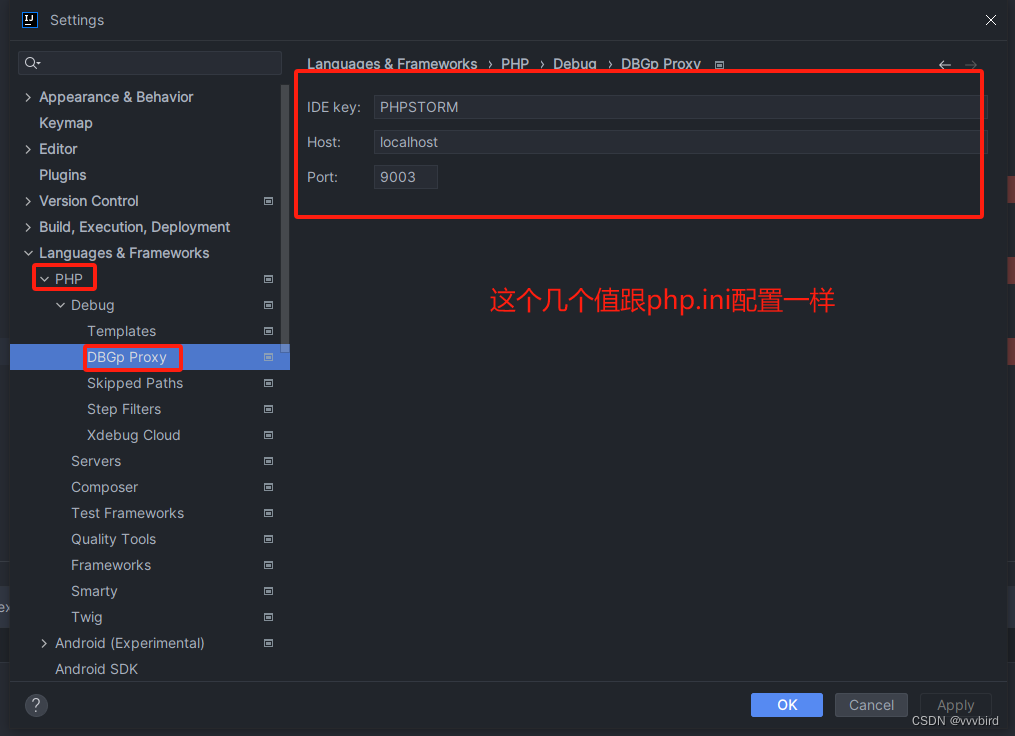
xdebug.idekey=PHPSTORM
xdebug.remote_autostart=On
xdebug.remote_host=localhost
xdebug.remote_port=9003
xdebug.remote_handler=dbgp
注意xdebug.idekey和xdebug.remote_port 要和稍后的IDEA一致。
3.配置php可執行路徑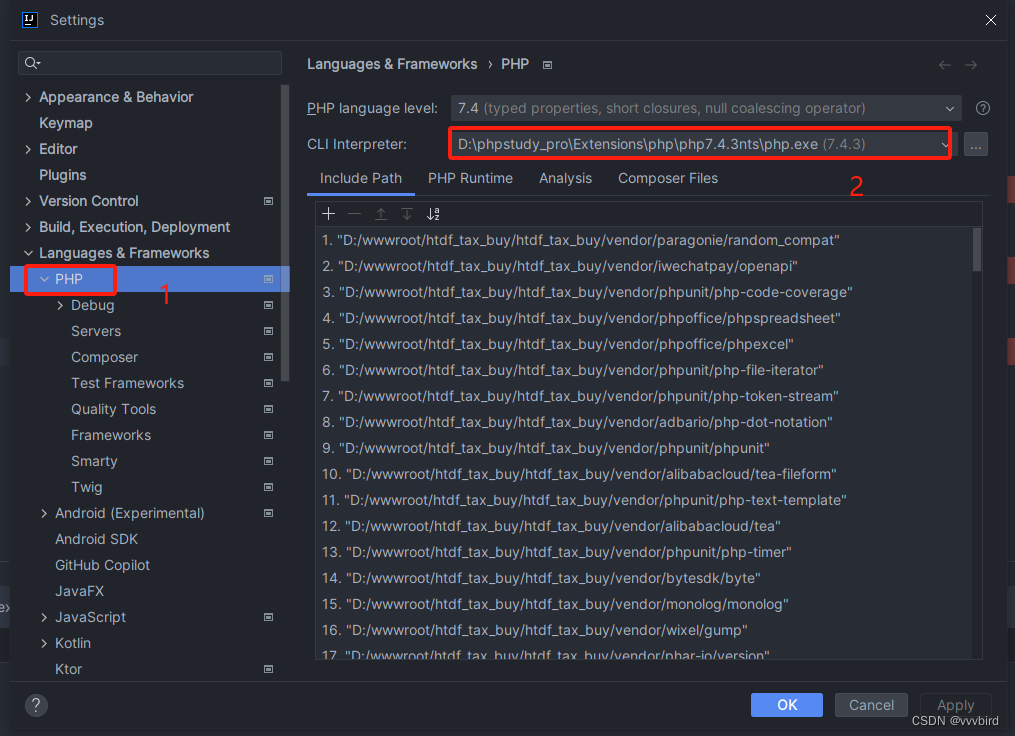
4.配置代理
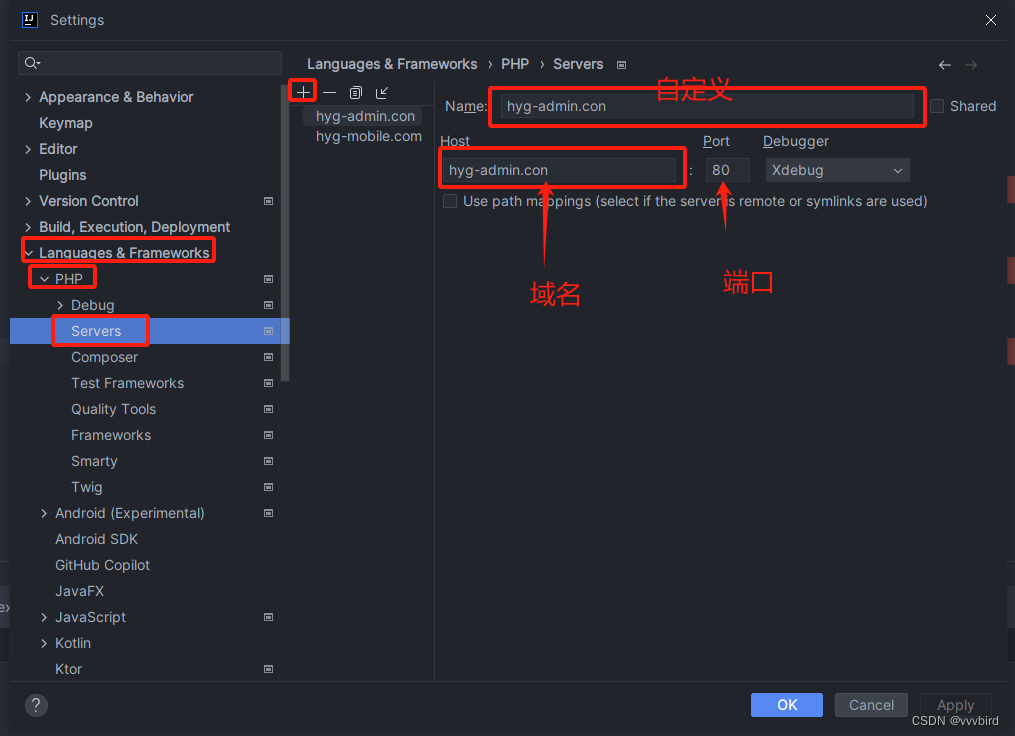
5.配置主機、域名
6.點擊apply后,重啟IDEA。
7.打開
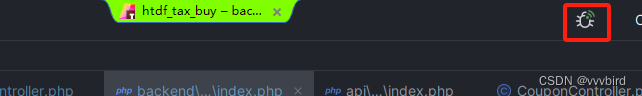
8.在顯示代碼行數上打斷點
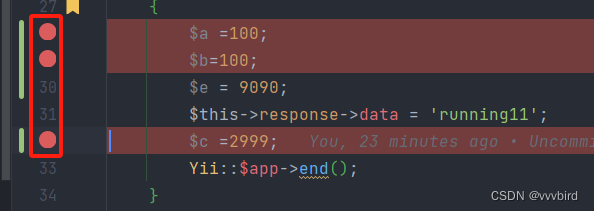
9.在瀏覽器上請求到打斷點的方法,即可觸發debug


:文件與文件系統的壓縮,打包與備份)
)


筆記——輸入/輸出)


