先安裝有china.js的版本
npm install echarts@4.8 --save ?//以前的版本有china.js
<template><div class="mapMain"><div id="map" style="width: 30vw; height: 30vw;" /></div>
</template><script>//引入文件
import * as echarts from 'echarts'
require('echarts/theme/macarons') // echarts theme
import 'echarts/map/js/china.js'//中國地圖區域
export default {name:'ditumap',data() {return {}},mounted() {this.init()},methods: {init() {// 基于準備好的dom,初始化echarts實例let chinaMap = echarts.init(document.getElementById("map"));// 窗口或框架被調整大小時執行chinaMap.resizechinaMap.setOption({tooltip: {trigger: 'item',formatter: '{b}'},series: [{name: '中國',type: 'map',mapType: 'china',selectedMode : 'multiple',label: {normal: {show: true},emphasis: {show: true}},data:[{name:'新疆', selected:true}]}]})},}
}
</script>

?
實現效果如上,
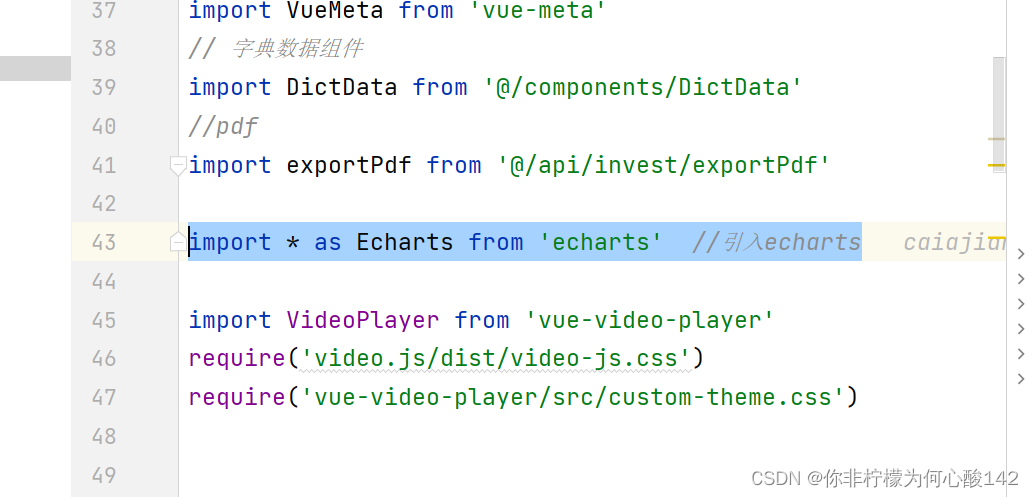
main.js需要先引入echarts
import * as Echarts from 'echarts' //引入echarts
?
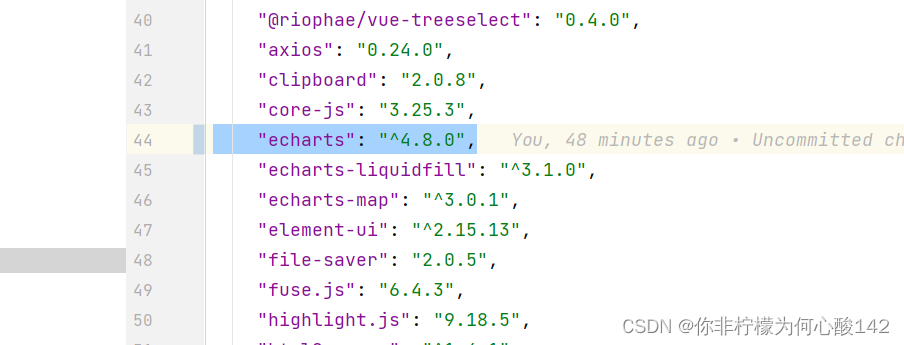
?package.json也需要引入對應的依賴(使用命令行下載會自動導入,)
?
到這里就已經實現可用了,希望可以幫助到各位小伙伴


)


——4.6.存儲過程和函數(Procedure和Function))


)


