Prometheus Part1
- 一、常用的監控系統
- 1.1 簡介
- 1.2 Prometheus和zabbix的區別
- 二、Prometheus
- 2.1 簡介
- 2.2 Prometheus的主要組件
- 1)`Prometheus server`
- 2)`Exporters`
- 3)`Alertmanager`
- 4)`Pushgateway`
- 5)`Grafana`
- 2.3 Prometheus的工作流程
- 2.4 Prometheus數據采集配置
- 三、二進制部署Prometheus
- 3.1 初始化操作
- 3.2 下載Prometheus源碼包并解壓
- 3.3 Prometheus添加到系統服務中
- 3.4 訪問測試
- 四、Exporters部署實例
- 4.1 實例一:部署 Node Exporter 監控系統級指標
- Step1 準備源代碼包
- Step2 將node-expoter添加到系統服務中
- Step3 加入到 Prometheus 監控中
- 補充:常用的各指標
- 4.2 實例二:通過mysql exporter監控 MySQL
- Step1 部署mysql exporter
- Step2 修改Mysql的配置
- Step3 啟動mysqld_exporter服務
- Step4 添加Mysql到Prometheus監控中
- Step5 查看Prometheus web界面
- 4.3 實例三:監控Nginx
- Step1 安裝nginx
- Step2 修改nginx的配置文件,啟動nginx
- Step3 解壓 nginx-exporter并啟動
- Step4 將nginx加入到Prometheus監控中
- Step5 訪問Prometheus web頁面
- 五、部署 Grafana平臺進行展示
- 5.1 下載和安裝
- 5.2 配置數據源
- 5.3 導入grafana監控面板
一、常用的監控系統
1.1 簡介

老牌傳統的:Zabbix 、Nagios、Cacti …
云時代的:Prometheus、夜鶯 … …
1.2 Prometheus和zabbix的區別
Zabbix:更適用于傳統業務架構的物理機、虛擬機環境的監控,對容器的支持比較差;數據存儲主要采用的是關系型數據庫,會隨著監控節點數量的增加,關系型數據庫的壓力也會變大,監控數據的讀寫也會變的很慢;對大規模集群監控的性能比Prometheus要弱一些,可適用于單集群不超過2000節點的場景。
Prometheus:還能支持云環境、Kubernetes容器集群的監控,是目前容器監控最好的解決方案;數據存儲采用的是時序數據庫,大大的節省了存儲空間,并且提升了查詢效率;單集群支持的節點規模更大,通常超過2000臺節點、業務服務數量大于1000個的時候建議直接上Prometheus。
二、Prometheus
Prometheus 官網地址:https://prometheus.io
Prometheus github 地址:https://github.com/prometheus
2.1 簡介
Prometheus 是一個開源的監控系統 + 時間序列數據庫,數據模型是 指標度量名稱{鍵值對標簽} 的時間序列數據格式。
2.2 Prometheus的主要組件
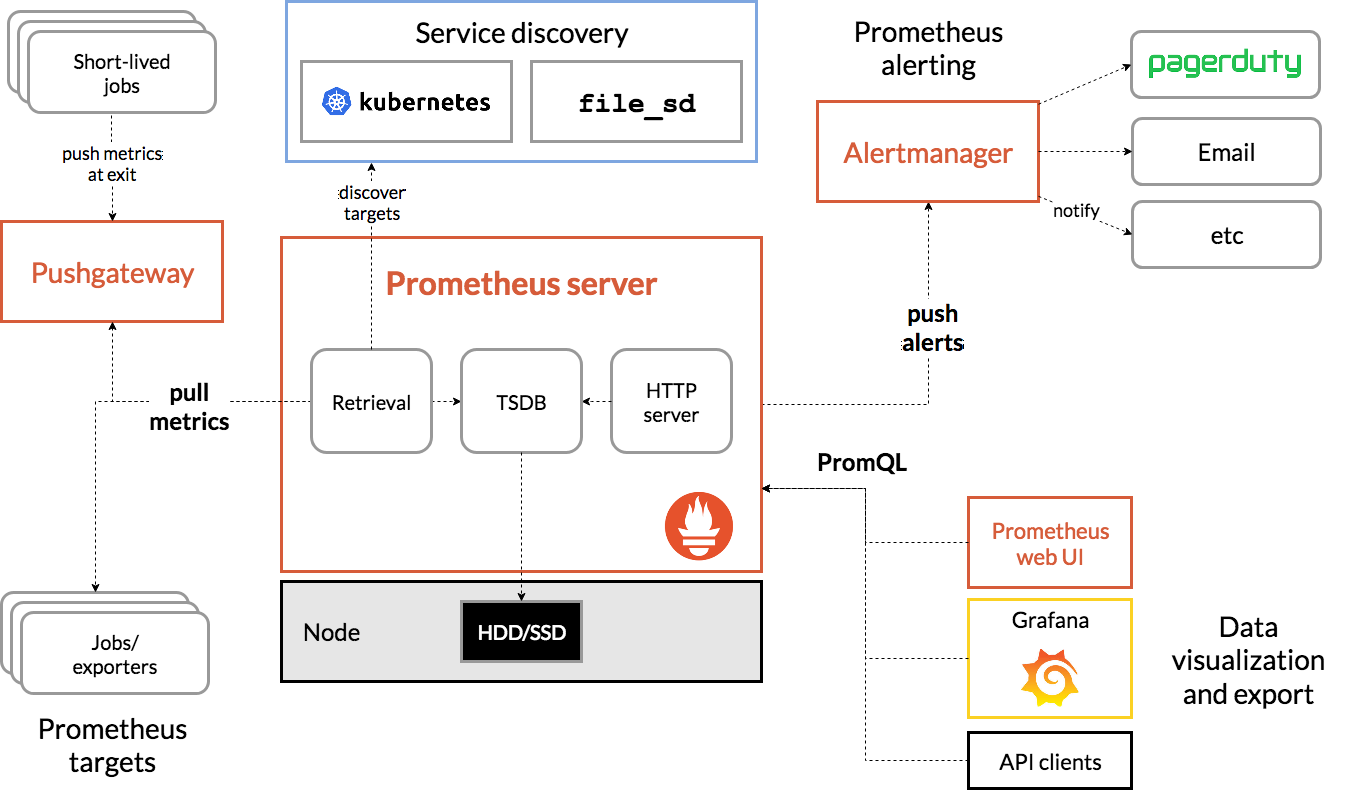
1)Prometheus server
Prometheus服務的核心組件;
通過http pull拉取的方式采集監控指標數據(時間序列數據);
作為時序數據庫持久化存儲監控指標數據;
根據告警規則生成告警通知推送給alertmanager;
內建service discovery動態服務發現功能(支持文件、consul、K8S等自動發現方式)
2)Exporters
指標暴露器,用于對原生不支持prometheus直接采集監控指標數據的系統或應用,收集監控指標數據并轉換格式給prometheus server拉取采集。
| 常用的exporters | 描述 |
|---|---|
Node-Exporter | 用于收集服務器節點的物理指標狀態數據,如平均負載、CPU、內存、磁盤、網絡等資源信息的指標數據,需要部署到所有運算節點。 |
mysqld-exporter/nginx-exporter | 用于監控特定服務,比如mysql/nginx |
Kube-State-Metrics | 用于為 Prometheus 采集 K8S 資源數據 |
| cAdvisor | 用來監控容器內部使用資源的信息,比如 CPU、內存、網絡I/O、磁盤I/O |
| blackbox-exporter | 監控業務容器存活性 |
3)Alertmanager
接收prometheus server發來的告警通知,負責對告警通知去重、分組,并路由給接收人(電子郵件、釘釘、企業微信等方式)
4)Pushgateway
作為中轉站,接收一些短期任務或只會push推送數據的任務發來的監控指標數據,用于臨時存儲監控指標數據并統一給prometheus server拉取采集
5)Grafana
外置的監控數據展示平臺,接入prometheus數據源,通過promQL查詢,并以圖形化形式展示
2.3 Prometheus的工作流程
1)prometheus server通過http pull拉取的方式從監控目標target(exporter或pushgateway暴露的http接口)拉取監控指標數據;
2)prometheus server將采集到的監控指標數據通過時序數據庫持久化存儲在本地磁盤或外置存儲中;
3)prometheus server將采集到的監控指標數據與本地配置的告警規則進行計算比對,如果觸發告警則會生成告警通知推送給alertmanager;
4)alertmanager接收到prometheus server發來的告警通知后,對告警通知去重、分組,再通過電子郵件/釘釘/企業微信等方式發送給接收人;
5)prometheus支持原生的web UI或grafana接入prometheus數據源,通過promQL查詢,并以圖形化形式展示。
prometheus支持使用influxdb等作為外置時序數據庫,實現長期存儲歷史數據。
prometheus可基于thanos實現prometheus集群的高可用(主要方式是在K8S上部署,通過邊車模式與prometheus部署在同一個Pod里共享監控數據)
2.4 Prometheus數據采集配置
#這是一個模板
scrape_configs:
- job_name: XXX              #自定義監控任務的名稱metrics_path: "/metrics"   #指定獲取監控指標數據的URL路徑,一般都是 /metricsscheme: "http"             #指定拉取監控指標數據的協議,http(默認值)|httpsstatic_configs:            #定義靜態配置的監控目標- targets:                   #指定監控目標的IP和exporter的端口- <IP1>:<exporter的端口>- <IP2>:<exporter的端口>labels:                    #自定義監控目標的標簽<標簽key>: <標簽value>
三、二進制部署Prometheus
3.1 初始化操作
systemctl stop firewalld
setenforce 0
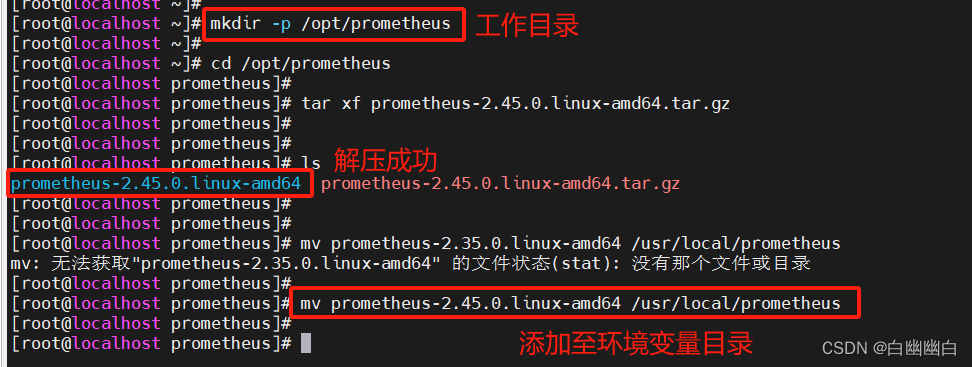
3.2 下載Prometheus源碼包并解壓
上傳 prometheus-2.45.0.linux-amd64.tar.gz 到 /opt 目錄中,并解壓
#建立工作目錄
mkdir -p /opt/prometheus#上傳源碼包
cd /opt/prometheus
tar xf prometheus-2.45.0.linux-amd64.tar.gz#方便補全
mv prometheus-2.45.0.linux-amd64 /usr/local/prometheus
Prometheus配置清單文件詳解
cat /usr/local/prometheus/prometheus.yml | grep -v "^#"global: #用于prometheus的全局配置,比如采集間隔,抓取超時時間等scrape_interval: 15s #采集目標主機監控數據的時間間隔,默認為1mevaluation_interval: 15s #觸發告警生成alert的時間間隔,默認是1m# scrape_timeout is set to the global default (10s).scrape_timeout: 10s #數據采集超時時間,默認10salerting: #用于alertmanager實例的配置,支持靜態配置和動態服務發現的機制alertmanagers:- static_configs:- targets:# - alertmanager:9093rule_files: #用于加載告警規則相關的文件路徑的配置,可以使用文件名通配機制# - "first_rules.yml"# - "second_rules.yml"scrape_configs: #用于采集時序數據源的配置# The job name is added as a label `job=<job_name>` to any timeseries scraped from this config.- job_name: "prometheus" #每個被監控實例的集合用job_name命名,支持靜態配置(static_configs)和動態服務發現的機制(*_sd_configs)# metrics_path defaults to '/metrics'metrics_path: '/metrics' #指標數據采集路徑,默認為 /metrics# scheme defaults to 'http'.static_configs: #靜態目標配置,固定從某個target拉取數據- targets: ["localhost:9090"]3.3 Prometheus添加到系統服務中
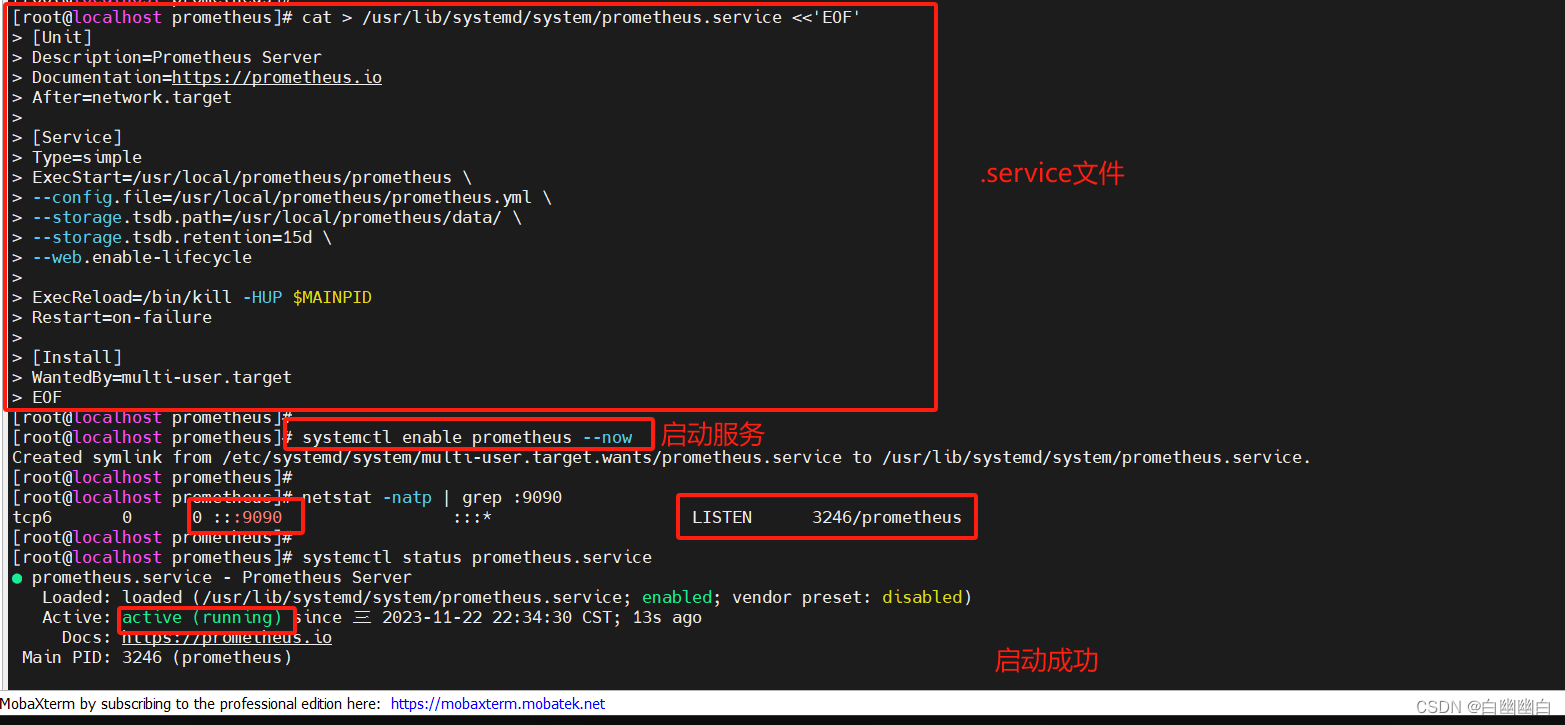
#配置系統啟動文件
cat > /usr/lib/systemd/system/prometheus.service <<'EOF'
[Unit]
Description=Prometheus Server
Documentation=https://prometheus.io
After=network.target[Service]
Type=simple
ExecStart=/usr/local/prometheus/prometheus \
--config.file=/usr/local/prometheus/prometheus.yml \
--storage.tsdb.path=/usr/local/prometheus/data/ \
--storage.tsdb.retention=15d \
--web.enable-lifecycleExecReload=/bin/kill -HUP $MAINPID
Restart=on-failure[Install]
WantedBy=multi-user.target
EOF
啟動
#啟動 Prometheust
systemctl enable prometheus --nownetstat -natp | grep :9090
3.4 訪問測試
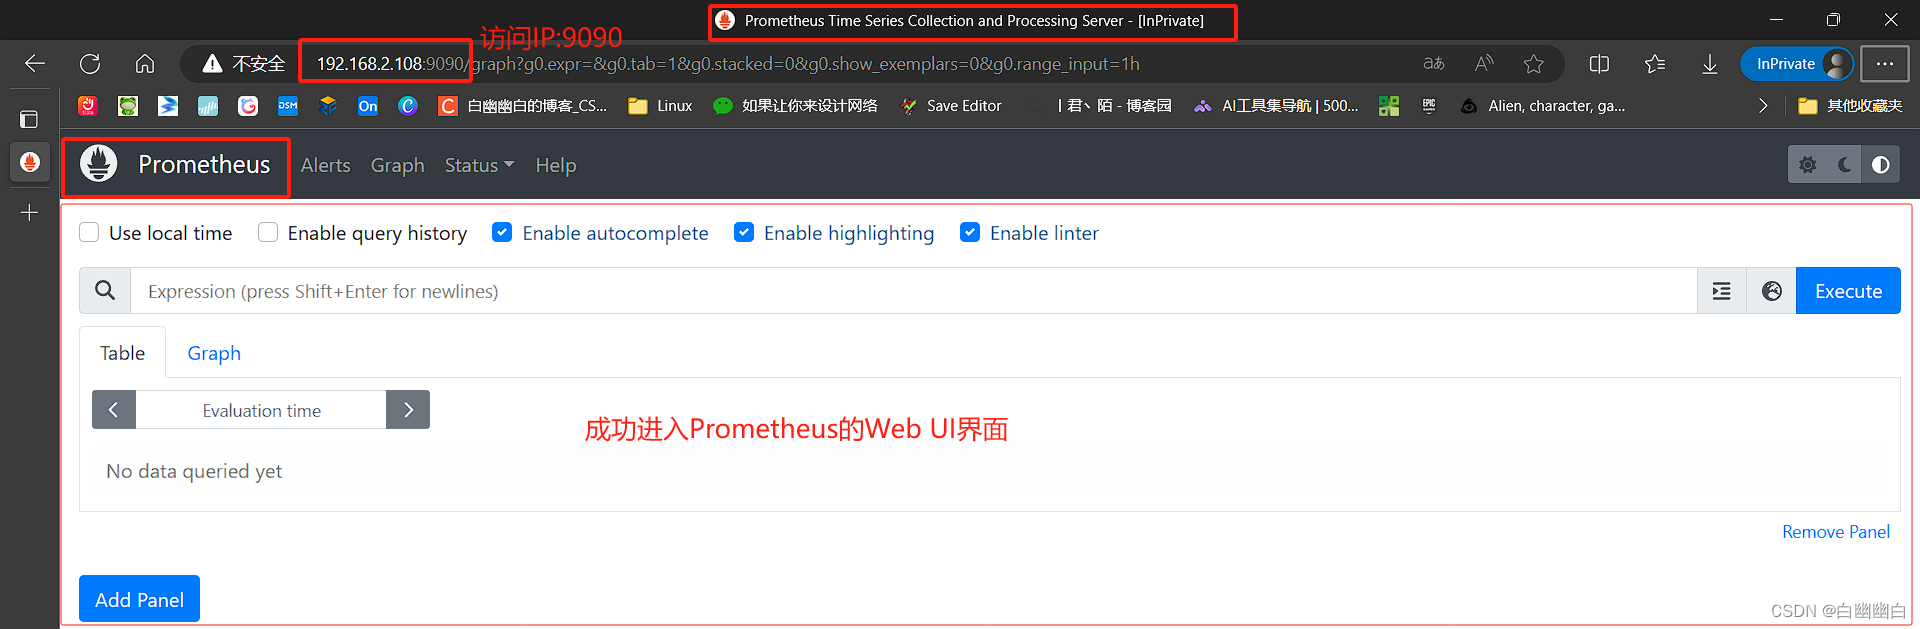
瀏覽器訪問:http://192.168.2.108:9090 ,訪問到 Prometheus 的 Web UI 界面。
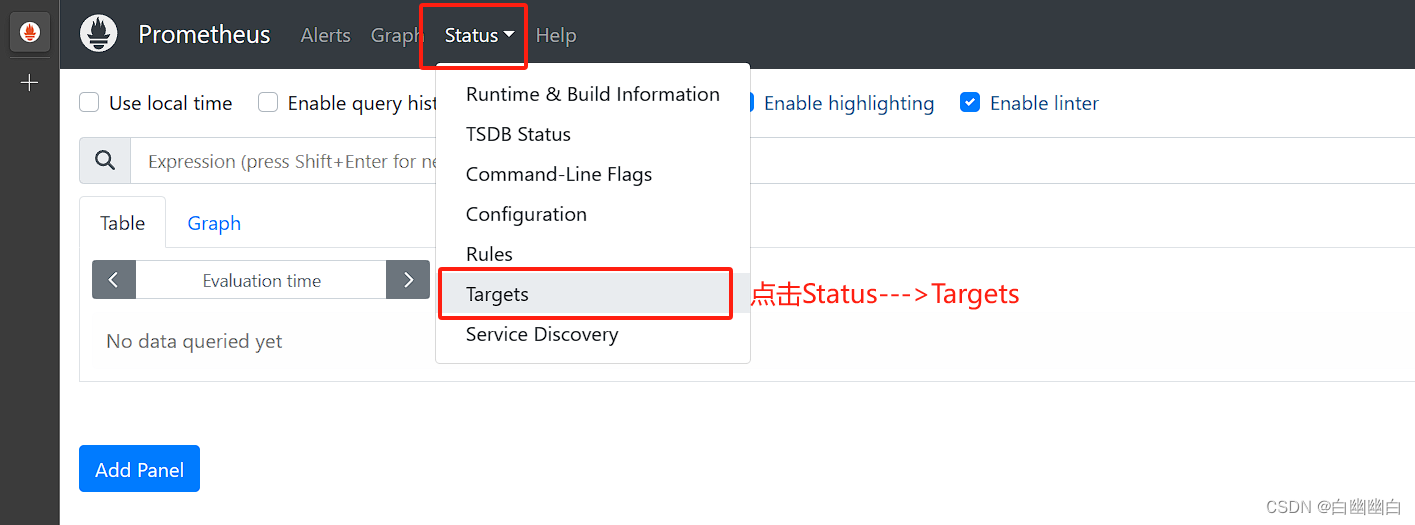
點擊頁面的 Status -> Targets;
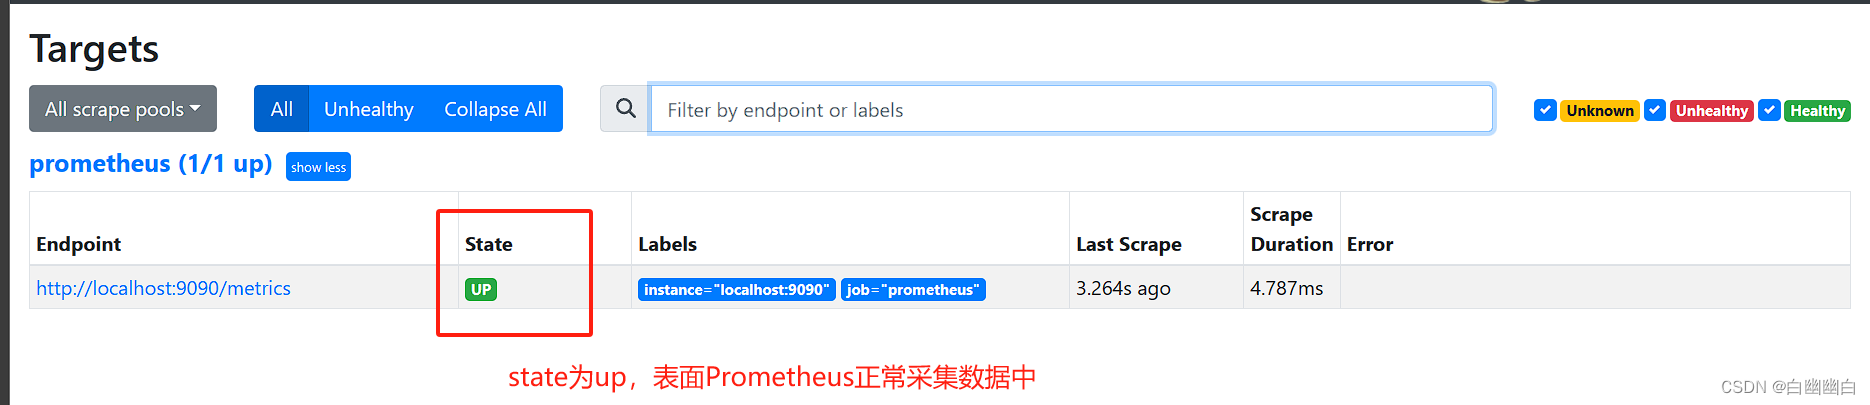
如看到 Target 狀態都為 UP,說明 Prometheus 能正常采集到數據。
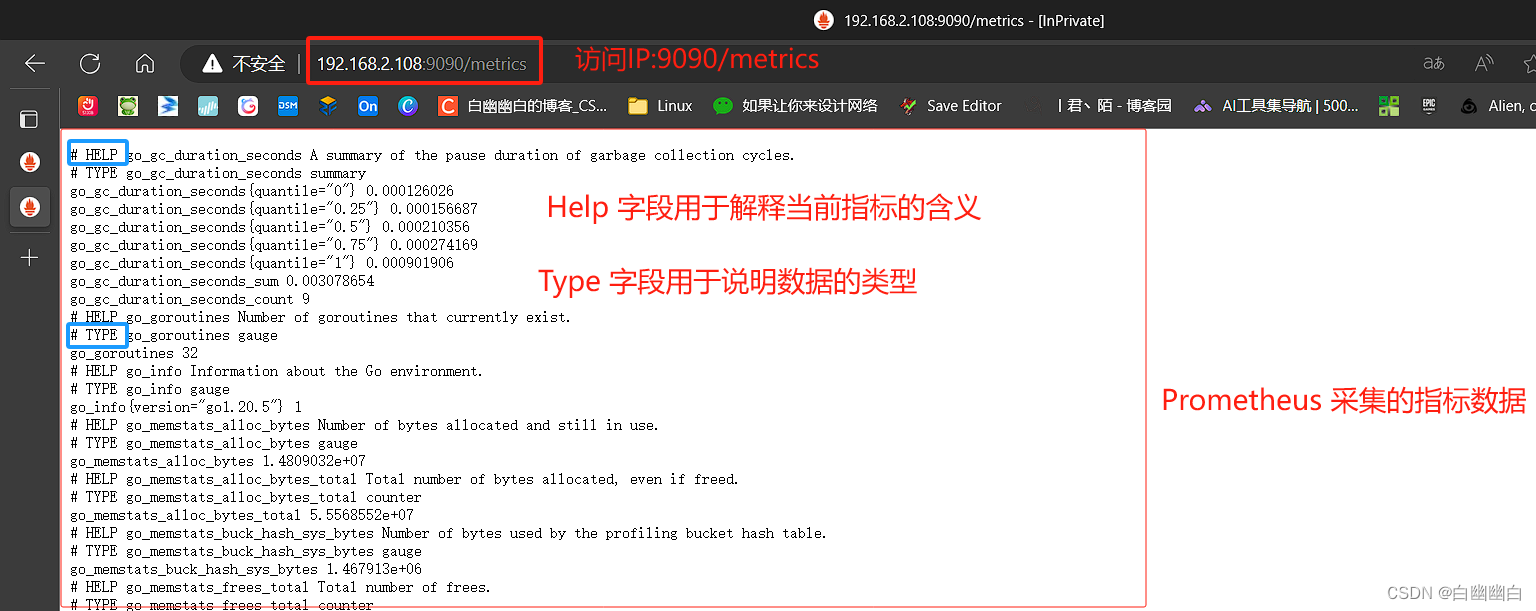
瀏覽器訪問:http://192.168.2.108:9090/metrics ,可以看到 Prometheus 采集的指標數據。
其中 Help 字段用于解釋當前指標的含義,Type 字段用于說明數據的類型。
四、Exporters部署實例
4.1 實例一:部署 Node Exporter 監控系統級指標
Step1 準備源代碼包
上傳 node_exporter-1.3.1.linux-amd64.tar.gz 到 /opt 目錄中,并解壓。
tar xf node_exporter-1.3.1.linux-amd64.tar.gzmv node_exporter-1.3.1.linux-amd64/node_exporter /usr/local/bin
Step2 將node-expoter添加到系統服務中
配置啟動文件
cat > /usr/lib/systemd/system/node_exporter.service <<'EOF'
[Unit]
Description=node_exporter
Documentation=https://prometheus.io/
After=network.target[Service]
Type=simple
ExecStart=/usr/local/bin/node_exporter \
--collector.ntp \
--collector.mountstats \
--collector.systemd \
--collector.tcpstatExecReload=/bin/kill -HUP $MAINPID
Restart=on-failure[Install]
WantedBy=multi-user.target
EOF
啟動
systemctl enable node_exporter --nownetstat -natp | grep :9100
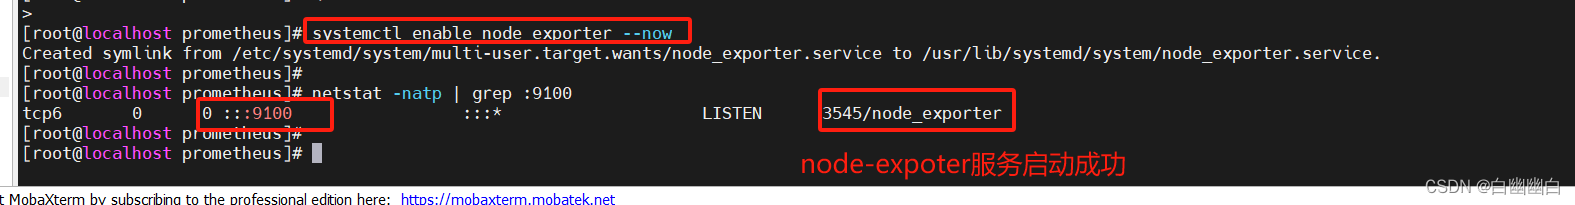
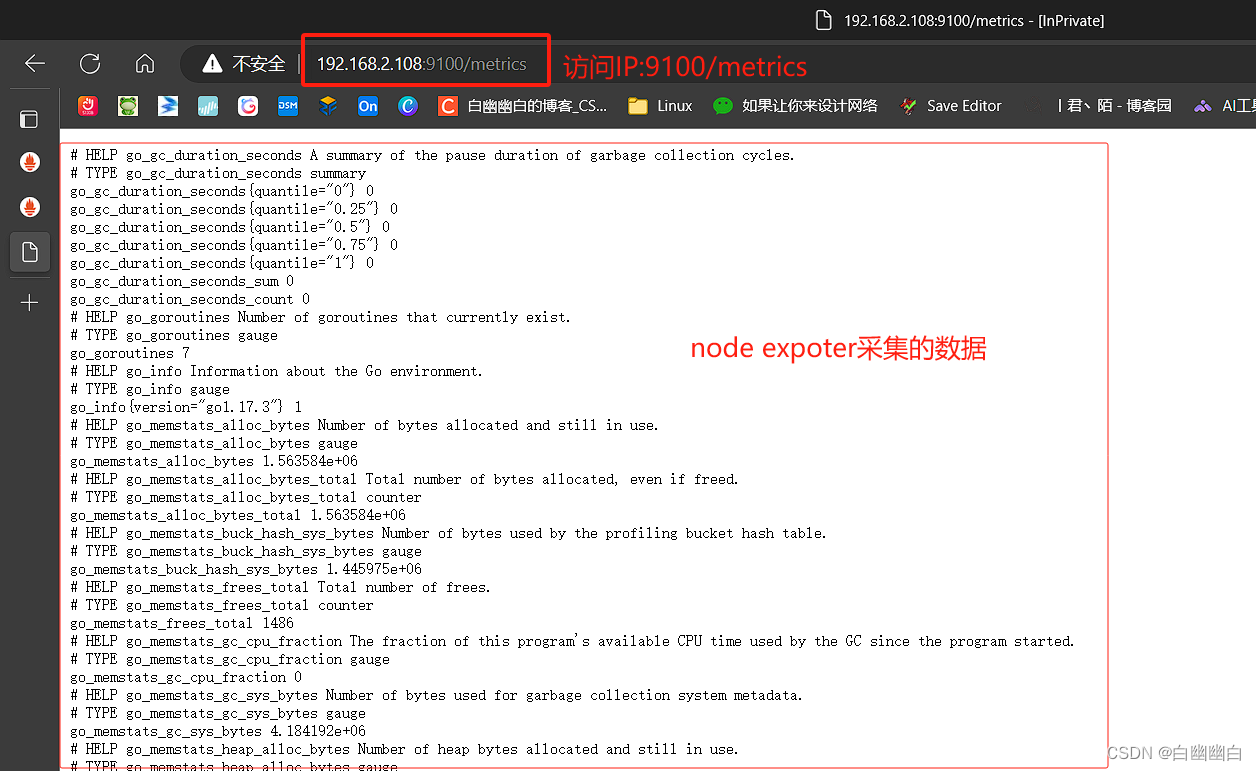
瀏覽器訪問:http://192.168.2.108:9100/metrics ,可以看到 Node Exporter 采集到的指標數據。
Step3 加入到 Prometheus 監控中
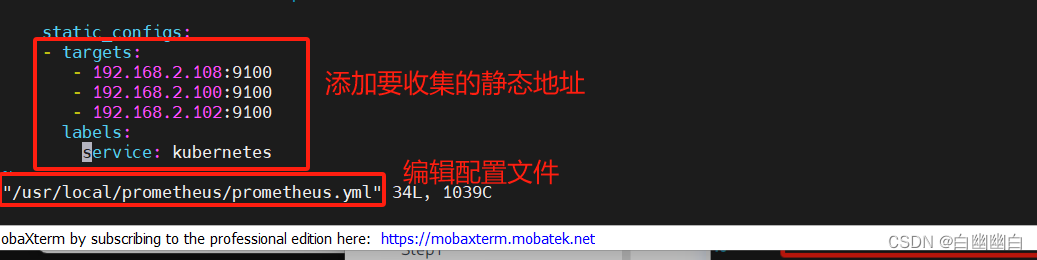
修改Prometheus配置文件
vim /usr/local/prometheus/prometheus.yml
#在尾部增加如下內容- job_name: nodesmetrics_path: "/metrics"static_configs:- targets:- 192.168.2.108:9100- 192.168.2.100:9100- 192.168.2.102:9100labels:service: kubernetes
重新載入配置
#方法一
systemctl reload prometheus#方法二
curl -X POST http://192.168.2.108:9090/-/reload
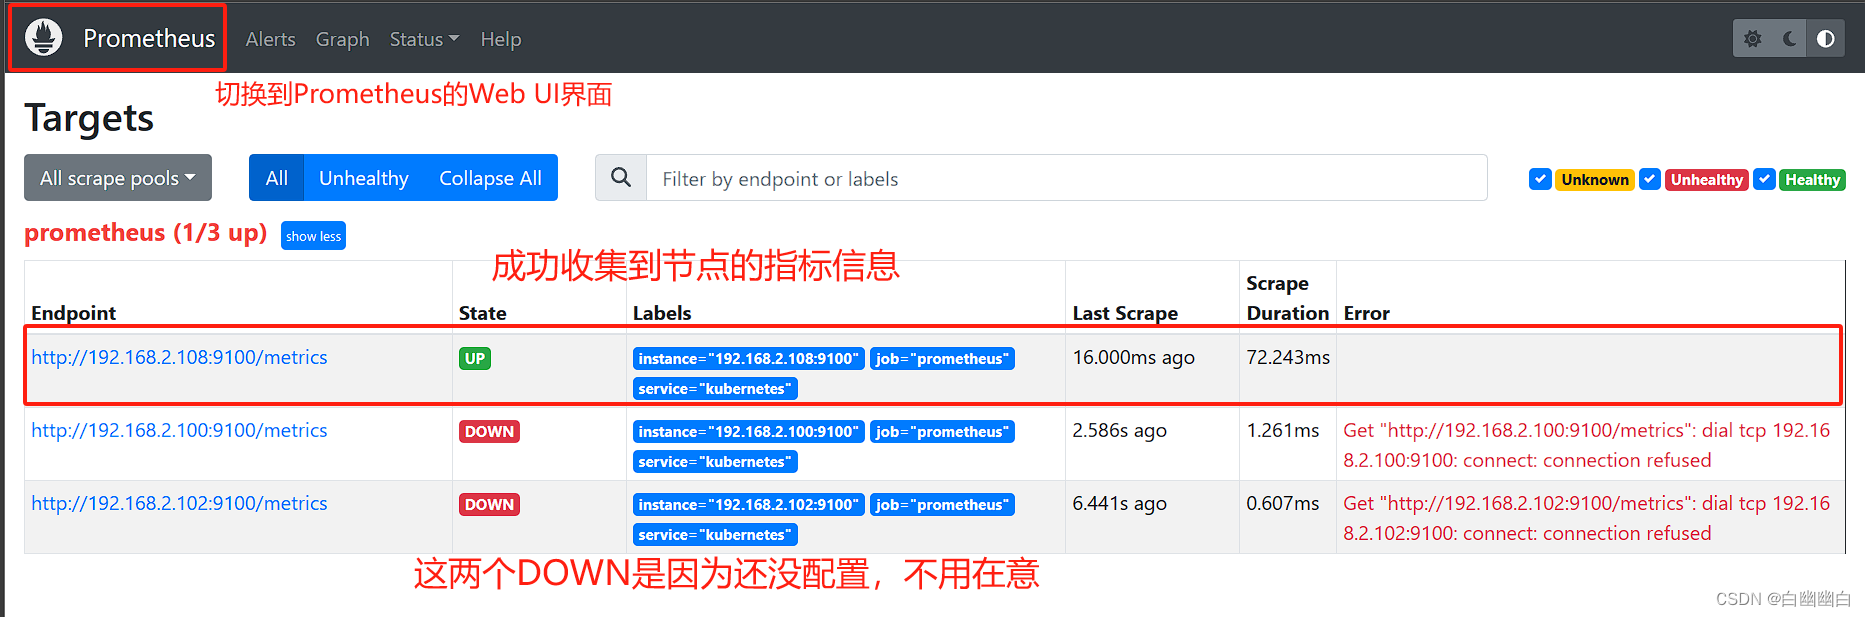
測試
瀏覽器查看 Prometheus 頁面的 Status -> Targets
補充:常用的各指標
●node_cpu_seconds_total
●node_memory_MemTotal_bytes
●node_filesystem_size_bytes{mount_point=PATH}
●node_system_unit_state{name=}
●node_vmstat_pswpin:系統每秒從磁盤讀到內存的字節數
●node_vmstat_pswpout:系統每秒鐘從內存寫到磁盤的字節數
更多指標介紹:https://github.com/prometheus/node_exporter
4.2 實例二:通過mysql exporter監控 MySQL
注:切換到Mysql服務器部署。
Step1 部署mysql exporter
解壓mysql exporter源碼包
tar xf mysqld_exporter-0.14.0.linux-amd64.tar.gzmv mysqld_exporter-0.14.0.linux-amd64/mysqld_exporter /usr/local/bin/
配置啟動文件
cat > /usr/lib/systemd/system/mysqld_exporter.service <<'EOF'
[Unit]
Description=mysqld_exporter
Documentation=https://prometheus.io/
After=network.target[Service]
Type=simple
ExecStart=/usr/local/bin/mysqld_exporter --config.my-cnf=/etc/my.cnfExecReload=/bin/kill -HUP $MAINPID
Restart=on-failure[Install]
WantedBy=multi-user.target
EOF
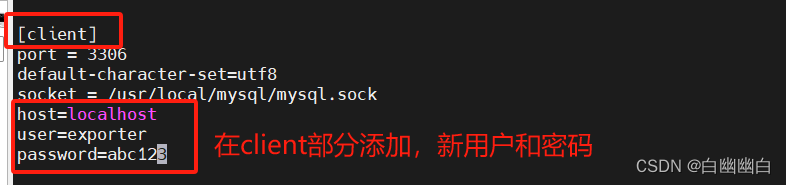
Step2 修改Mysql的配置
修改Mysql的配置文件
vim /etc/my.cnf
[client]
......
host=localhost
user=exporter
password=abc123
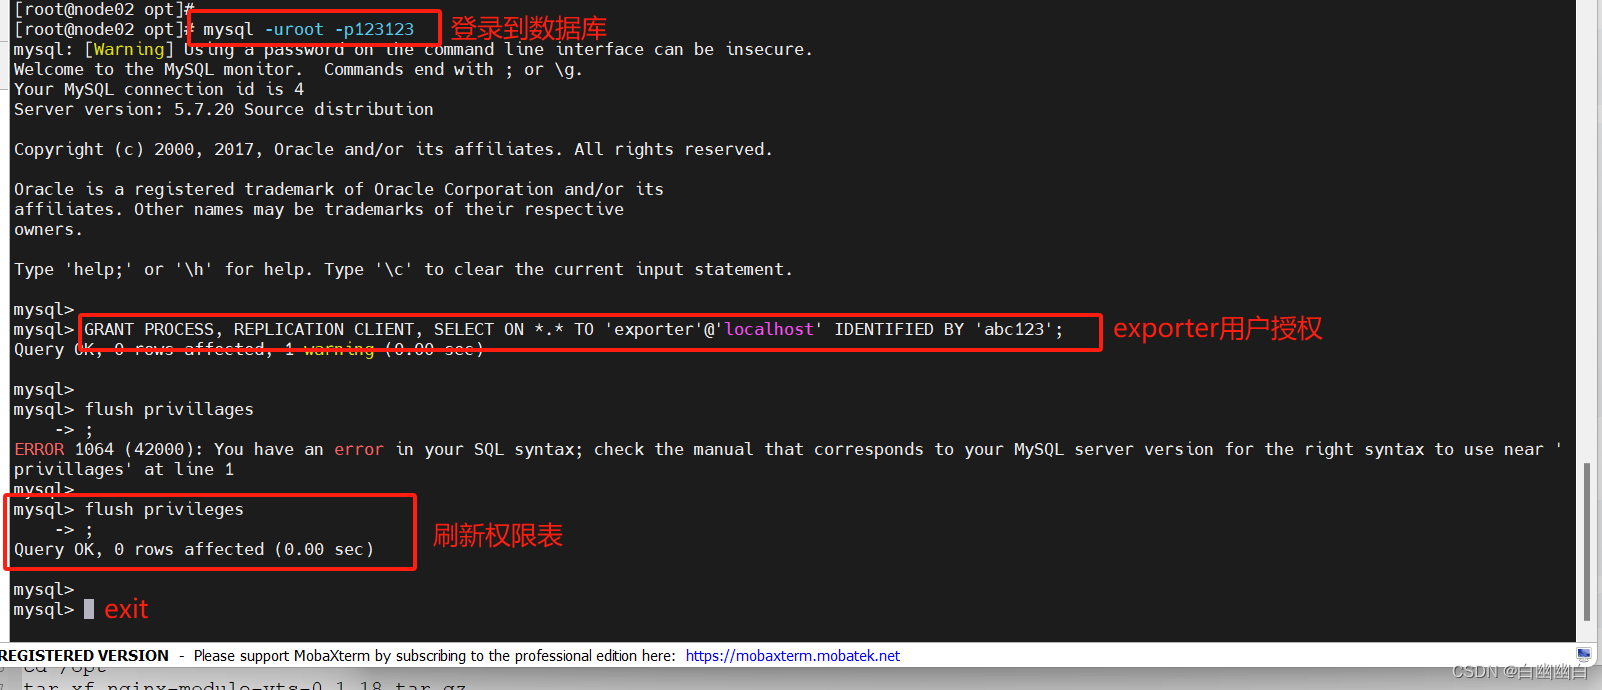
授權 exporter 用戶
#登錄收據庫
mysql -uroot -p123123#授權
GRANT PROCESS, REPLICATION CLIENT, SELECT ON *.* TO 'exporter'@'localhost' IDENTIFIED BY 'abc123';#刷新
flush privillages
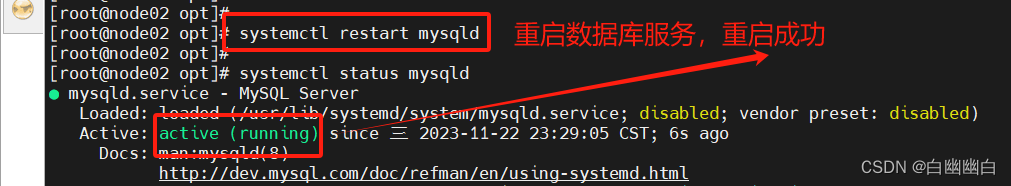
重啟mysqld服務
systemctl restart mysqld
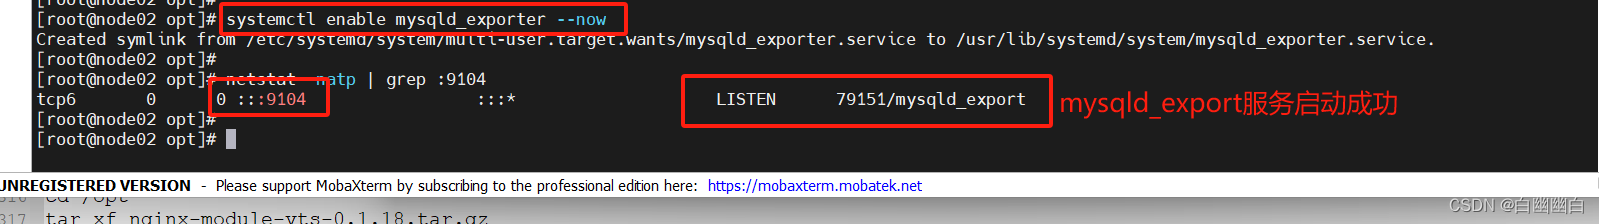
Step3 啟動mysqld_exporter服務
systemctl enable mysqld_exporter --nownetstat -natp | grep :9104
Step4 添加Mysql到Prometheus監控中
切換到Prometheus 服務器上操作。
修改 prometheus 配置文件,加入到 prometheus 監控中
vim /usr/local/prometheus/prometheus.yml
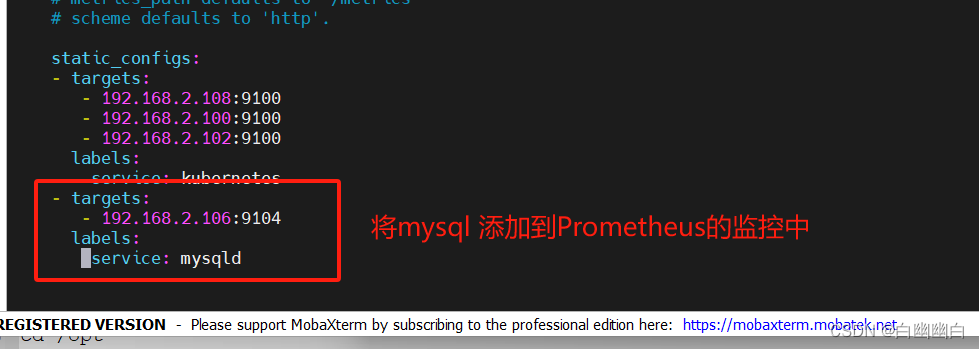
#在尾部增加如下內容- job_name: mysqldmetrics_path: "/metrics"static_configs:- targets:- 192.168.2.106:9104labels:service: mysqld
重新載入配置
systemctl reload prometheus
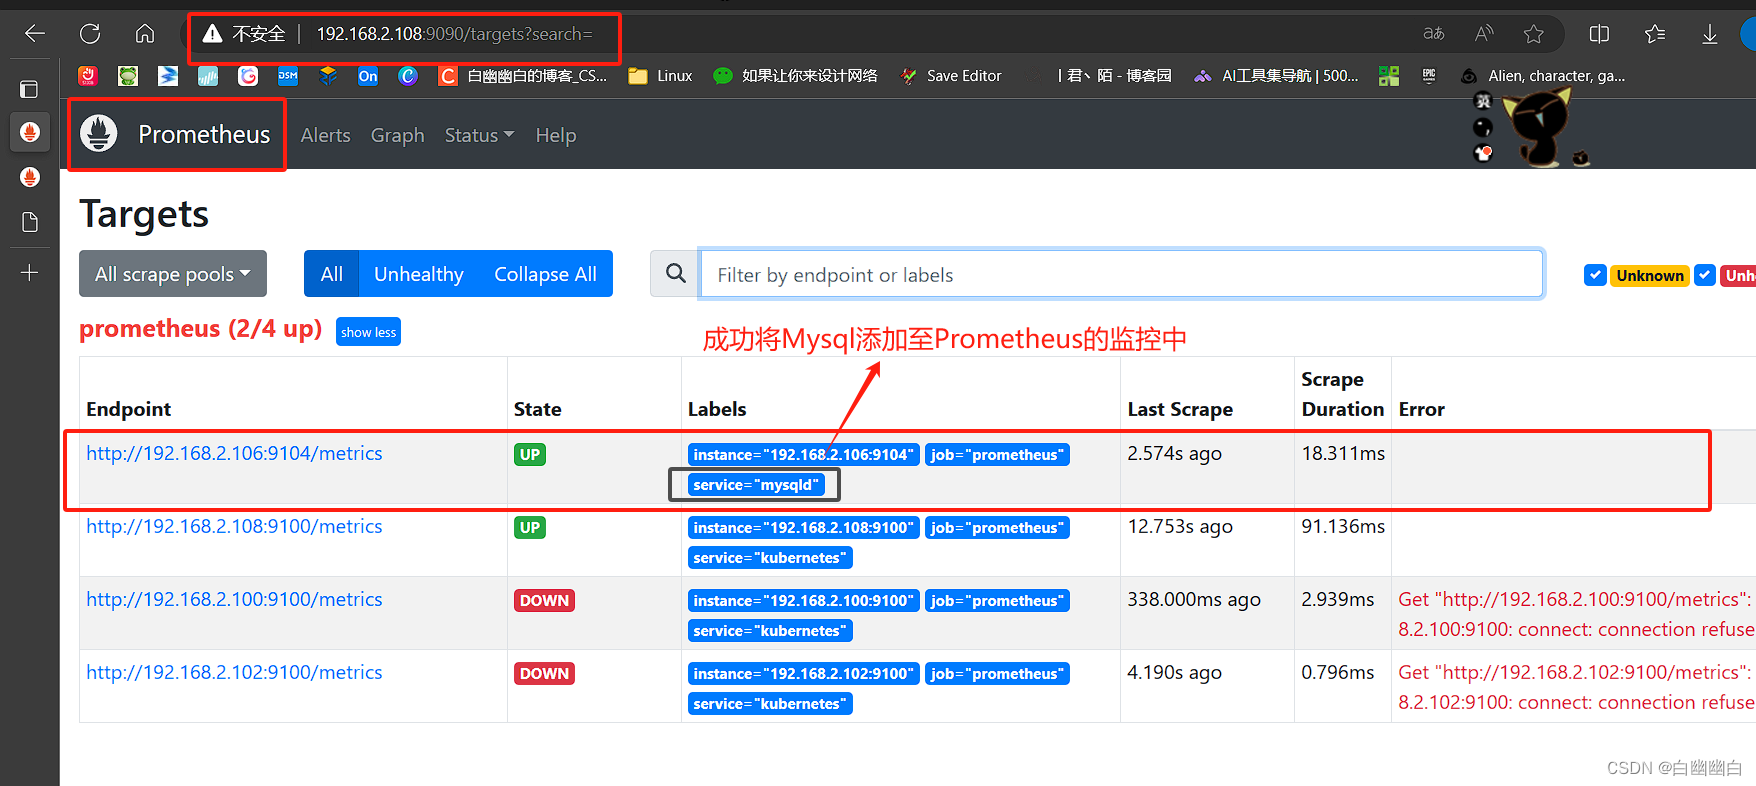
Step5 查看Prometheus web界面
瀏覽器查看 Prometheus 頁面的 Status -> Targets
4.3 實例三:監控Nginx
nginx-exporter下載地址:https://github.com/hnlq715/nginx-vts-exporter/releases/download/v0.10.3/nginx-vts-exporter-0.10.3.linux-amd64.tar.gz
nginx 下載地址:http://nginx.org/download/
nginx 插件下載地址:https://github.com/vozlt/nginx-module-vts/tags
Step1 安裝nginx
下載并解壓nginx插件包
cd /opttar xf nginx-module-vts-0.1.18.tar.gz
mv nginx-module-vts-0.1.18 /usr/local/nginx-module-vts
安裝nignx
#安裝依賴
yum -y install pcre-devel zlib-devel openssl-devel gcc gcc-c++ make
#管理用戶
useradd -M -s /sbin/nologin nginx#解壓代碼包
cd /opt
tar xf nginx-1.24.0.tar.gz#編譯安裝
cd nginx-1.24.0/
./configure --prefix=/usr/local/nginx \
--user=nginx \
--group=nginx \
--with-http_stub_status_module \
--with-http_ssl_module \
--add-module=/usr/local/nginx-module-vtsmake & make install
Step2 修改nginx的配置文件,啟動nginx
修改nginx配置文件
vim /usr/local/nginx/conf/nginx.conf
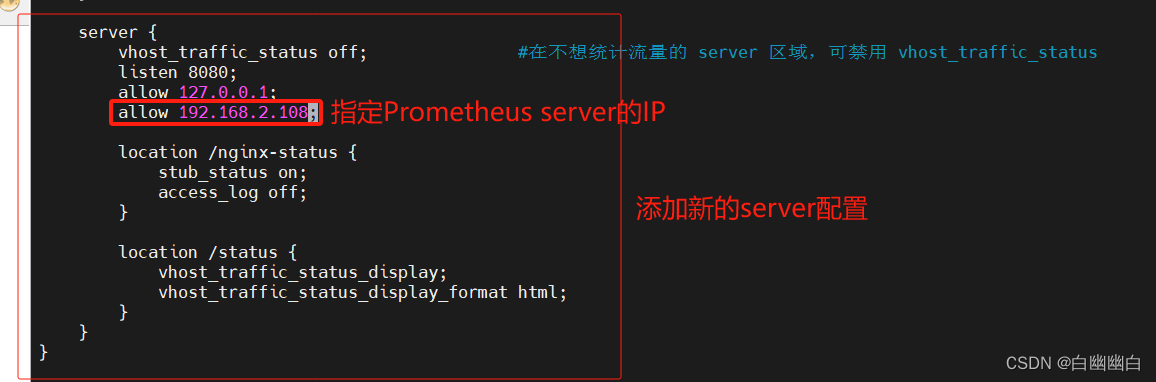
http {vhost_traffic_status_zone; #添加vhost_traffic_status_filter_by_host on; #添加,開啟此功能,在 Nginx 配置有多個 server_name 的情況下,會根據不同的 server_name 進行流量的統計,否則默認會把流量全部計算到第一個 server_name 上......server {......}server {vhost_traffic_status off; #在不想統計流量的 server 區域,可禁用 vhost_traffic_statuslisten 8080;allow 127.0.0.1;allow 192.168.2.108; #設置為 prometheus 的 ip 地址location /nginx-status {stub_status on;access_log off;}location /status {vhost_traffic_status_display;vhost_traffic_status_display_format html;}}
}#假如 nginx 沒有規范配置 server_name 或者無需進行監控的 server 上,那么建議在此 vhost 上禁用統計監控功能。否則會出現 127.0.0.1、hostname 等的域名監控信息。

ln -s /usr/local/nginx/sbin/nginx /usr/local/sbin/nginx -t

將nginx添加到系統服務中
cat > /lib/systemd/system/nginx.service <<'EOF'
[Unit]
Description=nginx
After=network.target[Service]
Type=forking
PIDFile=/usr/local/nginx/logs/nginx.pid
ExecStart=/usr/local/nginx/sbin/nginx
ExecReload=/bin/kill -s HUP $MAINPID
ExecStop=/bin/kill -s QUIT $MAINPID
PrivateTmp=true[Install]
WantedBy=multi-user.target
EOF
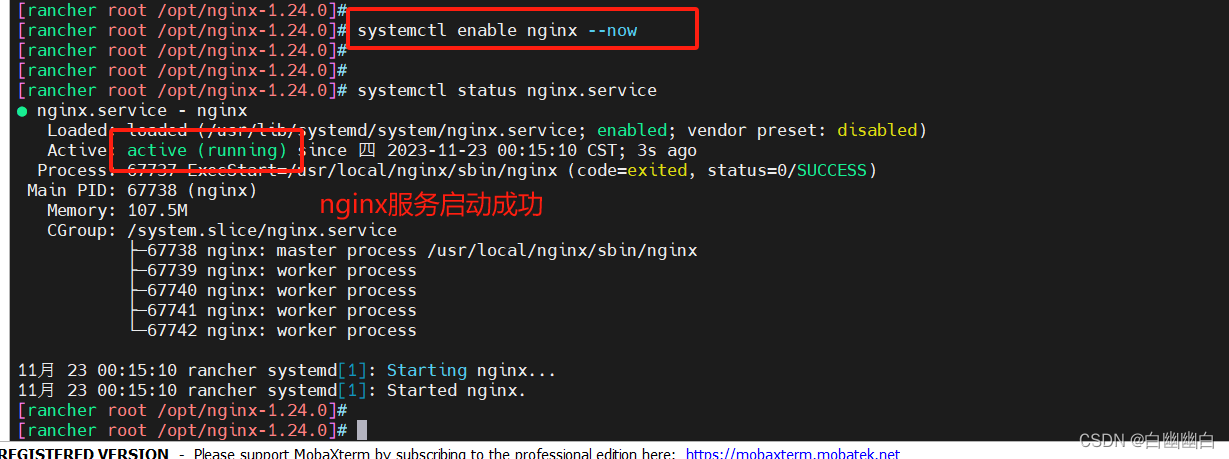
啟動
systemctl enable nginx --now
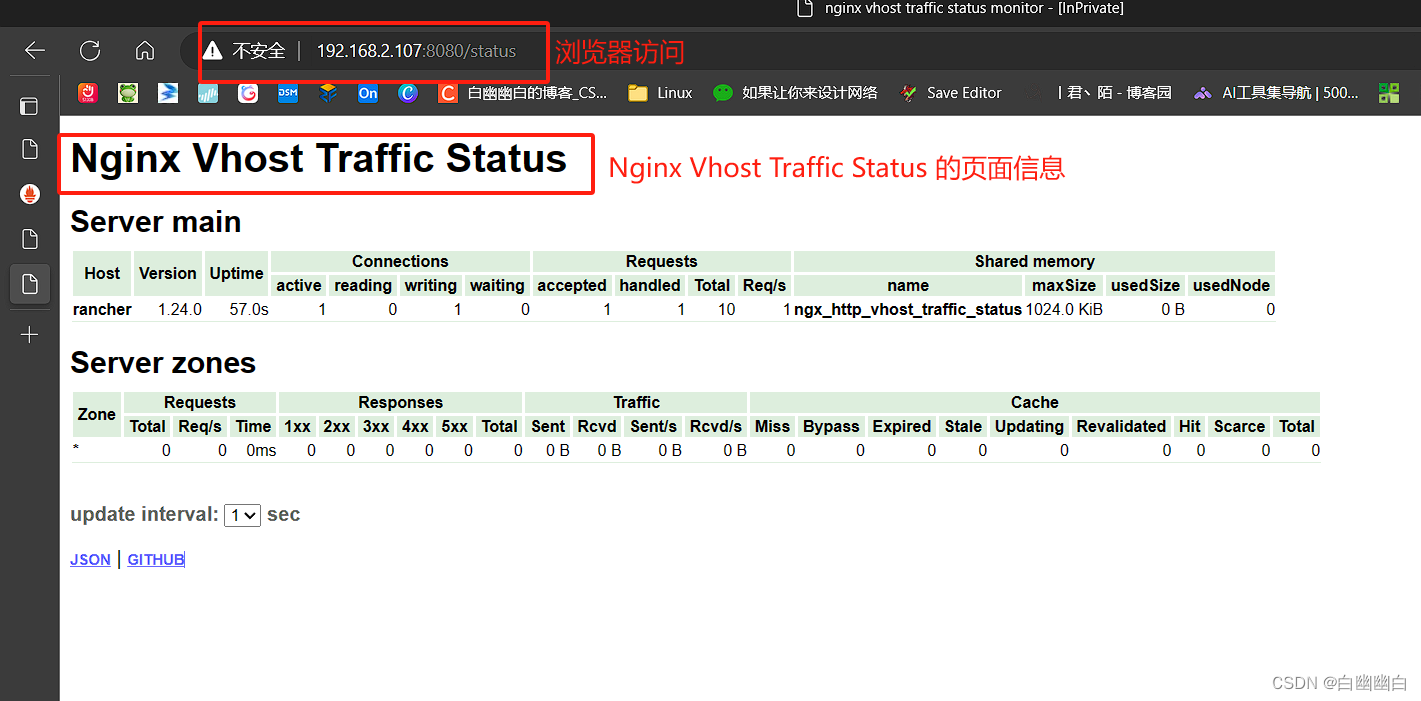
瀏覽器訪問:http://192.168.2.107:8080/status ,可以看到 Nginx Vhost Traffic Status 的頁面信息
Step3 解壓 nginx-exporter并啟動
源碼包
cd /opt/
tar -zxvf nginx-vts-exporter-0.10.3.linux-amd64.tar.gzmv nginx-vts-exporter-0.10.3.linux-amd64/nginx-vts-exporter /usr/local/bin/
添加到系統服務
cat > /usr/lib/systemd/system/nginx-exporter.service <<'EOF'
[Unit]
Description=nginx-exporter
Documentation=https://prometheus.io/
After=network.target[Service]
Type=simple
ExecStart=/usr/local/bin/nginx-vts-exporter -nginx.scrape_uri=http://localhost:8080/status/format/jsonExecReload=/bin/kill -HUP $MAINPID
Restart=on-failure[Install]
WantedBy=multi-user.target
EOF
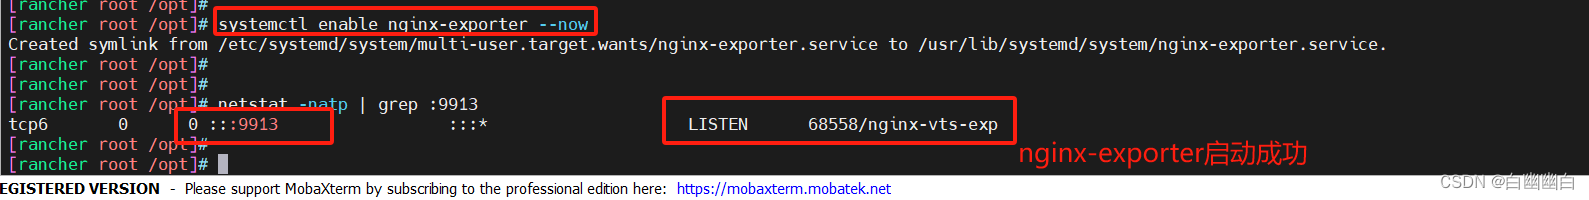
啟動nginx-exporter服務
systemctl enable nginx-exporter --nownetstat -natp | grep :9913
Step4 將nginx加入到Prometheus監控中
切換到 Prometheus 服務器。
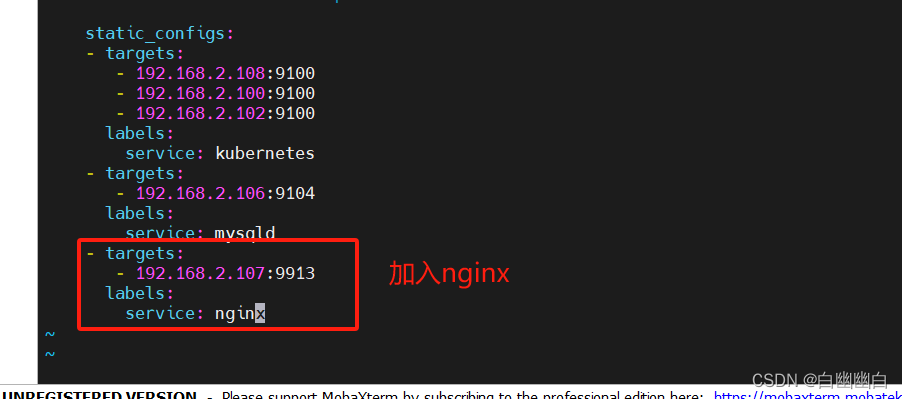
修改 prometheus 配置文件
vim /usr/local/prometheus/prometheus.yml
#在尾部增加如下內容- job_name: nginxmetrics_path: "/metrics"static_configs:- targets:- 192.168.2.107:9913labels:service: nginx
重新載入配置
systemctl reload prometheus
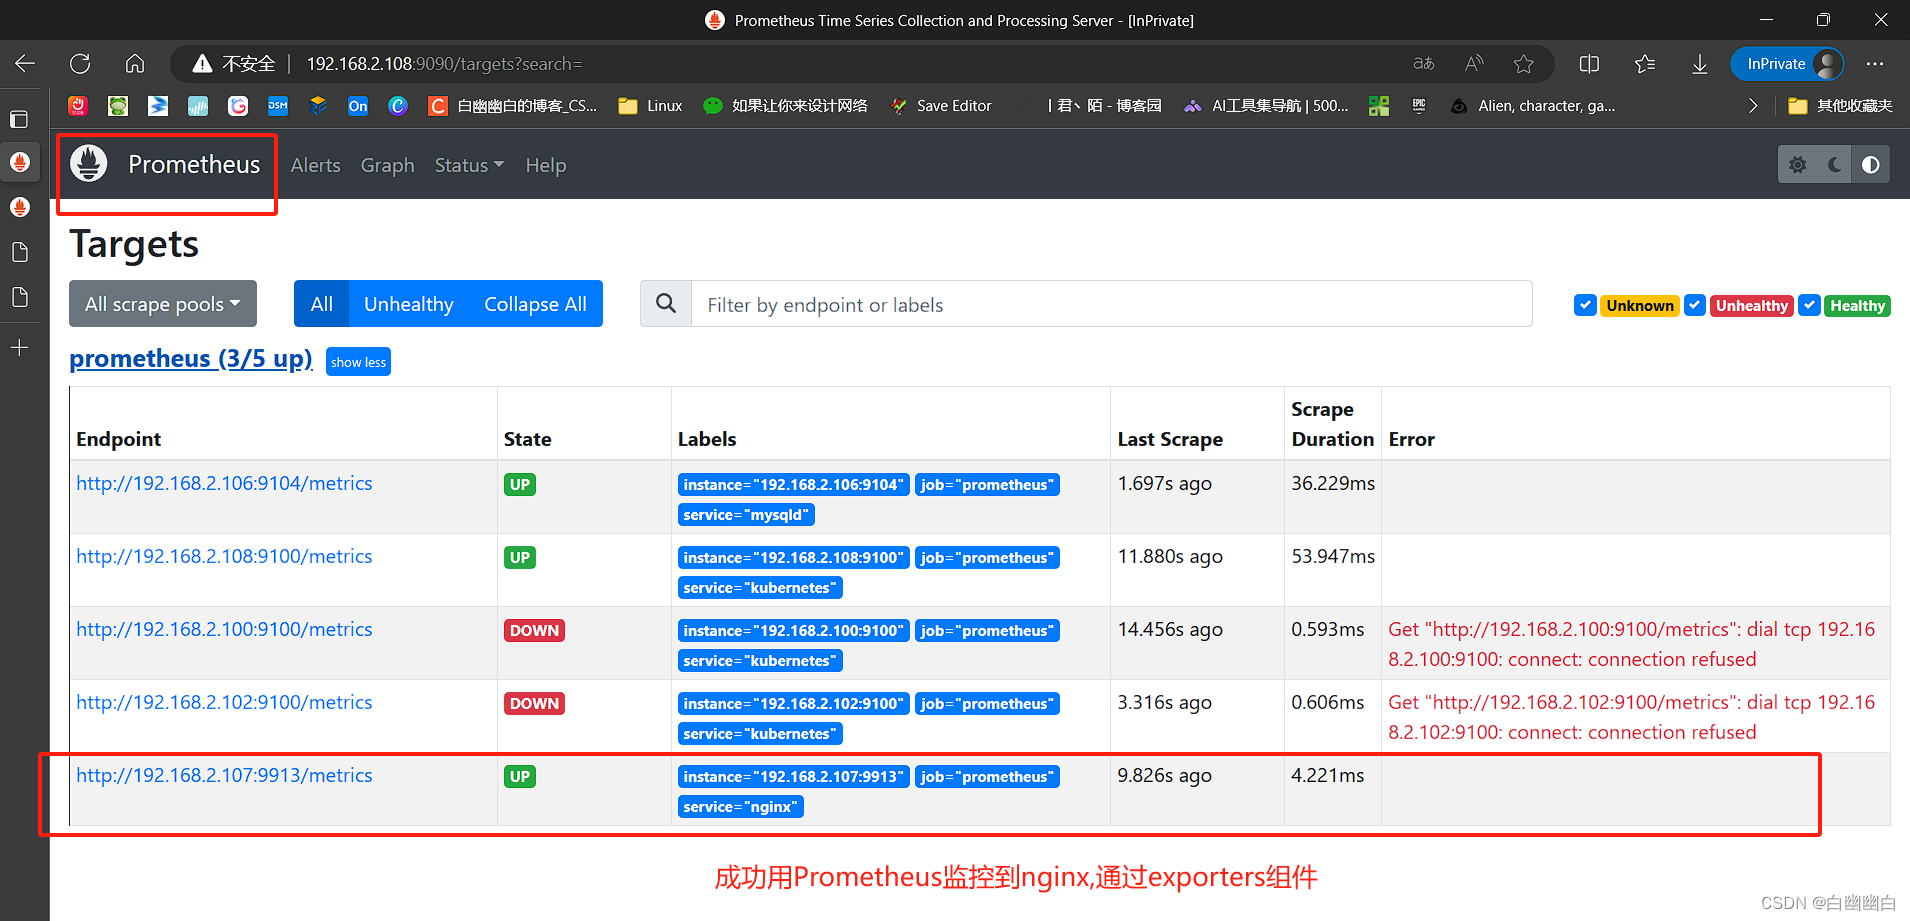
Step5 訪問Prometheus web頁面
瀏覽器查看 Prometheus 頁面的 Status -> Targets
五、部署 Grafana平臺進行展示
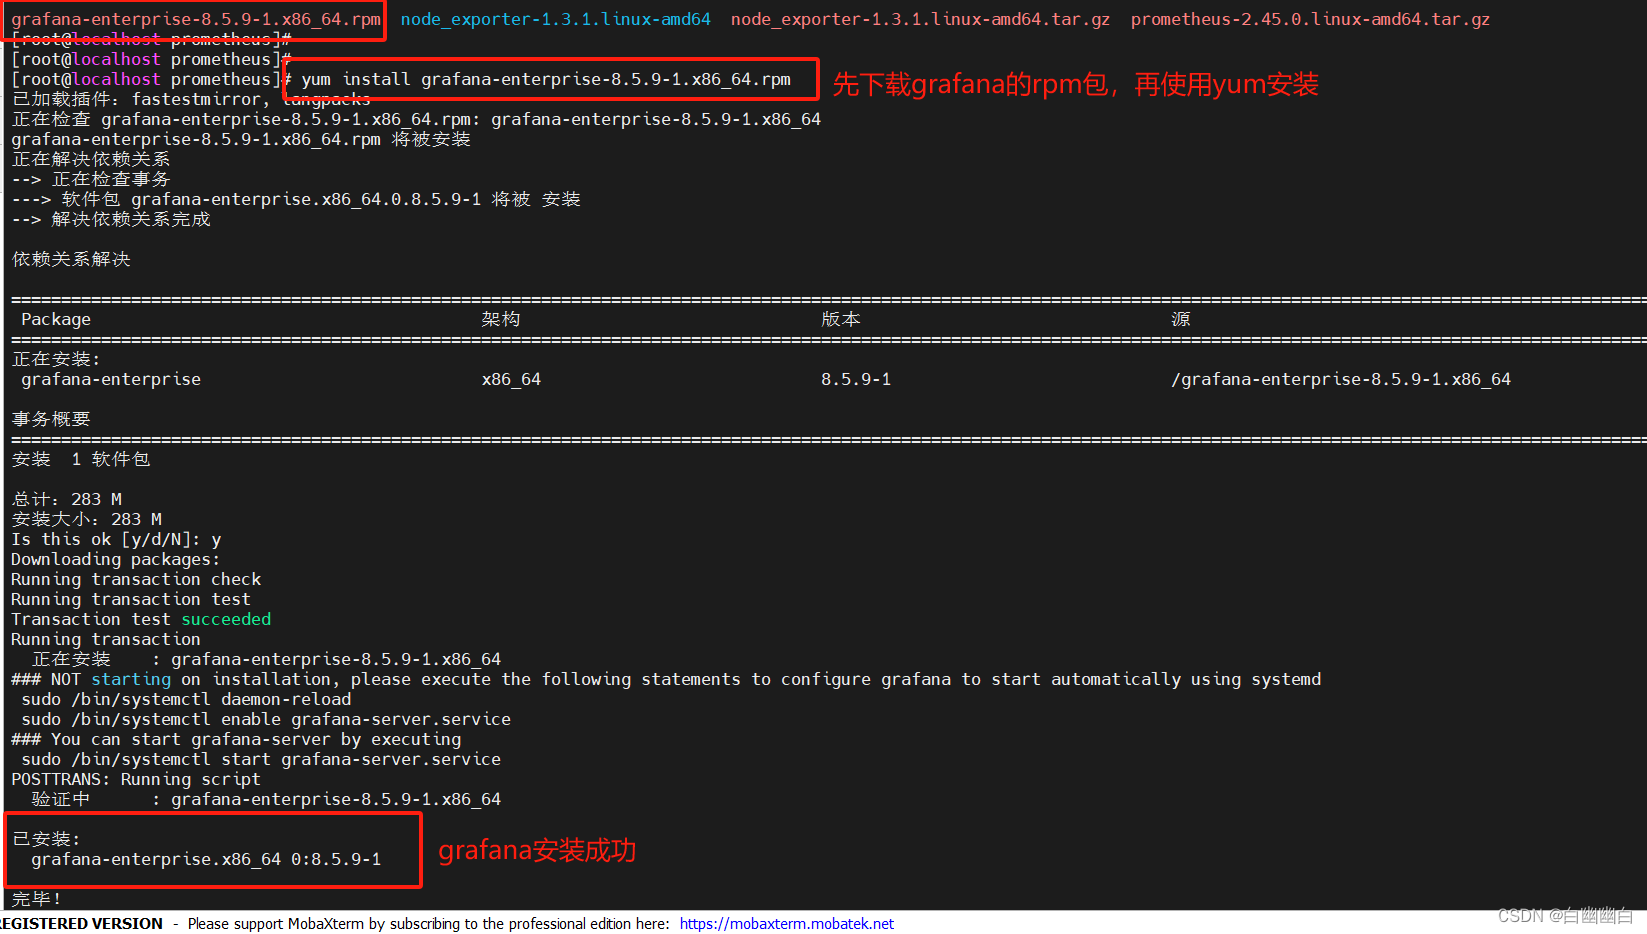
5.1 下載和安裝
#下載地址
https://grafana.com/grafana/download
https://mirrors.bfsu.edu.cn/grafana/yum/rpm/
yum install grafana-enterprise-8.5.9-1.x86_64.rpm
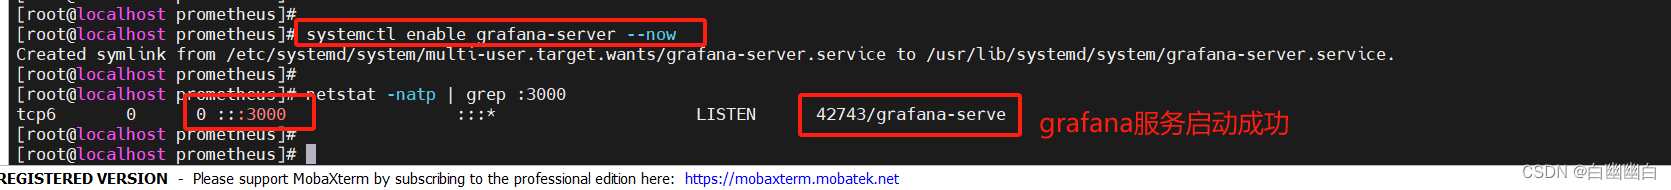
systemctl enable grafana-server --nownetstat -natp | grep :3000
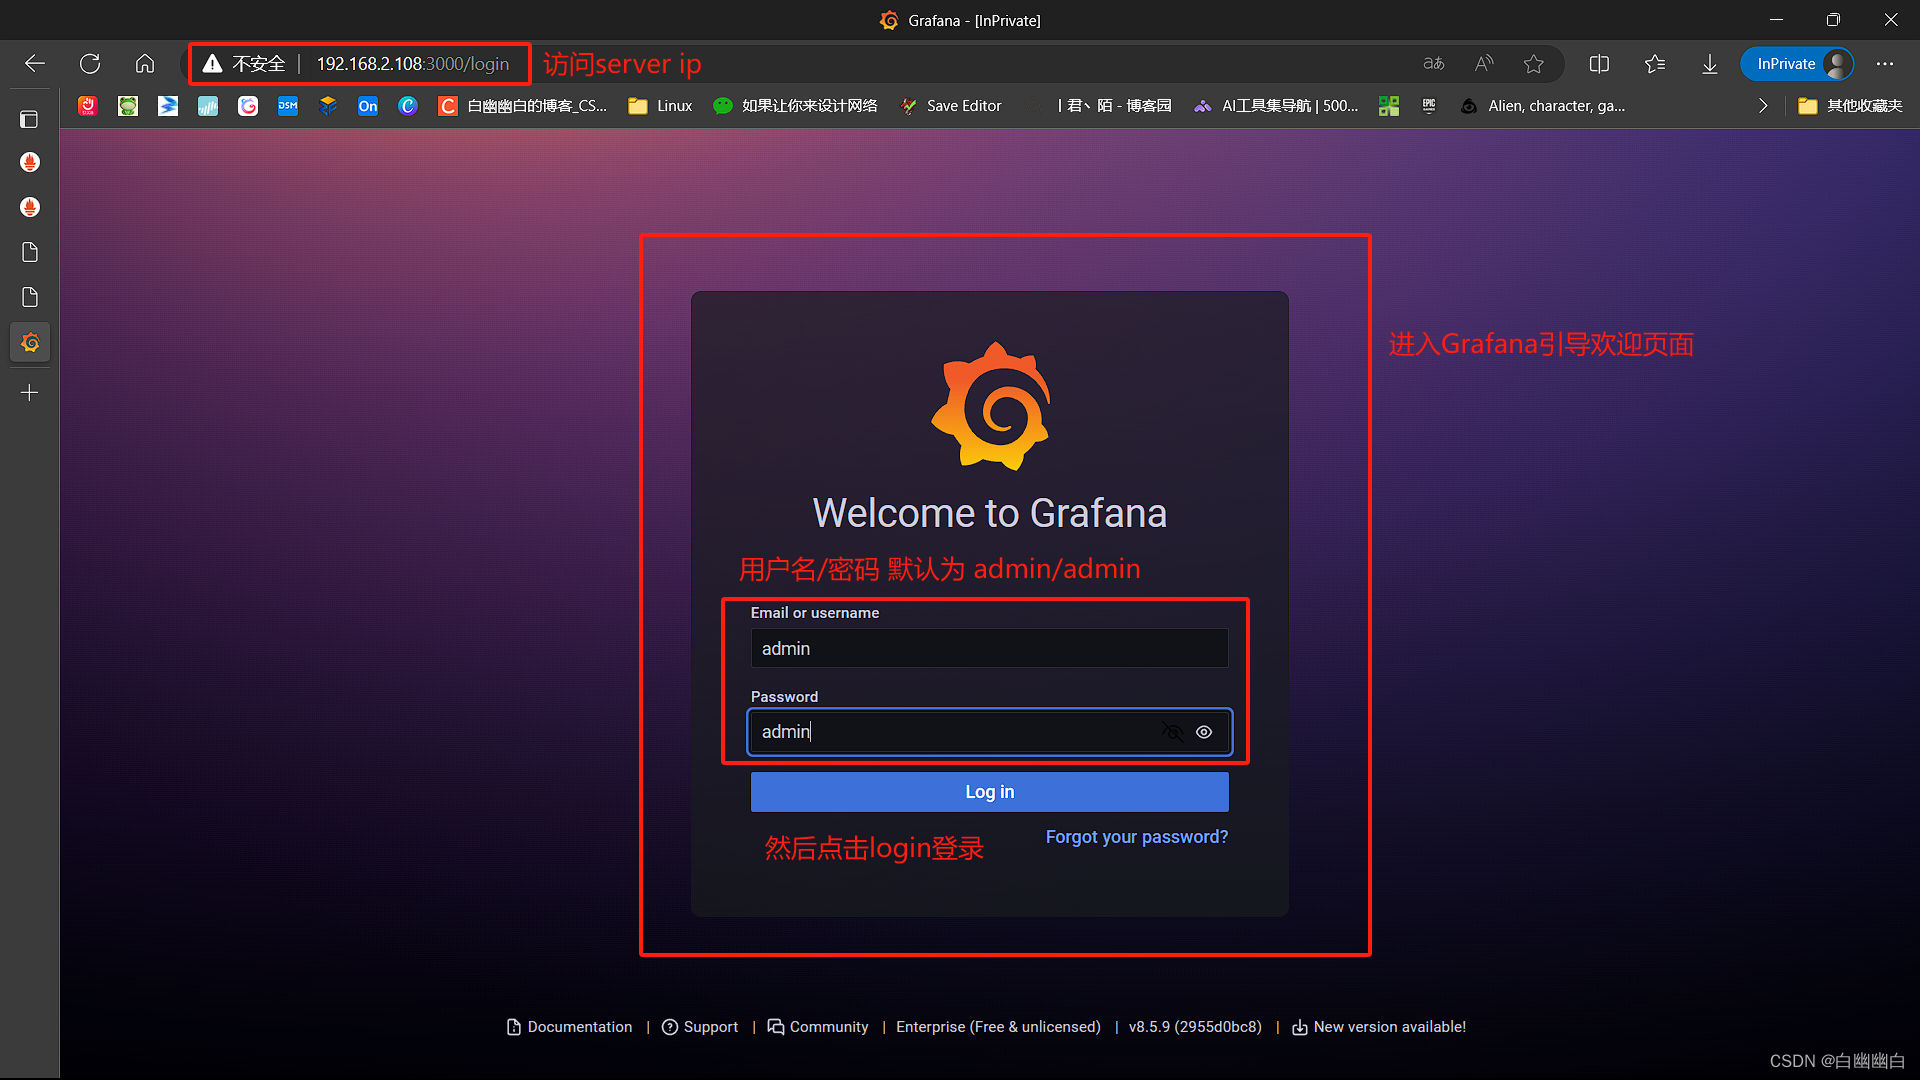
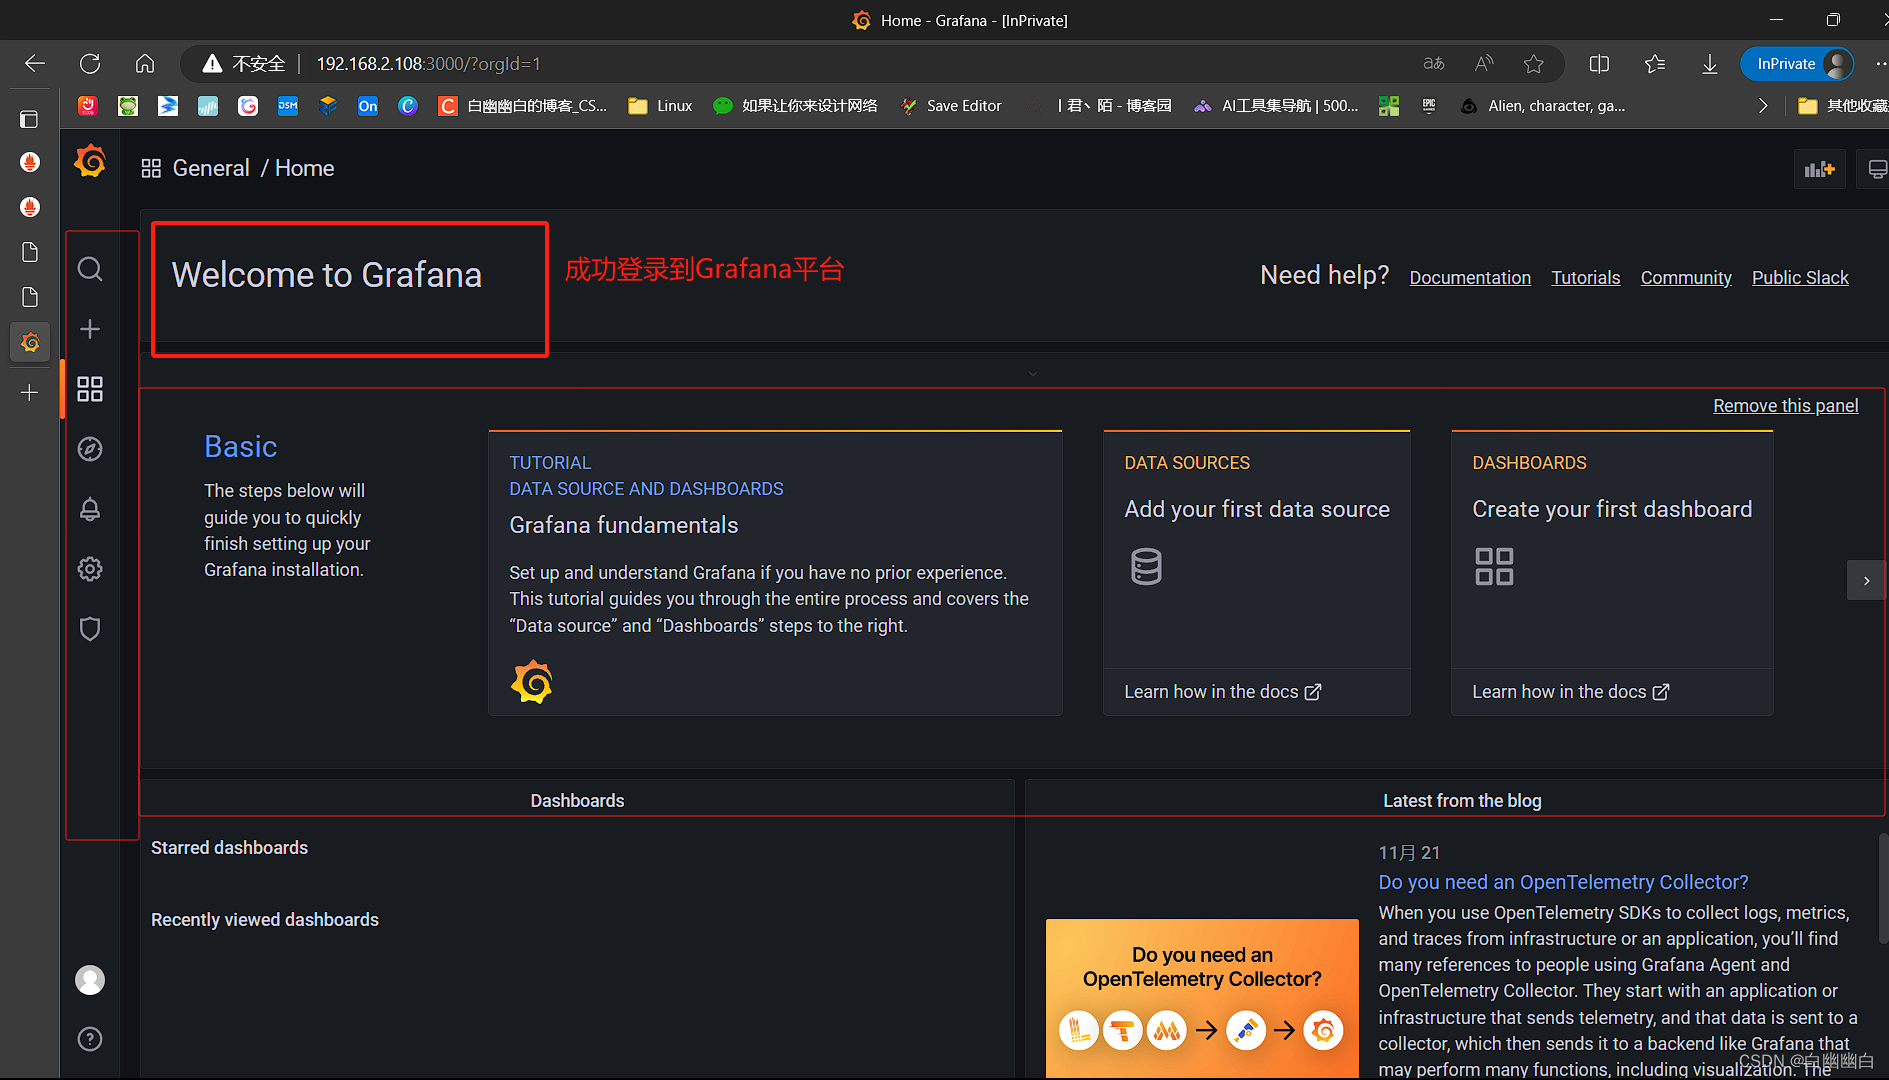
瀏覽器訪問:http://192.168.2.108:3000 ,默認賬號和密碼為 admin/admin
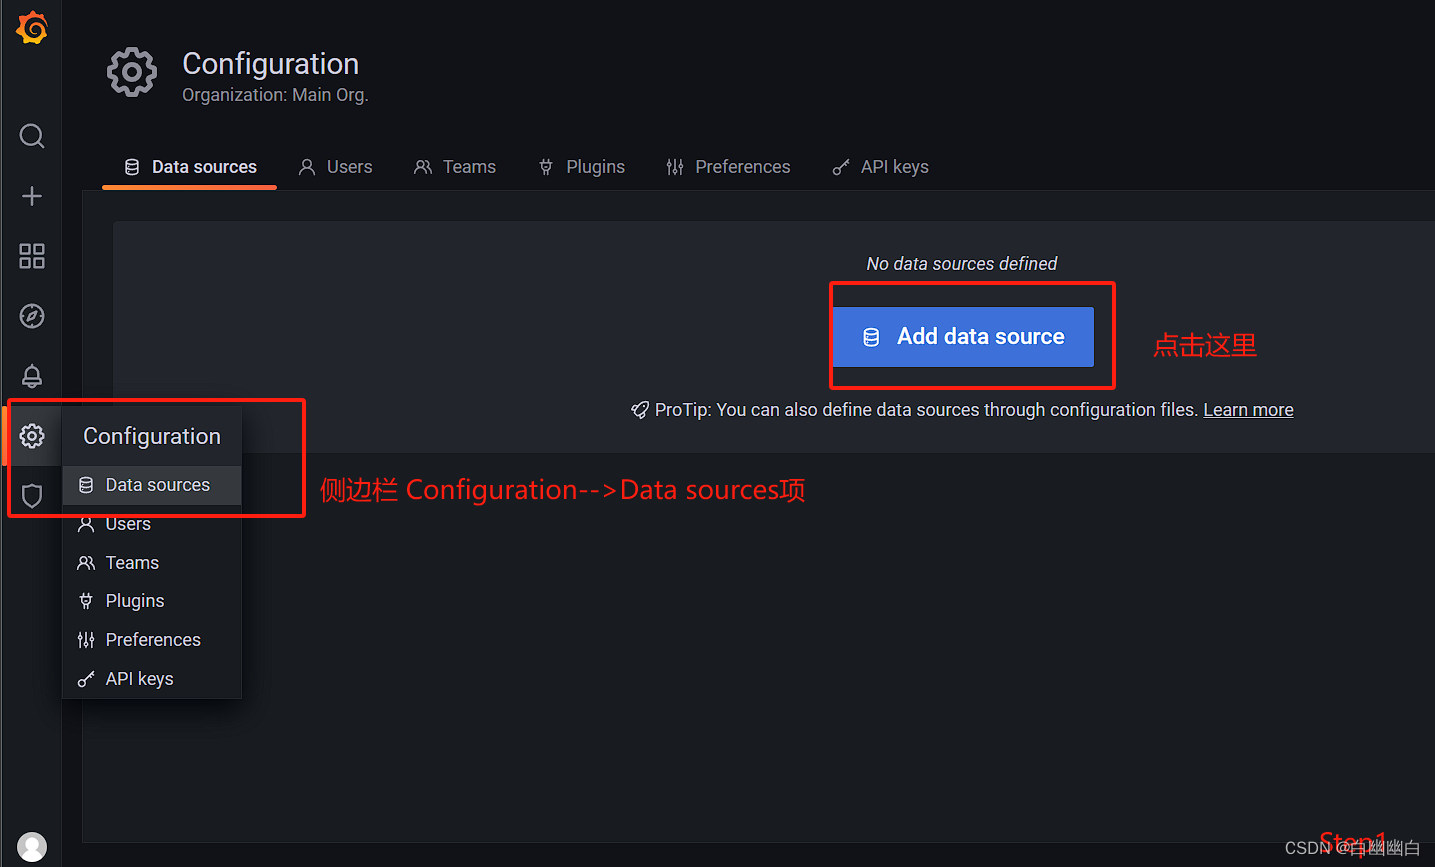
5.2 配置數據源
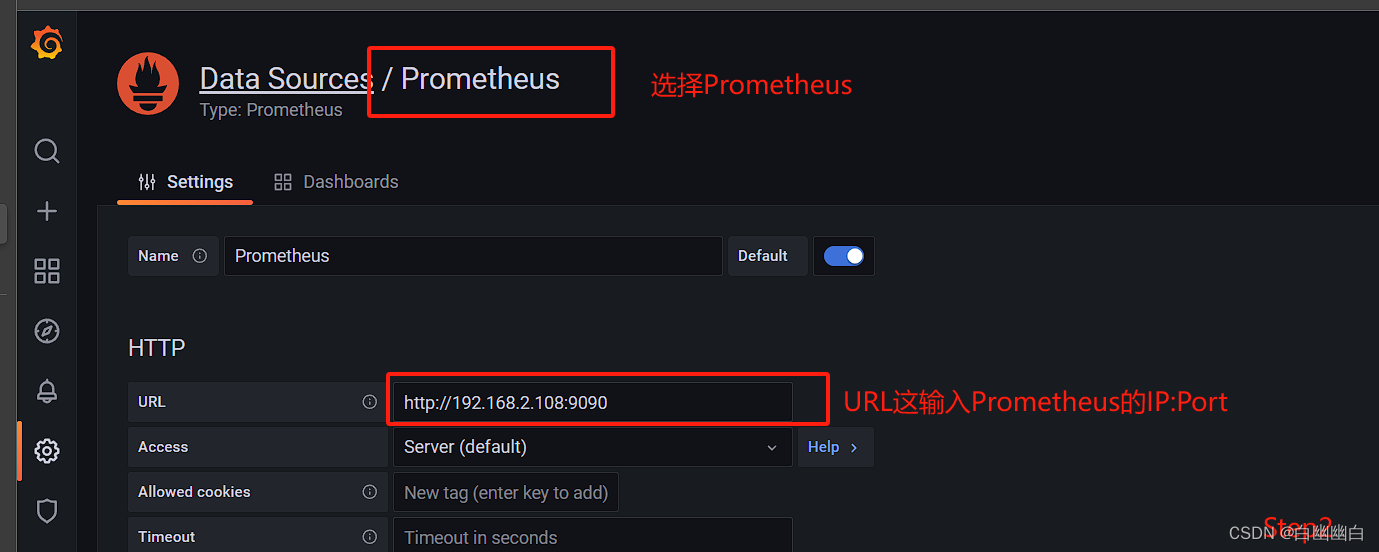
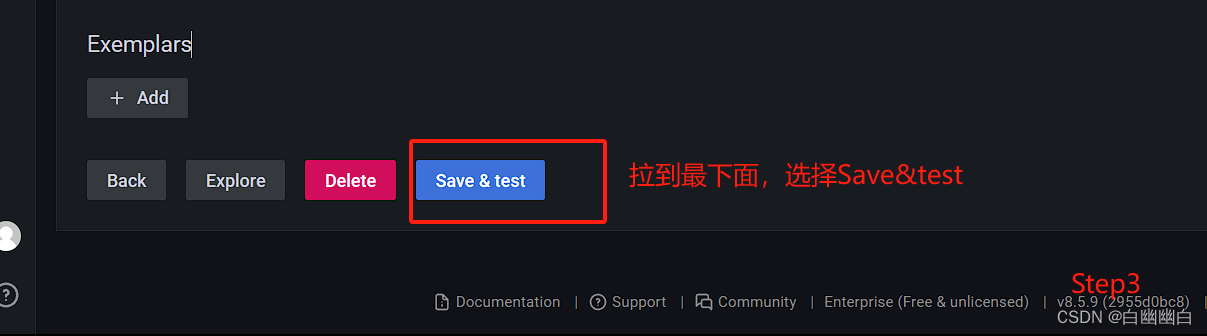
Configuration -> Data Sources -> Add data source -> 選擇 PrometheusHTTP -> URL 輸入 http://192.168.2.108:9090點擊 Save & Test

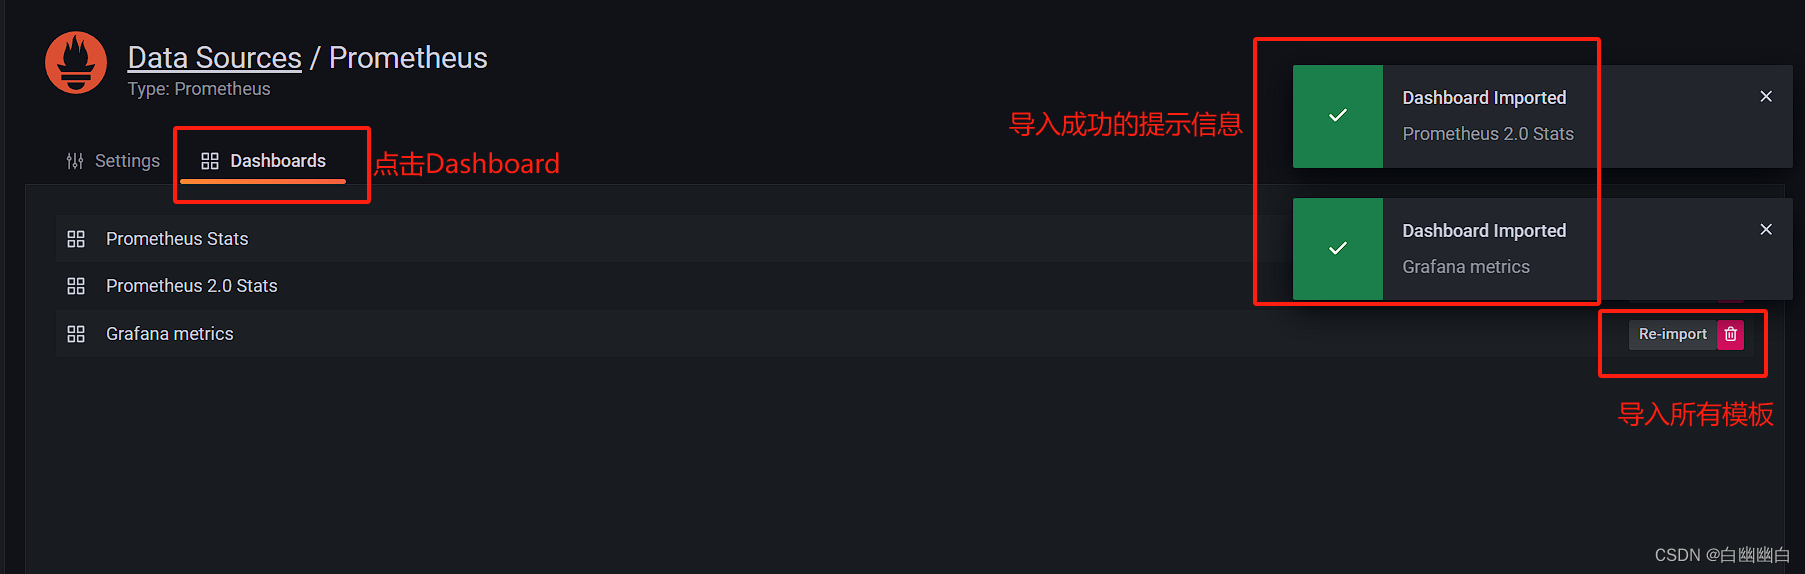
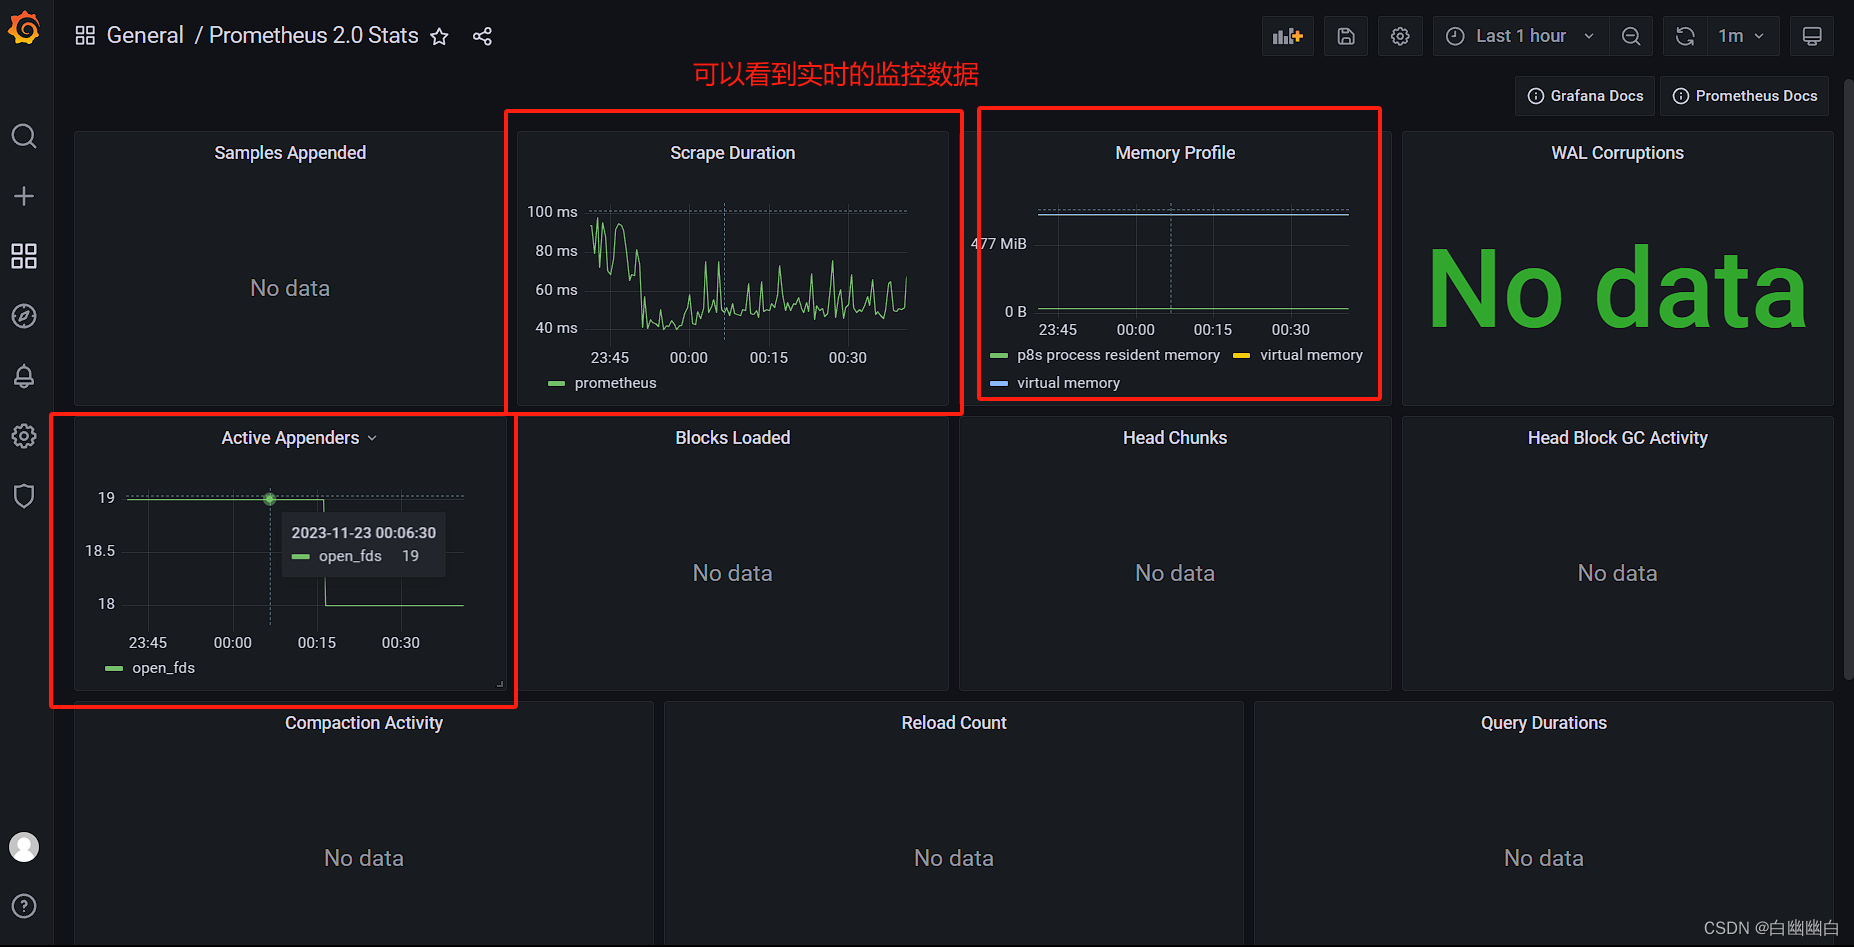
點擊 上方菜單 Dashboards--->Import 所有默認模板Dashboards -> Manage ,選擇 Prometheus 2.0 Stats 或 Prometheus Stats 即可看到 Prometheus job 實例的監控圖像
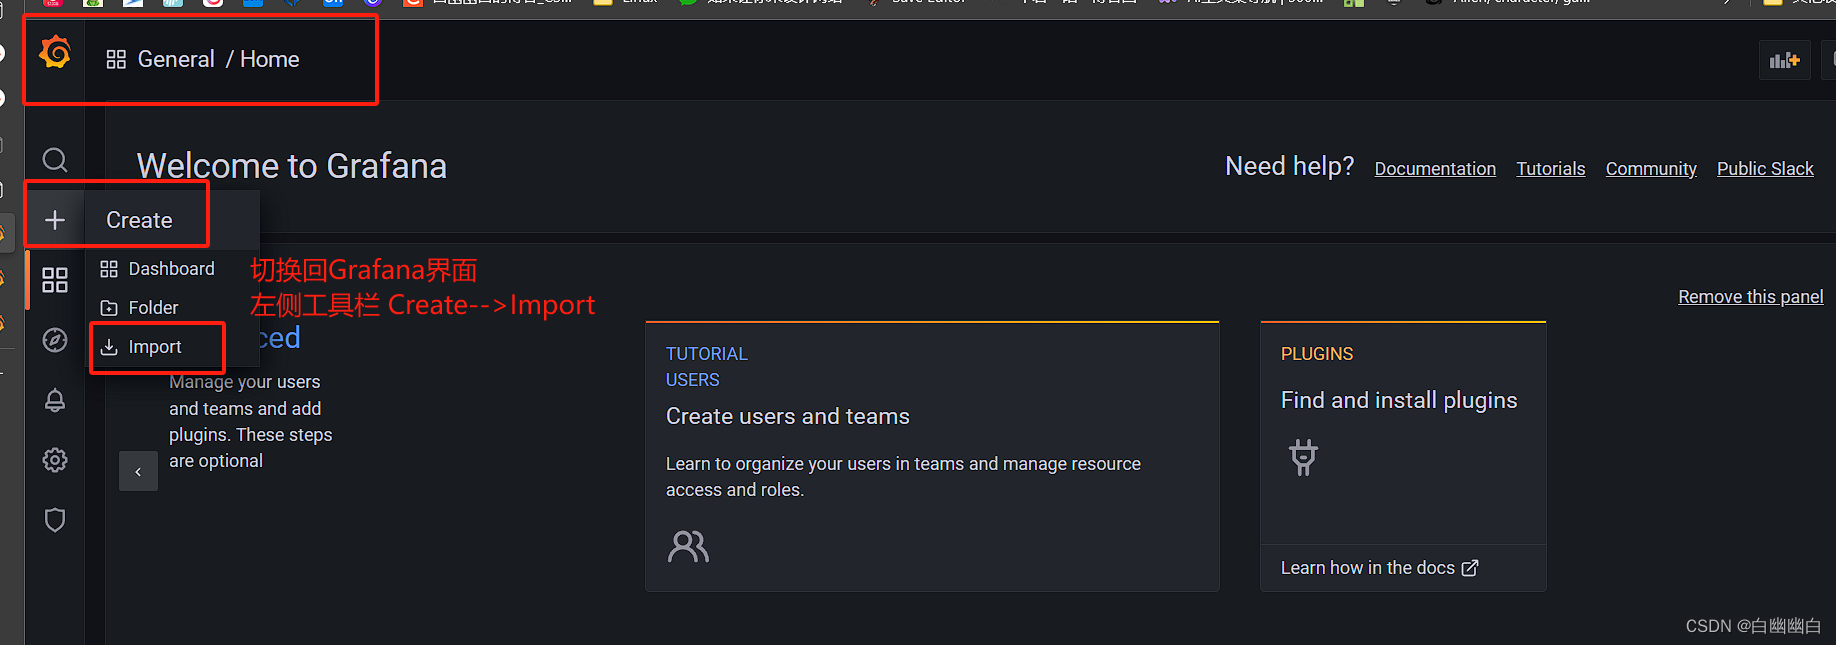
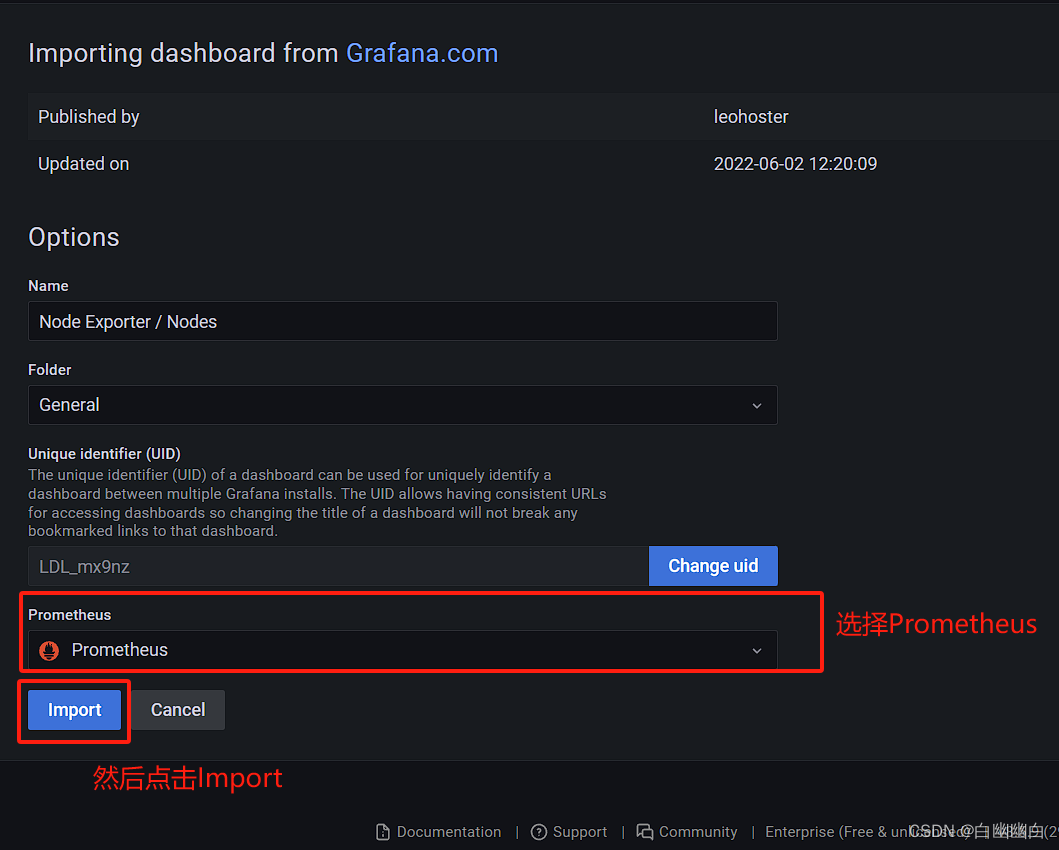
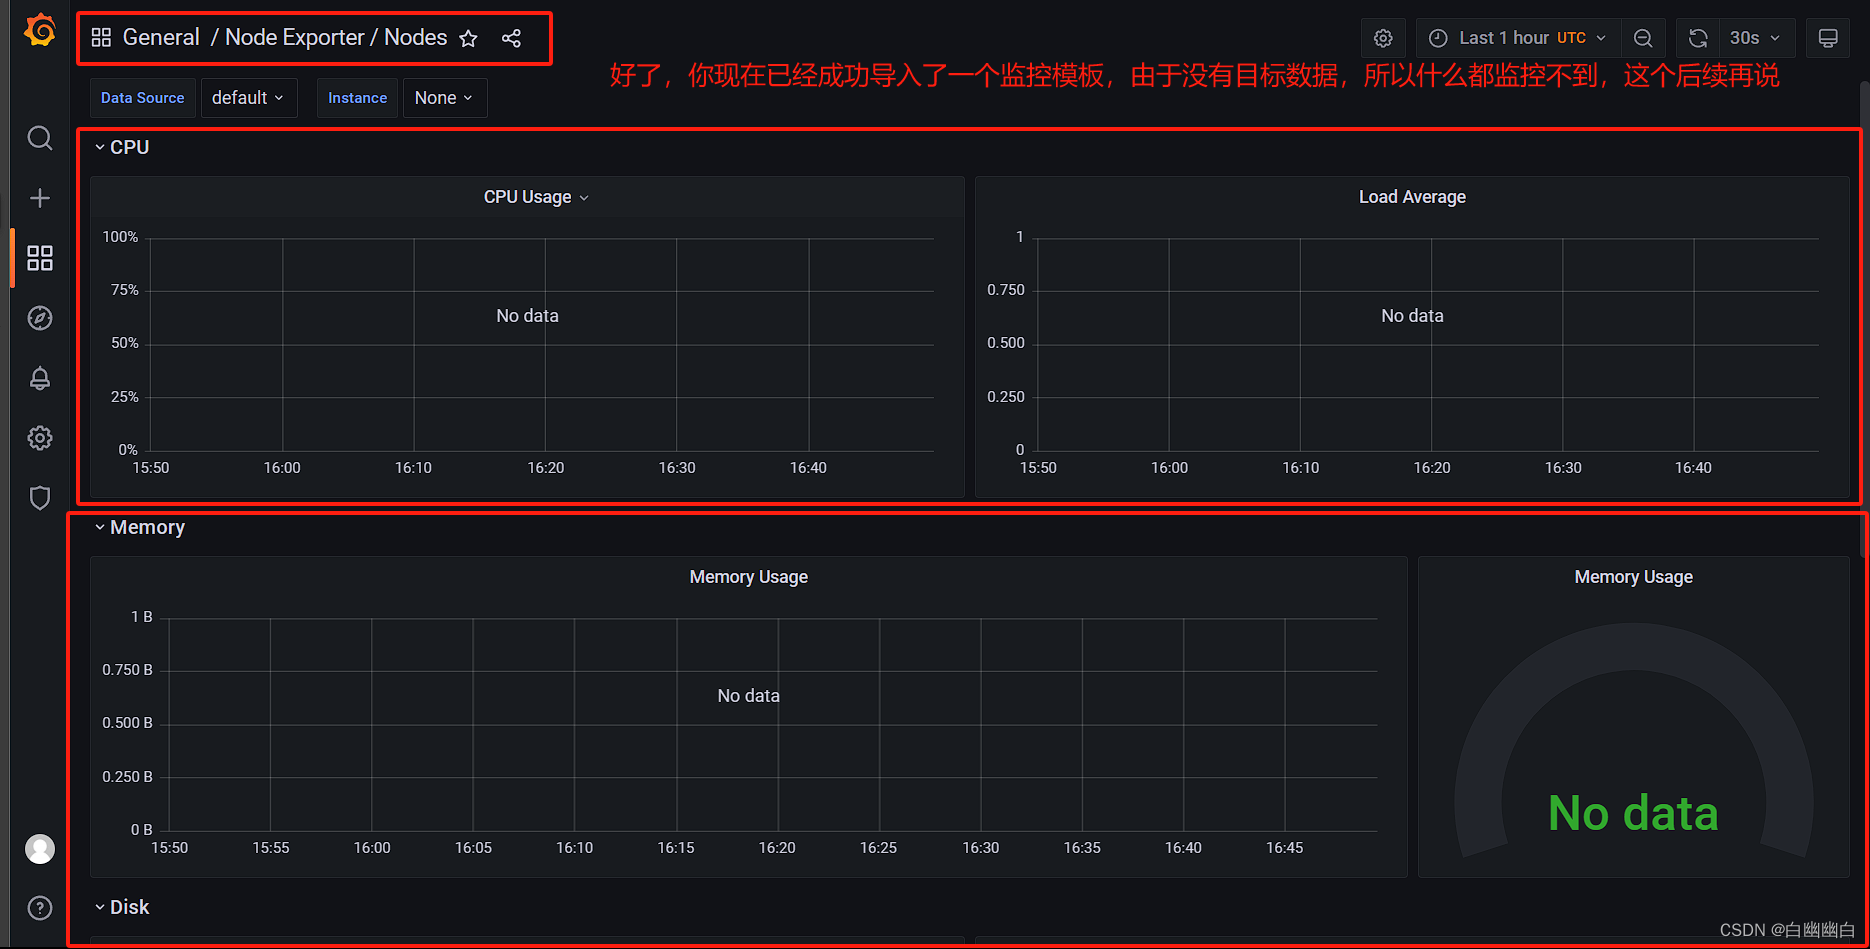
5.3 導入grafana監控面板
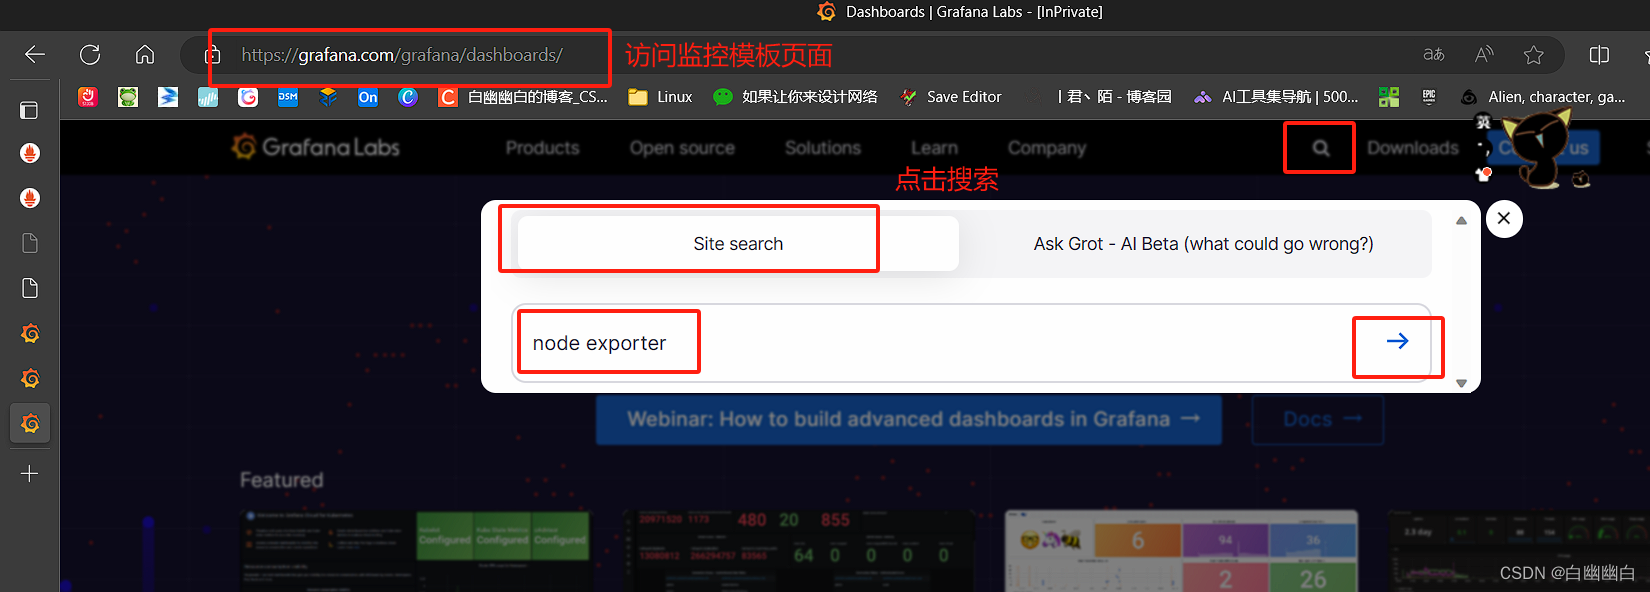
瀏覽器訪問:https://grafana.com/grafana/dashboards
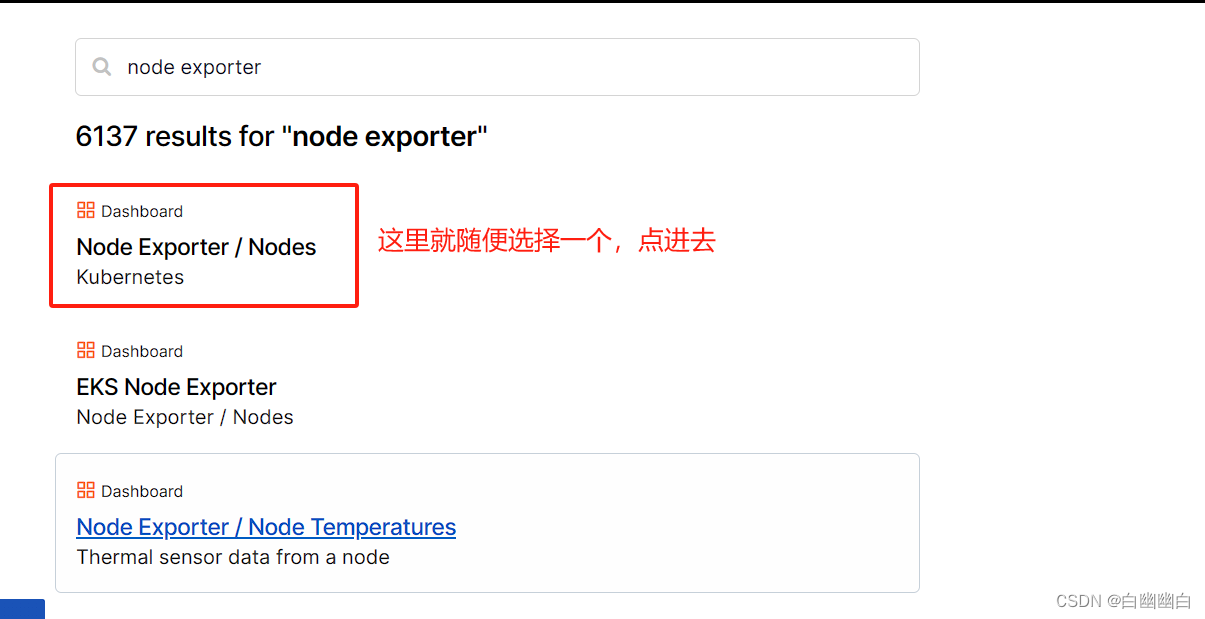
在頁面中搜索 node exporter ,選擇適合的面板,點擊 Copy ID 或者 Download JSON
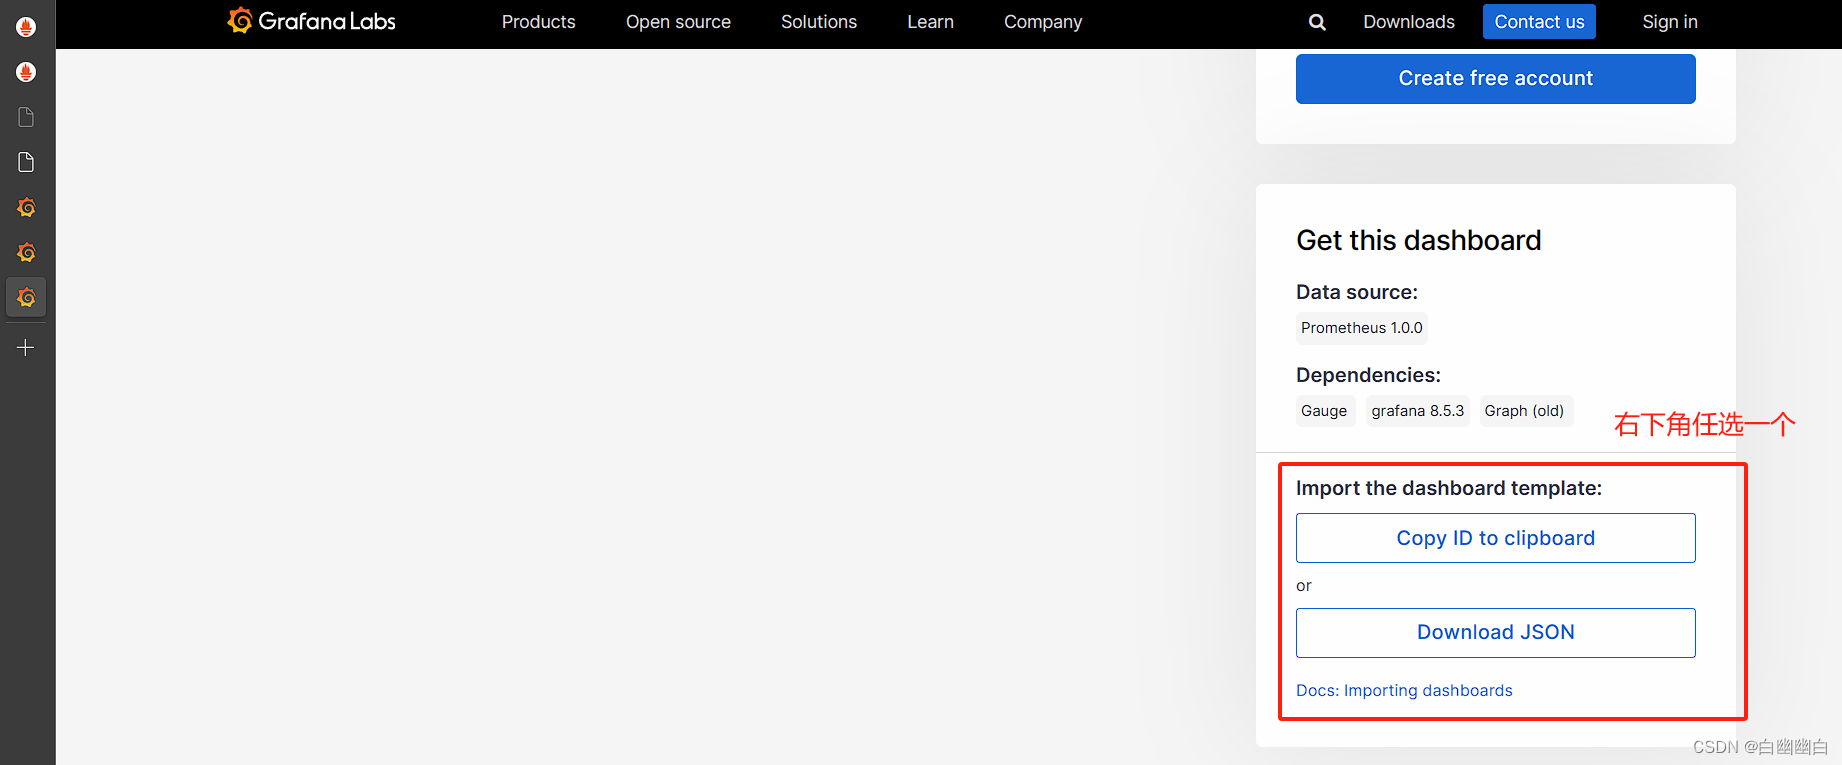
在 grafana 頁面中,+ Create -> Import ,輸入面板 ID 號或者上傳 JSON 文件,點擊 Load,即可導入監控面板


)

![[Linux] shell腳本之循環](http://pic.xiahunao.cn/[Linux] shell腳本之循環)


方法可配置屬性)


)

: 基于邏輯回歸的分類預測)

