目錄標題
- 1、獲取 lime-echart插件
- 2、安裝 echarts
- 3、相關代碼
- 4、在線定制
- 5、效果截圖
1、獲取 lime-echart插件
https://gitee.com/liangei/lime-echart
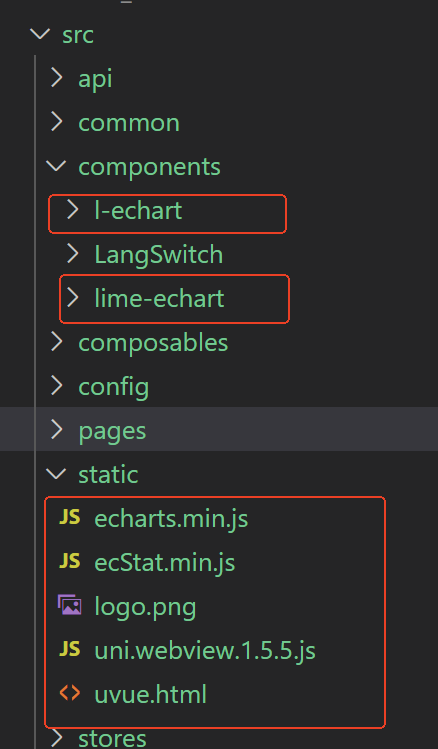
將其中組件和靜態資源分別放入當前項目對應的文件夾中:
2、安裝 echarts
npm install echarts --save
具體查看官網,進行按需或者全局引入
如果只需要支持微信小程序,那可以不用單獨安裝echarts。
3、相關代碼
<template><view style="width:750rpx; height:750rpx"><l-echart ref="chartRef"></l-echart></view>
</template><script setup>
import { ref, onMounted } from 'vue'// #ifdef H5
import  * as echarts from 'echarts'
// #endif// #ifdef MP-WEIXIN
// 一定要確保使用相對路徑引入,不支持別名方式,比如@,使用了可能會出現獲取不到問題
const echarts = require('../../static/echarts.min')
// #endifconsole.log(echarts,'echarts!!!!!!')const chartRef = ref(null)
const option = {xAxis: {type: 'category',data: ['Mon', 'Tue', 'Wed', 'Thu', 'Fri', 'Sat', 'Sun'],},yAxis: {type: 'value',},series: [{data: [120, 200, 150, 80, 70, 110, 130],type: 'bar',},],
}onMounted(() => {// 組件能被調用必須是組件的節點已經被渲染到頁面上setTimeout(async () => {if (!chartRef.value) returnconst myChart = await chartRef.value.init(echarts)myChart.setOption(option)}, 300)
})
</script><style lang="scss" scoped>
</style>
4、在線定制
https://echarts.apache.org/zh/builder.html
由于引入的插件使用的完整的echarts.js文件相對較大,而在小程序中當然是體積越小越好,就自己可以定制下載。選擇自己需要的圖表組件等,下載后,替換static/echarts.min.js文件。
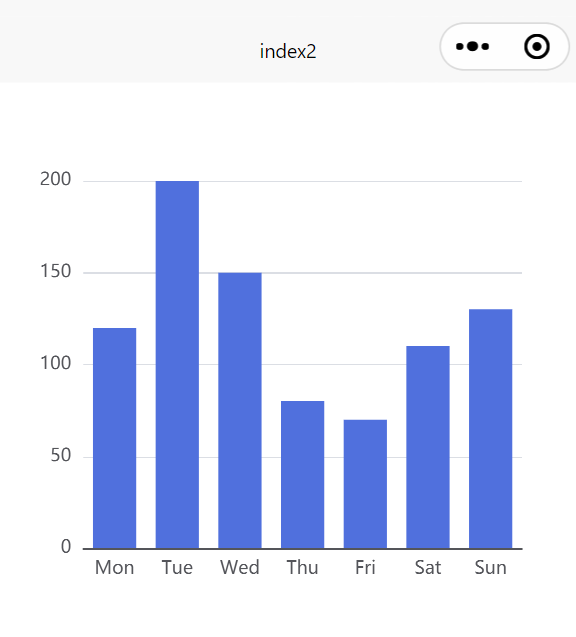
5、效果截圖


![SQLI-labs[Part 2]](http://pic.xiahunao.cn/SQLI-labs[Part 2])

![[硬件電路-194]:NPN三極管、MOS-N, IGBT比較](http://pic.xiahunao.cn/[硬件電路-194]:NPN三極管、MOS-N, IGBT比較)

后半)
 用戶手冊)

![Vue模板中傳遞對象或數組時,避免直接使用字面量[]和{}](http://pic.xiahunao.cn/Vue模板中傳遞對象或數組時,避免直接使用字面量[]和{})


)
)

單片機 APT愛普特微電子 芯片核心解析)
