Title
題目
DeepSPV: A deep learning pipeline for 3D spleen volume estimation from 2Dultrasound images
DeepSPV:一種從2D超聲圖像中估算3D脾臟體積的深度學習流程
01
文獻速遞介紹
1.1 臨床背景 ? 脾腫大指脾臟增大,是多種潛在疾病的重要臨床指標,例如鐮狀細胞病(SCD)(Inusa等人,2016)。在患有鐮狀細胞病的兒科患者中,脾腫大可能伴隨急性脾隔離癥——過多的血細胞被困在脾臟中,導致循環血容量和血紅蛋白顯著下降(Brousse等人,2014)。若不及時干預,這種情況可能危及生命。其他臨床疾病,如癌癥(McCormick和Murphy,2000)、血液疾病(Pozo等人,2009)和感染(Mahmoud和Woodruff,1972)也可能導致脾腫大。因此,在鐮狀細胞病及其他相關疾病中,脾臟大小的測量常作為確定患者治療方案的輔助依據。這就需要準確測量脾臟大小并識別脾腫大的方法。 ?### 1.2 挑戰 ? 在臨床環境中,檢測脾腫大的常見初步方法是手動觸診。如果能在左肋下緣觸及脾臟,則懷疑其腫大。雖然手動觸診結果曾被視為脾腫大的證據(Schloesser,1963),但后續研究表明,高達16%的可觸及脾臟經放射學評估后顯示大小正常(Arkles等人,1986)。此外,手動觸診較為粗略、無法量化,僅能作為是否需要進一步影像學檢查的初步判斷。 ? 超聲(US)是檢測脾腫大最常用的成像方式,通常在臨床檢查中緊隨手動觸診之后進行。它在大多數臨床環境中普及性高,且具有無創、便攜的特點。脾臟長度可通過2D冠狀位超聲圖像測量,因其與脾臟體積相關性較好(Lamb等人,2002),常被用作表征脾臟整體大小的指標(Pozo等人,2009)。然而,盡管存在這種相關性,脾臟長度仍只是一種替代測量方式,而脾臟體積仍是評估脾臟大小的金標準。此外,除了判斷脾腫大外,脾臟體積在確定相關疾病的嚴重程度和指導治療方案方面也是更優的指標(Kotlyar等人,2014;Koga等人,2016;Khoshpouri等人,2018)。 ? 計算機斷層掃描(CT)和磁共振成像(MRI)等3D成像模態被認為是脾臟體積測量的金標準方法(Yetter等人,2003;Holmstr?m等人,2022;Paul等人,2017)。基于CT或MRI檢查,可通過手動分割脾臟計算體積,但這種方法極其耗時。更常用的方式是根據手動測量的脾臟尺寸,使用Prassopoulos等人(1997)提出的線性回歸公式估算體積。基于深度學習的框架也已被用于從3D CT和MRI中分割脾臟(Ahn等人,2020;Moon等人,2019;Humpire-Mamani等人,2020;Altini等人,2022;Meddeb等人,2021;Huo等人,2018),這也為脾臟體積測量提供了便利。盡管如此,CT涉及電離輻射,因此在世界許多地區可能不會用于脾臟大小估算;而MRI圖像則常因運動偽影問題難以獲得可靠結果。此外,由于3D成像設備成本高昂且安裝維護復雜,在鐮狀細胞病相關脾腫大高發地區(如全球南部),其可及性較低(Piel等人,2013;Grosse等人,2011)。 ? 3D超聲成像是一種潛在的替代方案,可直接提供體積測量。然而,盡管3D超聲已成功應用于淺表和靜態解剖結構(如下肢肌肉)(Al Chanti等人,2021;Huet等人,2024),但獲取整個脾臟的高質量3D超聲圖像仍面臨挑戰。這主要是由于肋骨的遮擋,以及膈肌或胃/腸道內氣體的干擾,導致圖像質量下降。此外,由于聲學窗口有限,有時無法在單視角下完整成像整個脾臟。在肝臟等大型器官的3D超聲成像中也存在類似挑戰(Treece等人,2001)。3D超聲也可通過掃查2D超聲圖像或自由手2D超聲圖像的合成來實現。傳統重建方法包括依賴外部跟蹤系統的基于傳感器的方法(Rohling等人,1999;Daoud等人,2015;Wen等人,2013),以及無傳感器方法(如Gee等人,2006)。深度學習的最新進展進一步推動了自由手2D超聲重建,實現了端到端的訓練和推理(如Luo等人,2023;Yeung等人,2024;Gaits等人,2024)。然而,由于呼吸或整體運動可能導致偽影,且受上述3D超聲采集的限制因素影響,獲取多個(超過兩個)不同角度的2D超聲圖像進行后續3D重建仍具挑戰。這些限制使得收集一系列質量一致的2D超聲圖像以進行可靠3D重建變得不切實際。 ? 鑒于這些限制,2D超聲成像仍是當前脾臟評估臨床工作流程中的標準模態(Lamb等人,2002)。盡管3D超聲和基于2D超聲的3D重建尚不實用,但可基于冠狀位和橫斷位2D超聲的測量結果,使用線性回歸公式(包括標準橢球體公式(De Odorico等人,1999;Chow等人,2016)或其修改版本(Yetter等人,2003))估算脾臟體積。這些方法已應用于臨床實踐,但其準確性和穩健性在很大程度上依賴于觀察者的經驗。此外,在鐮狀細胞病高發的低收入和中等收入國家,這類專業知識往往匱乏。因此,從2D超聲圖像中測量脾臟長度仍是最廣泛采用的脾臟大小評估方法,而脾臟體積作為生物標志物的臨床價值仍有待深入研究。 ?### 1.3 研究動機與貢獻 ? 鑒于CT、MRI和3D超聲存在的挑戰,我們的總體目標是開發一種可直接從標準臨床視角的2D超聲圖像中估算脾臟體積的流程,以契合當前脾臟大小檢查的臨床工作流程。這里的“標準臨床視角”指超聲檢查中通常采集的冠狀位和橫斷位視圖。 ? 我們提出了DeepSPV,這是一種基于深度學習的新型流程,用于從單視角(冠狀位)或雙視角(冠狀位和橫斷位)2D超聲圖像中精確估算脾臟體積。該流程包括兩部分:首先,從2D超聲圖像中自動分割脾臟;其次,根據分割結果估算體積。我們使用由超聲語義擴散模型(USDM)從CT圖像(帶有真實脾臟體積)生成的高真實感合成超聲圖像數據集,在單視角條件下成功評估了整個流程。據我們所知,這是首個使用深度學習從2D超聲圖像中估算脾臟體積的研究。本研究的主要貢獻可總結為: ? 1. 提出了一種基于變分自編碼器(VAE)的新型框架,可從單張或兩張2D脾臟分割結果中自動估算3D脾臟體積。 ? 2. 在該框架內提出并評估了三種不同的體積估算方法。 ? 3. 除體積估算外,我們的框架還能估算置信區間,并提供一定程度的可解釋性,以支持實際臨床場景中的決策。 ? 4. 生成并公開了一個帶有真實脾臟體積的高真實感合成超聲圖像數據庫。 ? 5. 利用該數據庫,在單視角條件下成功評估了整個流程,其體積估算精度超過了使用相同數據的人類專家。
Abatract
摘要
Splenomegaly, the enlargement of the spleen, is an important clinical indicator for various associated medicalconditions, such as sickle cell disease (SCD). Spleen length measured from 2D ultrasound is the most widelyused metric for characterising spleen size. However, it is still considered a surrogate measure, and spleenvolume remains the gold standard for assessing spleen size. Accurate spleen volume measurement typicallyrequires 3D imaging modalities, such as computed tomography or magnetic resonance imaging, but these arenot widely available, especially in the Global South which has a high prevalence of SCD. In this work, weintroduce a deep learning pipeline, DeepSPV, for precise spleen volume estimation from single or dual 2Dultrasound images. The pipeline involves a segmentation network and a variational autoencoder for learninglow-dimensional representations from the estimated segmentations. We investigate three approaches for spleenvolume estimation and our best model achieves 86.62%/92.5% mean relative volume accuracy (MRVA) undersingle-view/dual-view settings, surpassing the performance of human experts. In addition, the pipeline canprovide confidence intervals for the volume estimates as well as offering benefits in terms of interpretability,which further support clinicians in decision-making when identifying splenomegaly. We evaluate the fullpipeline using a highly realistic synthetic dataset generated by a diffusion model, achieving an overall MRVAof 83.0% from a single 2D ultrasound image. Our proposed DeepSPV is the first work to use deep learning toestimate 3D spleen volume from 2D ultrasound images and can be seamlessly integrated into the current clinicalworkflow for spleen assessment. We also make our synthetic spleen ultrasound dataset publicly available.
脾腫大(脾臟增大)是多種相關疾病的重要臨床指標,例如鐮狀細胞病(SCD)。通過2D超聲測量的脾臟長度是表征脾臟大小最常用的指標。然而,這仍被視為一種替代測量方式,而脾臟體積仍是評估脾臟大小的金標準。準確的脾臟體積測量通常需要3D成像模態,如計算機斷層掃描(CT)或磁共振成像(MRI),但這些設備并非廣泛可得,尤其在鐮狀細胞病高發的全球南部地區。 在本研究中,我們提出了一種深度學習流程——DeepSPV,用于從單張或兩張2D超聲圖像中精確估算3D脾臟體積。該流程包含一個分割網絡和一個變分自編碼器,變分自編碼器用于從估算的分割結果中學習低維表征。我們研究了三種脾臟體積估算方法,其中性能最佳的模型在單視角/雙視角設置下,平均相對體積精度(MRVA)分別達到86.62%/92.5%,超過了人類專家的表現。此外,該流程還能為體積估算結果提供置信區間,并具有可解釋性優勢,這有助于臨床醫生在診斷脾腫大時做出決策。 我們使用由擴散模型生成的高真實感合成數據集對整個流程進行評估,從單張2D超聲圖像中獲得了83.0%的整體平均相對體積精度。我們提出的DeepSPV是首個利用深度學習從2D超聲圖像中估算3D脾臟體積的研究,能夠無縫整合到當前的脾臟評估臨床工作流程中。我們還公開了合成的脾臟超聲數據集。
Method
方法
In this section, we present the details of our DeepSPV for automatedestimation of volume from 2D single- or dual-view spleen US images.Fig. 1 provides an overview of the DeepSPV pipeline (see blue dottedframe) and the generation of synthetic US data for pipeline evaluation.The pipeline consists of a deep learning-based spleen segmentationmodel followed by a VAE-based volume estimation model. Note thatdue to the lack of paired 2D US images and corresponding groundtruth volumes, we utilised 3D manual spleen segmentations from a CTdataset to develop and evaluate our proposed methods. Details of thisdataset are provided in Section 4.1.1.We start by providing a brief description of the 2D US imagesegmentation model in Section 3.1. Then, we describe the VAE-basedmodel for automated estimation of volume from single- or dual-view2D spleen segmentations, in which we propose three different methodsfor volume estimation. Finally, Section 3.3 details our USDM, which isused to generate a synthetic US dataset for developing and evaluatingthe pipeline.frame) and the generation of synthetic US data for pipeline evaluation.The pipeline consists of a deep learning-based spleen segmentationmodel followed by a VAE-based volume estimation model. Note thatdue to the lack of paired 2D US images and corresponding groundtruth volumes, we utilised 3D manual spleen segmentations from a CTdataset to develop and evaluate our proposed methods. Details of thisdataset are provided in Section 4.1.1.We start by providing a brief description of the 2D US imagesegmentation model in Section 3.1. Then, we describe the VAE-basedmodel for automated estimation of volume from single- or dual-view2D spleen segmentations, in which we propose three different methodsfor volume estimation. Finally, Section 3.3 details our USDM, which isused to generate a synthetic US dataset for developing and evaluatingthe pipeline.
在本節中,我們將詳細介紹用于從2D單視角或雙視角脾臟超聲圖像中自動估算體積的DeepSPV。圖1展示了DeepSPV流程的概述(參見藍色虛線框)以及用于流程評估的合成超聲數據的生成過程。該流程包含一個基于深度學習的脾臟分割模型,以及一個基于變分自編碼器(VAE)的體積估算模型。需要注意的是,由于缺乏配對的2D超聲圖像及相應的真實體積數據,我們利用了一個CT數據集中的3D手動脾臟分割結果來開發和評估我們提出的方法。該數據集的詳細信息將在4.1.1節中介紹。 我們首先在3.1節中簡要描述2D超聲圖像分割模型。然后,闡述基于VAE的模型——該模型用于從單視角或雙視角2D脾臟分割結果中自動估算體積,其中我們提出了三種不同的體積估算方法。最后,3.3節詳細介紹我們的超聲語義擴散模型(USDM),該模型用于生成合成超聲數據集,以開發和評估上述流程。
Conclusion
結論
In this work, we have proposed DeepSPV, consisting of a 2D USsegmentation model and a volume estimation model, to estimate thespleen volume from 2D spleen US images. To the best of our knowledge,this is the first work employing 2D US for 3D spleen volume estimationand has surpassed human expert level and existing reconstruction-basedand regression-based methods in spleen volume estimation.
在本研究中,我們提出了DeepSPV(深度脾臟體積估算模型),該模型由一個2D超聲分割模型和一個體積估算模型組成,用于從2D脾臟超聲圖像中估算脾臟體積。據我們所知,這是首個利用2D超聲實現3D脾臟體積估算的研究,且在脾臟體積估算方面的表現優于人類專家水平以及現有的基于重建和基于回歸的方法。
Results
結果
5.1. Evaluation metrics
To evaluate the performance of the segmentation network, weadopted the Dice score. We also computed the Hausdorff distance (HD)between the predicted segmentation contour and the ground truthsegmentation contour.
5.1 評估指標 ? 為評估分割網絡的性能,我們采用了Dice系數。同時,我們還計算了預測分割輪廓與真實分割輪廓之間的豪斯多夫距離(HD)。
Figure
圖
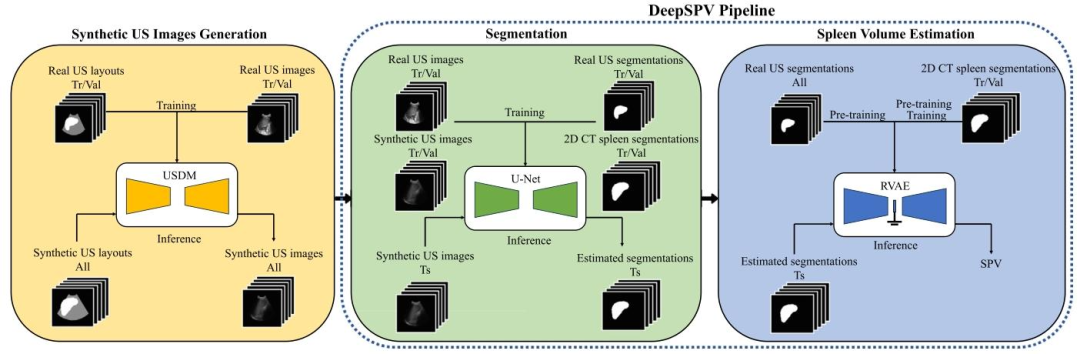
Fig. 1. An overview of this study. It first involves generating synthetic US images with the USDM, which is necessary due to the lack of paired 2D US images and ground truthvolumes. The complete DeepSPV pipeline, proposed to estimate spleen volume from 2D US images, is enclosed within the blue dotted frame and consists of two parts: segmentationand spleen volume estimation. USDM: ultrasound semantic diffusion model. RVAE: end-to-end regression VAE. SPV: spleen volume. Tr/Val/Ts: training/validation/test
圖1. 本研究概述。首先涉及使用超聲語義擴散模型(USDM)生成合成超聲圖像,這是由于缺乏配對的2D超聲圖像和真實體積數據。藍色虛線框內是用于從2D超聲圖像估算脾臟體積的完整DeepSPV流程,該流程由兩部分組成:分割和脾臟體積估算。USDM:超聲語義擴散模型;RVAE:端到端回歸變分自編碼器;SPV:脾臟體積;Tr/Val/Ts:訓練/驗證/測試。
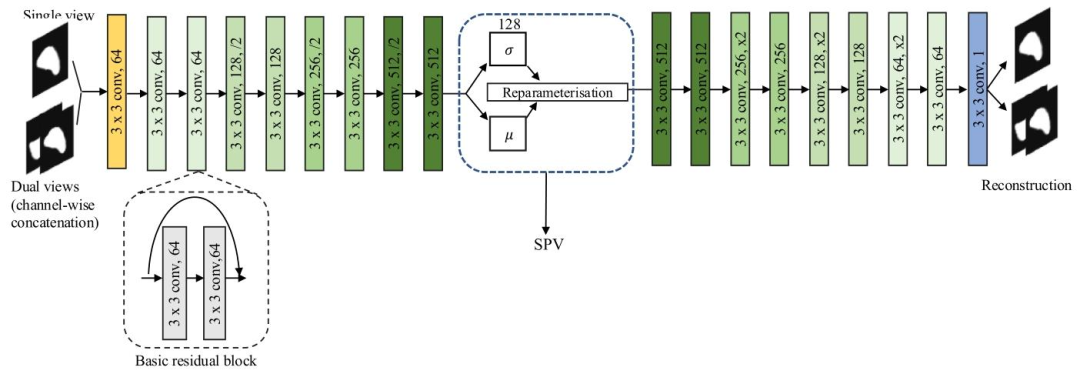
Fig. 2. An illustration of the proposed VAE-based framework. The latent space distribution is parameterised by the mean 𝜇 and standard deviation 𝜎, which is shown in the bluedotted frame. The spleen volume is estimated from this distribution. The basic residual block is shown in the black dotted frame. All our VAE-based models were trained witheither a coronal slice (single view) or a channel-wise concatenation of a coronal slice and a transverse slice (dual views). SPV: spleen volume.
圖2. 所提出的基于變分自編碼器(VAE)的框架示意圖。潛在空間分布由均值𝜇和標準差𝜎參數化(如藍色虛線框所示)。脾臟體積通過該分布估算得出。黑色虛線框展示了基本殘差塊。我們所有基于VAE的模型均使用冠狀位切片(單視角)或冠狀位切片與橫斷位切片的通道級拼接(雙視角)進行訓練。SPV:脾臟體積。
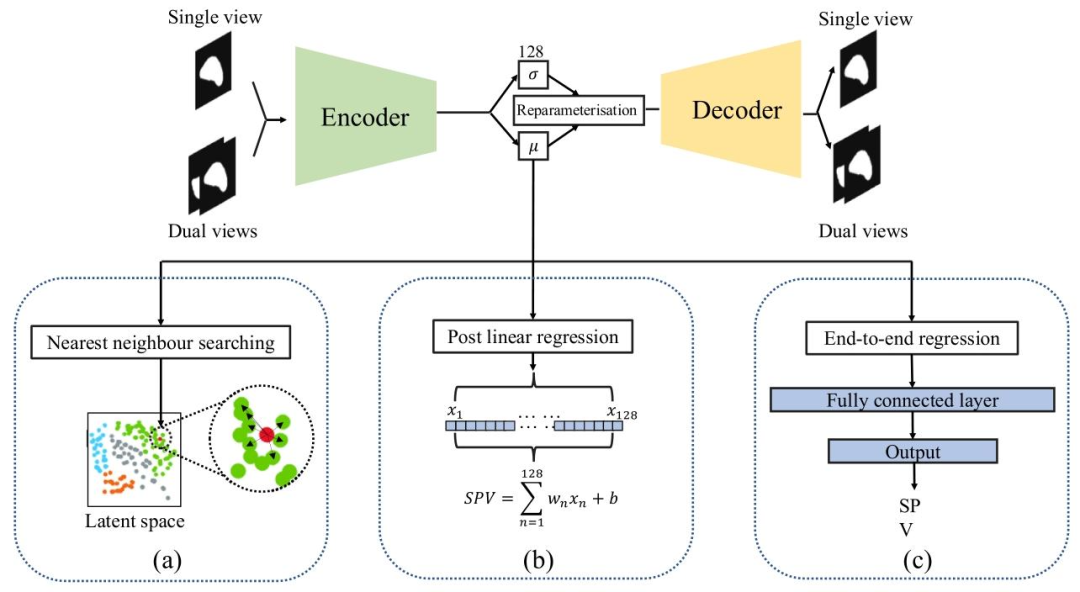
Fig. 3. Illustration of three proposed VAE-based methods: (a) Nearest neighbour searching in the latent space (NN). (b) Post linear regression of latent representations (PLR). (c)End-to-end regression VAE (RVAE)
圖3. 三種所提出的基于變分自編碼器(VAE)的方法示意圖:(a)潛在空間中的最近鄰搜索(NN)。(b)潛在表征的后線性回歸(PLR)。(c)端到端回歸變分自編碼器(RVAE)。
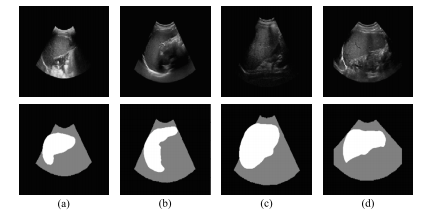
Fig. 4. US images and their corresponding US layouts. The top row displays the originalUS images while the bottom row presents their corresponding US layouts. Each columnrefers to a specific case
圖4. 超聲圖像及其相應的超聲布局。上行展示原始超聲圖像,下行呈現其對應的超聲布局。每一列對應一個特定病例。
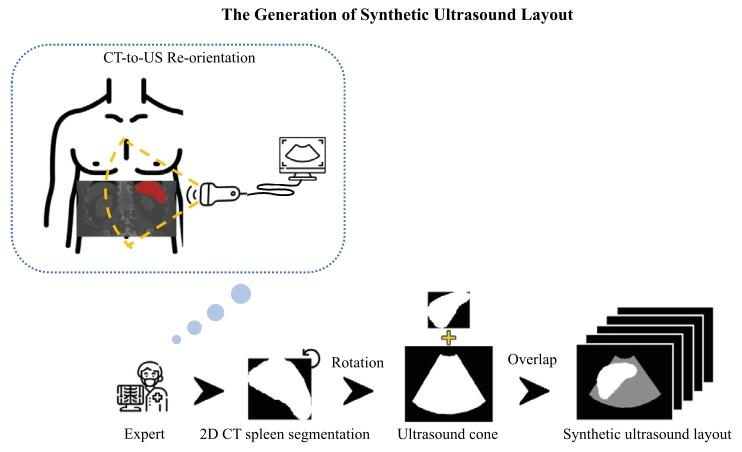
Fig. 5. Illustration of the synthetic US layout creation process. The diagram shows how2D CT spleen segmentations were rotated and aligned with real US cones under expertguidance to emulate realistic clinical acquisition. Specifically, to match the typical leftsided relative location of US probes to the patient in a US examination, the spleensegmentation from CT was rotated 90 degrees anti-clockwise and manually overlaidwith an appropriately sized US cone by a human expert.
圖5. 合成超聲布局創建過程示意圖。該圖展示了在專家指導下,如何對2D CT脾臟分割結果進行旋轉并與真實超聲錐(掃描范圍)對齊,以模擬真實的臨床采集場景。具體而言,為匹配超聲檢查中探頭相對于患者左側的典型位置,CT中的脾臟分割結果被逆時針旋轉90度,并由專家手動疊加在大小適當的超聲錐上。
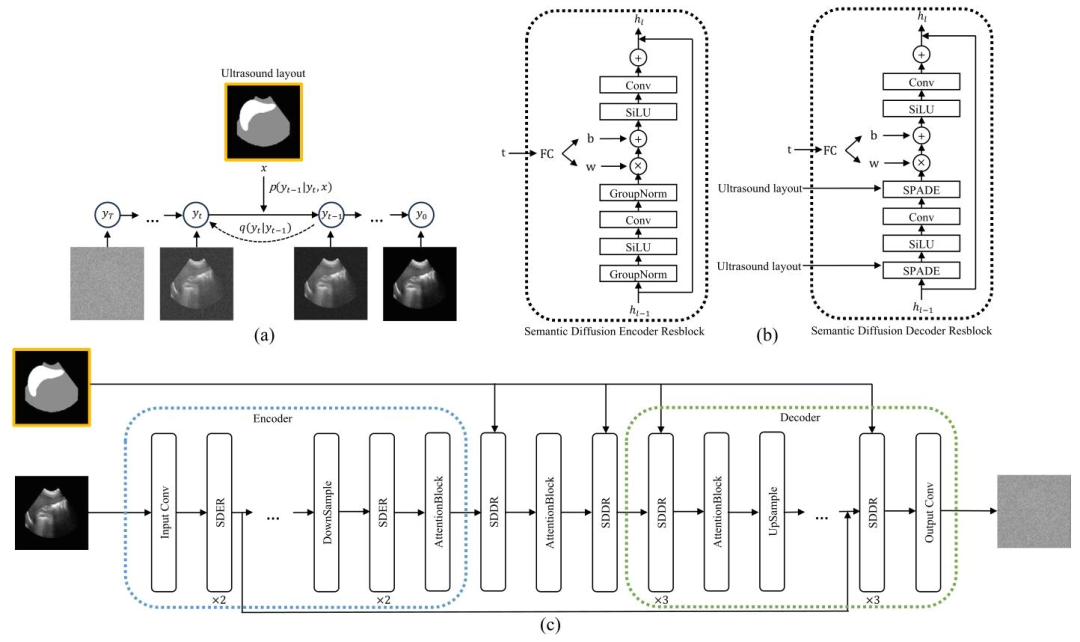
Fig. 6. (a) US Semantic Diffusion Model (USDM). The framework transforms the noise from a standard Gaussian distribution to a realistic image through an iterative denoisingprocess guided by the US layout 𝑥. (b) Semantic Diffusion Encoder Resblock (SDER) and Semantic Diffusion Decoder Resblock (SDDR). (c) The detailed architecture of the USDM.
圖6. (a)超聲語義擴散模型(USDM)。該框架通過在超聲布局𝑥引導下的迭代去噪過程,將標準高斯分布的噪聲轉化為真實感圖像。(b)語義擴散編碼器殘差塊(SDER)和語義擴散解碼器殘差塊(SDDR)。(c)超聲語義擴散模型(USDM)的詳細架構。
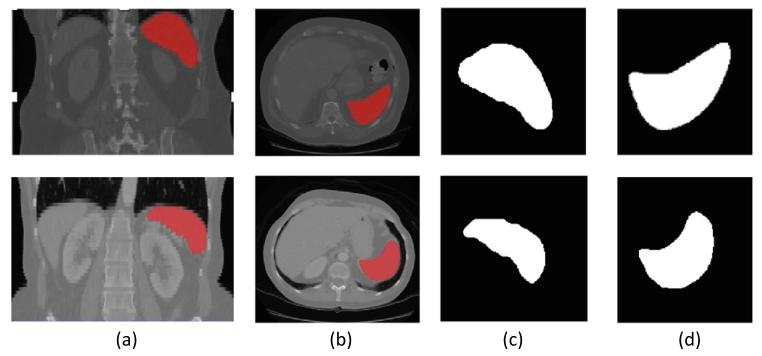
Fig. 7. Two example CT volumes (top and bottom rows) with associated ground truthspleen segmentations and the selected coronal and transverse 2D segmentation slices.(a) Coronal view of CT volume with spleen segmentation in red. (b) Transverse viewof CT volume with spleen segmentation in red. (c) Selected coronal 2D segmentationslice with largest cross-sectional area. (d) Selected transverse 2D segmentation slicewith largest cross-sectional area
圖7. 兩個示例CT體積數據(上行和下行)及其相關的真實脾臟分割結果,以及所選的冠狀位和橫斷位2D分割切片。(a)CT體積的冠狀位視圖,其中脾臟分割以紅色顯示。(b)CT體積的橫斷位視圖,其中脾臟分割以紅色顯示。(c)具有最大橫截面積的所選冠狀位2D分割切片。(d)具有最大橫截面積的所選橫斷位2D分割切片。
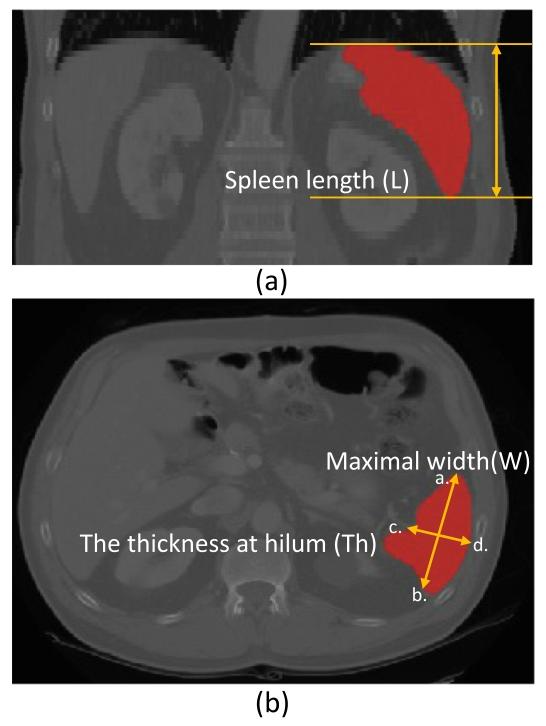
Fig. 8. Illustration of manual measurements from CT images for spleen volumeestimation. (a) Coronal view. The spleen length (L) is obtained by multiplying thespacing of the coronal plane by the number of contiguous slices that contain the spleenalong the transverse axis. (b) Transverse view. The maximal width (W) is obtained byfinding the largest diameter on any transverse slice (see distance between ab). Thethickness at hilum (Th) is determined by the thickness of the spleen at hilum andperpendicular to the spleen width (see distance between cd).
圖8. 從CT圖像中手動測量脾臟體積的示意圖。(a)冠狀位視圖。脾臟長度(L)通過將冠狀面的間距乘以沿橫軸包含脾臟的連續切片數量得出。(b)橫斷位視圖。最大寬度(W)通過在任意橫斷切片上找到最大直徑獲得(參見ab之間的距離)。脾門厚度(Th)由脾門處的脾臟厚度確定,且與脾臟寬度垂直(參見cd之間的距離)。
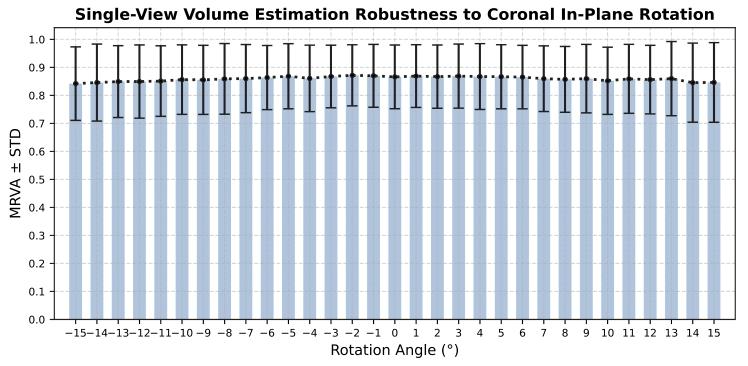
Fig. 9. Robustness of single-view volume estimation to coronal in-plane rotationalerrors.
圖9.單視角體積估算對冠狀位平面內旋轉誤差的穩健性。
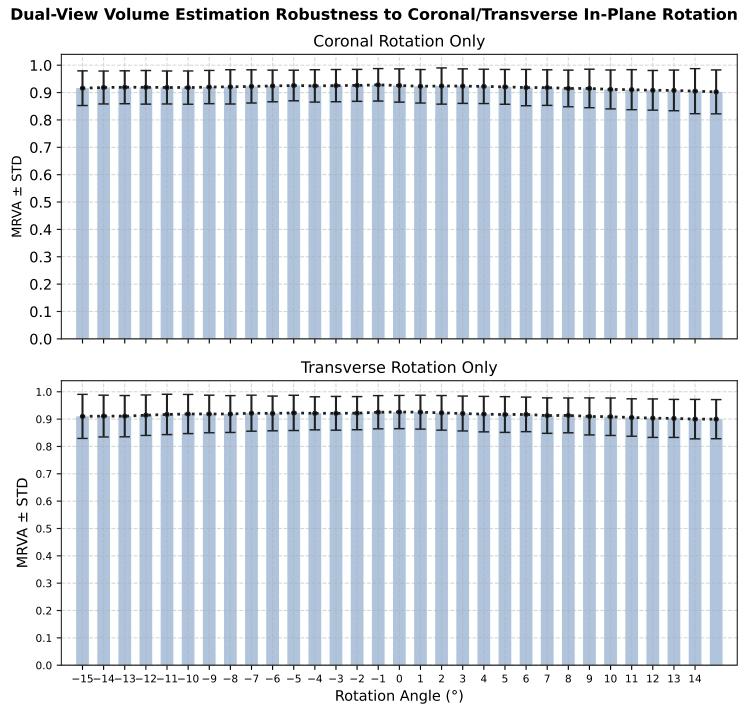
Fig. 10. Robustness of dual-view volume estimation to coronal and transverse in-planerotational errors.
圖10. 雙視角體積估算對冠狀位和橫斷位平面內旋轉誤差的穩健性。
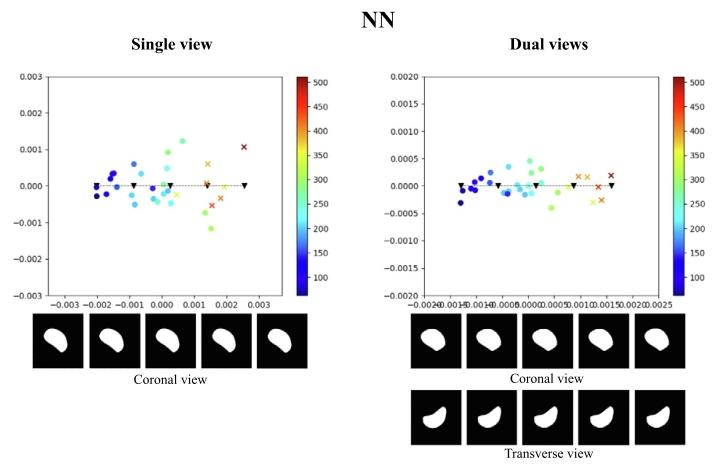
Fig. 11. Illustration of the test latent spaces of NN trained with single-view data ordual-view data. We sampled 5 points along the line of the principal axis, and decodedthe samples to spleen segmentations, as depicted below the 2D latent maps. The coloursindicate estimated spleen volume according to the colour scales shown. The dots arenormal spleen cases, and crosses are splenomegaly cases (i.e., with ground truth volumevalue greater than 314.5 mL).
圖11. 經單視角數據或雙視角數據訓練的最近鄰(NN)模型的測試集潛在空間示意圖。我們沿主軸方向采樣了5個點,并將這些樣本解碼為脾臟分割結果(如2D潛在空間圖下方所示)。顏色根據所示色標表示估算的脾臟體積。圓點代表正常脾臟病例,叉號代表脾腫大病例(即真實體積大于314.5 mL)。
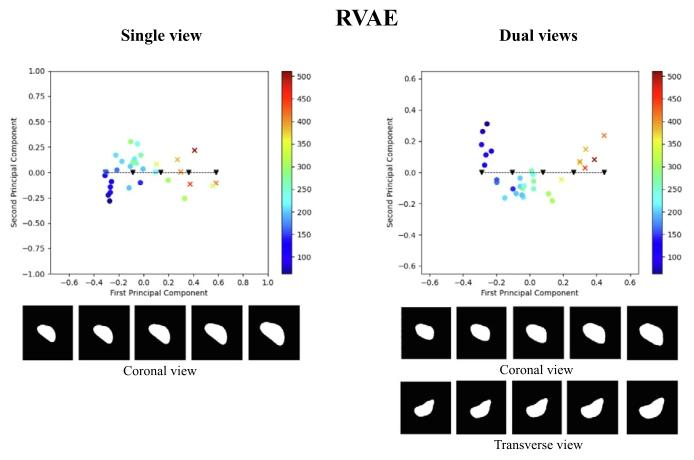
Fig. 12. Illustration of the test latent spaces of RVAE trained with single-view data ordual-view data. We sampled 5 points along the line of the principal axis, and decodedthe samples to spleen segmentations, as depicted below the 2D latent maps. The coloursindicate estimated spleen volume according to the colour scales shown. The dots arenormal spleen cases, and crosses are splenomegaly cases (i.e., with ground truth volumevalue greater than 314.5 mL)
圖12. 經單視角數據或雙視角數據訓練的端到端回歸變分自編碼器(RVAE)模型的測試集潛在空間示意圖。我們沿主軸方向采樣了5個點,并將這些樣本解碼為脾臟分割結果(如2D潛在空間圖下方所示)。顏色根據所示色標表示估算的脾臟體積。圓點代表正常脾臟病例,叉號代表脾腫大病例(即真實體積大于314.5 mL)。
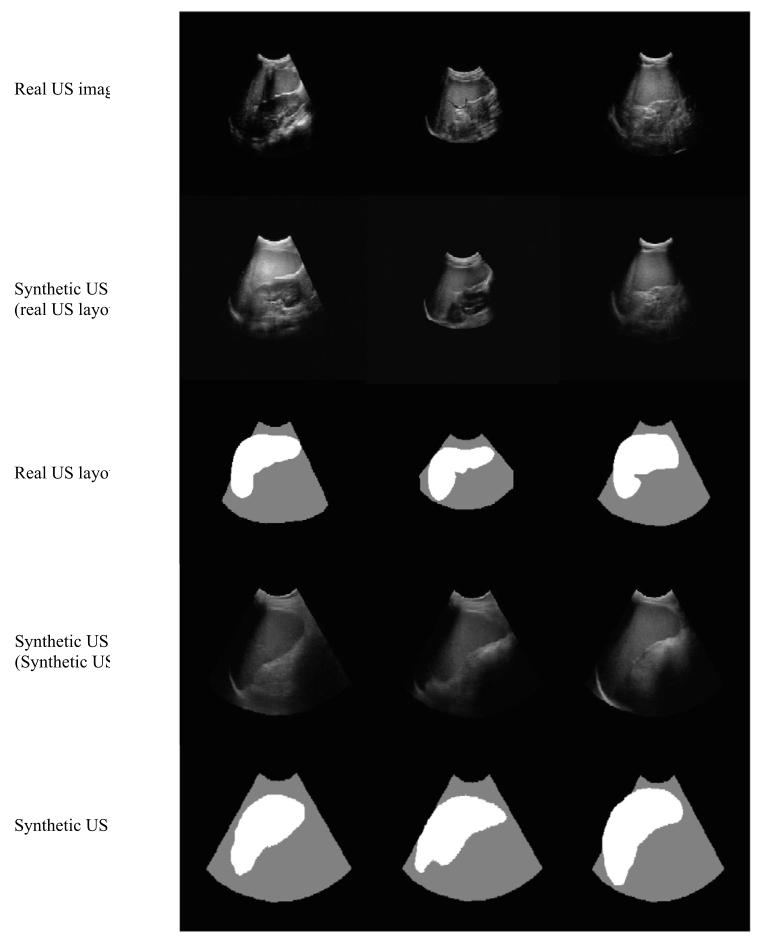
Fig. 13. Examples of real US images, synthetic US images generated from real USlayouts, and the corresponding real US layouts. Below are shown synthetic US imagesand the corresponding synthetic US layouts, which were manually created based on2D CT spleen segmentations.
圖13. 真實超聲圖像、根據真實超聲布局生成的合成超聲圖像,以及相應的真實超聲布局示例。下方展示了合成超聲圖像及相應的合成超聲布局,這些合成布局是基于2D CT脾臟分割結果手動創建的。
Table
表
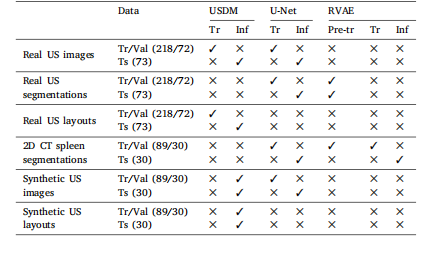
Table 1The breakdown of the data used in the experiments to validate the full volumeestimation pipeline. Tr: training. Val: validation. Ts: test. Pre-tr: pre-training. Inf:inference.
表1 ? 用于驗證完整體積估算流程的實驗數據細分。Tr:訓練;Val:驗證;Ts:測試;Pre-tr:預訓練;Inf:推理。
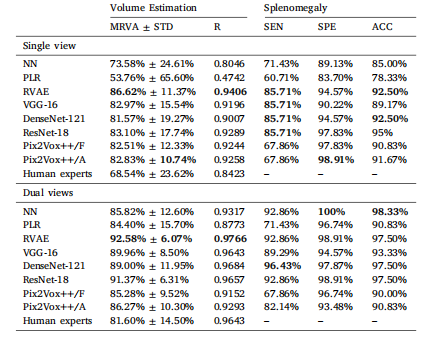
Table 2Comparison of results between NN, LR, RVAE, VGG-16, DenseNet-121, ResNet-18, andPix2Vox++ trained on coronal single-view data and dual view (coronal and transverse)data. Human Experts refers to spleen volume estimated using manual linear regression.Mean relative volume accuracy (MRVA) and standard deviation (STD). R: Pearson’scorrelation coefficient. SEN: sensitivity. SPE: specificity. ACC: accuracy. Best resultsare in bold.
表2 ? nearest neighbour(NN,最近鄰)、linear regression(LR,線性回歸)、end-to-end regression VAE(RVAE,端到端回歸變分自編碼器)、VGG-16、DenseNet-121、ResNet-18以及Pix2Vox++在冠狀位單視角數據和雙視角(冠狀位與橫斷位)數據上的訓練結果對比。“人類專家”指通過手動線性回歸估算的脾臟體積。表格中包含平均相對體積精度(MRVA)、標準差(STD)、皮爾遜相關系數(R)、靈敏度(SEN)、特異度(SPE)和準確率(ACC)。最佳結果以粗體顯示。
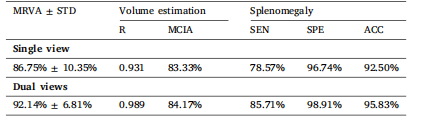
Table 3The results for model RVAE-CI. MRVA: mean relative volume accuracy. STD: standarddeviation; R: Pearson’s correlation coefficient; MCIA: mean confidence interval accuracy; SEN: sensitivity; SPE: specificity; ACC: accuracy.
表3 ? 模型RVAE-CI的結果。MRVA:平均相對體積精度;STD:標準差;R:皮爾遜相關系數;MCIA:平均置信區間精度;SEN:靈敏度;SPE:特異度;ACC:準確率。
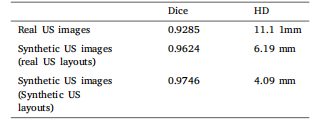
Table 4Dice scores and HD for U-Net segmentation results on the testset of real US images, as well as results specific to synthetic USimages generated using real US layouts and synthetic US layouts,respectively.
表4 ? U-Net在真實超聲圖像測試集上的分割結果(Dice系數和豪斯多夫距離),以及分別針對基于真實超聲布局生成的合成超聲圖像和合成超聲布局生成的合成超聲圖像的分割結果。
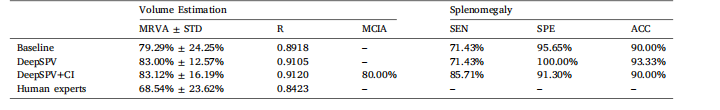
Table 5MRVA for volume estimation from single-view synthetic US images using the full DeepSPV pipeline. For comparison, we also include resultsfrom our best-performing baseline model (ResNet-18, denoted as ‘Baseline’ below) and manual estimations by human experts.
表5 ? 使用完整DeepSPV流程從單視角合成超聲圖像中進行體積估算的平均相對體積精度(MRVA)。為便于比較,表中還包含了我們性能最佳的基線模型(ResNet-18,以下記為“Baseline”)的結果以及人類專家的手動估算結果。


![《P4092 [HEOI2016/TJOI2016] 樹》](http://pic.xiahunao.cn/《P4092 [HEOI2016/TJOI2016] 樹》)

(Java實現))


