1. 問題現象
程序運行導致rt_hw_hard_fault_exception
如圖
顯示錯誤相關代碼
struct exception_stack_frame
{uint32_t r0;uint32_t r1;uint32_t r2;uint32_t r3;uint32_t r12; uint32_t lr; // 鏈接寄存器 (LR)uint32_t pc; // 程序計數器 (PC)uint32_t psr; // 程序狀態寄存器 (PSR)
};void rt_hw_hard_fault_exception(struct exception_stack_frame *contex)
{Fm24cl64bInit();
// static struct exception_stack_frame test;static CoreRegister_Type s_error_save;
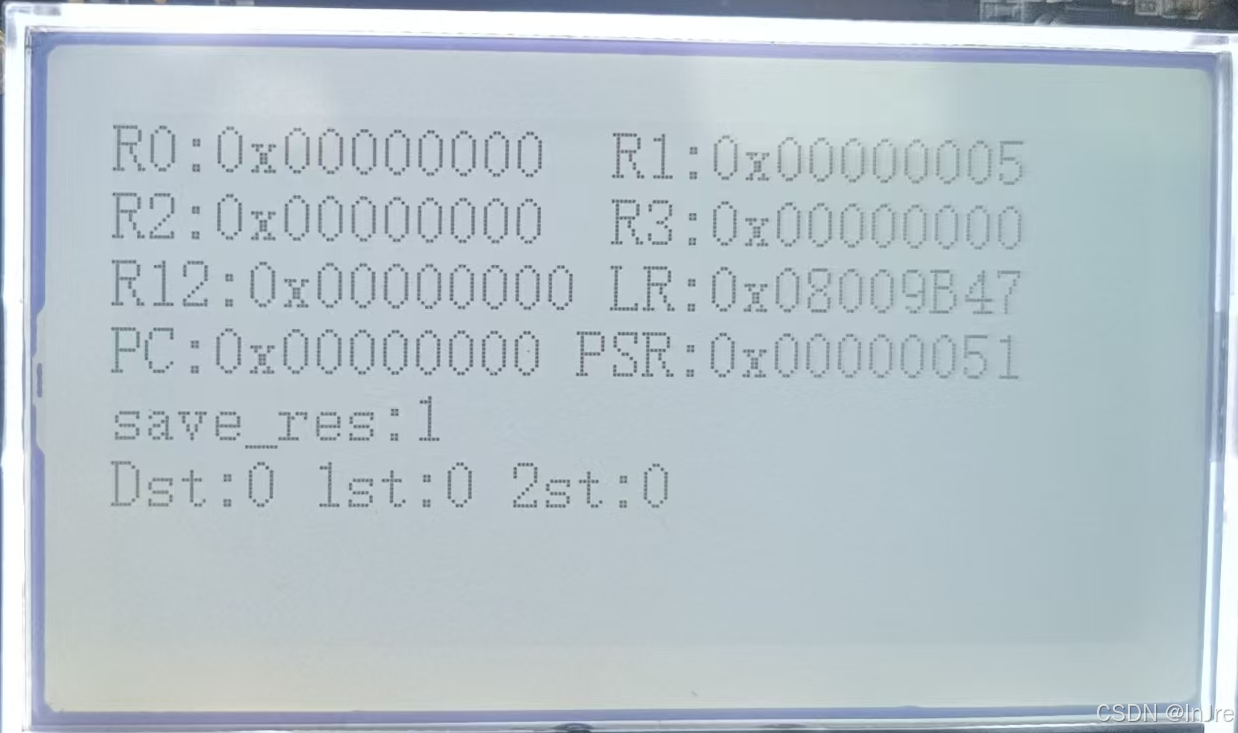
// test = *contex; s_error_save.r0 = contex->r0;s_error_save.r1 = contex->r1;s_error_save.r2 = contex->r2;s_error_save.r3 = contex->r3;s_error_save.r12 = contex->r12;s_error_save.lr = contex->lr;s_error_save.pc = contex->pc;s_error_save.psr = contex->psr;uint8_t save_res = WriteCoreRegisterToEeprom(&s_error_save);lcd_Init();lcd_Init_PowerOn();lcd_Init_BackLight(1);lcd_BufferClear();lcd_BufferPrint(0, 0, 16, "R0:0x%08X R1:0x%08X", s_error_save.r0, s_error_save.r1);lcd_BufferPrint(0, 2, 16, "R2:0x%08X R3:0x%08X", s_error_save.r2, s_error_save.r3);lcd_BufferPrint(0, 4, 16, "R12:0x%08X LR:0x%08X", s_error_save.r12, s_error_save.lr);lcd_BufferPrint(0, 6, 16, "PC:0x%08X PSR:0x%08X", s_error_save.pc, s_error_save.psr);lcd_BufferPrint(0, 8, 16, "save_res:%d", save_res);lcd_BufferPrint(0, 10, 16, "Dst:%d 1st:%d 2st:%d", msg.MsgDstId, msg.FirstSubId, msg.SecondSubId);lcd_ScreenRefresh();while(1);
}
2. 問題分析
在ARM Cortex-M架構中,LR (Link Register, R14) 的值在HardFault或其他異常發生時,對追溯問題根源非常關鍵。
LR—保存函數返回地址
3. 問題追溯
1. 定位觸發HardFault的代碼位置
通過 LR:0x08009B47 找到對應的代碼位置
使用調試器(如ST-Link + IDE)直接跳轉到該地址。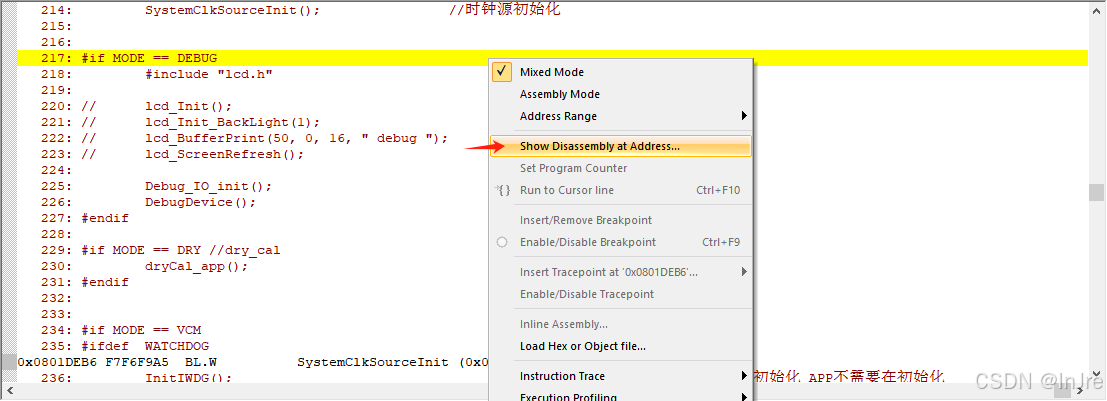
??
2. 分析LR地址附近的代碼
常見觸發HardFault的操作:
- 訪問非法地址(野指針、數組越界)。
- 未對齊的內存訪問(如對非4字節對齊地址執行LDR)。
- 堆棧溢出(檢查線程棧大小是否足夠)。
- 錯誤的函數指針調用(如跳轉到無效地址)
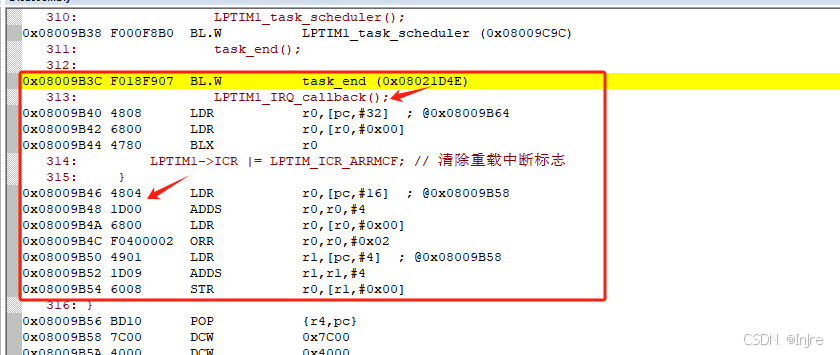
這里的LPTIM1_IRQ_callback是個空指針,最終導致硬件錯誤。


量子計算對密碼學的影響)

(幫你生成 模塊劃分+頁面+表設計、狀態機、工作流、ER模型))


功能詳解)


)

