文章目錄
- 1.官網下載安裝 prometheus和grafana
- 1.promethus
- 2.grafana
- 2. 搭建springcloudalibaba集成prometheus、grafana
- 1. 引入依賴,springboot3.2之后引入如下
- 2. 在yml文件配置監控端點暴露配置
- 3. 在當前啟動的應用代碼中添加,在prometheus顯示的時候附加當前應用名稱
- 4.訪問微服務暴露的prometheus端點
- 5. 修改nacos注冊中心配置文件,暴露prometheus監控點,重啟nacos server
- 6. 修改prometheus.yml配置文件如下:
- 7. 在prometheus上查看暴露端點
- 8. 在grafana上導入數據源,來自prometheus server的地址
- 9. 配置nacos server監控
1.官網下載安裝 prometheus和grafana
1.promethus
官網:https://prometheus.io/
1.下載windows版本安裝包
2.雙擊啟動
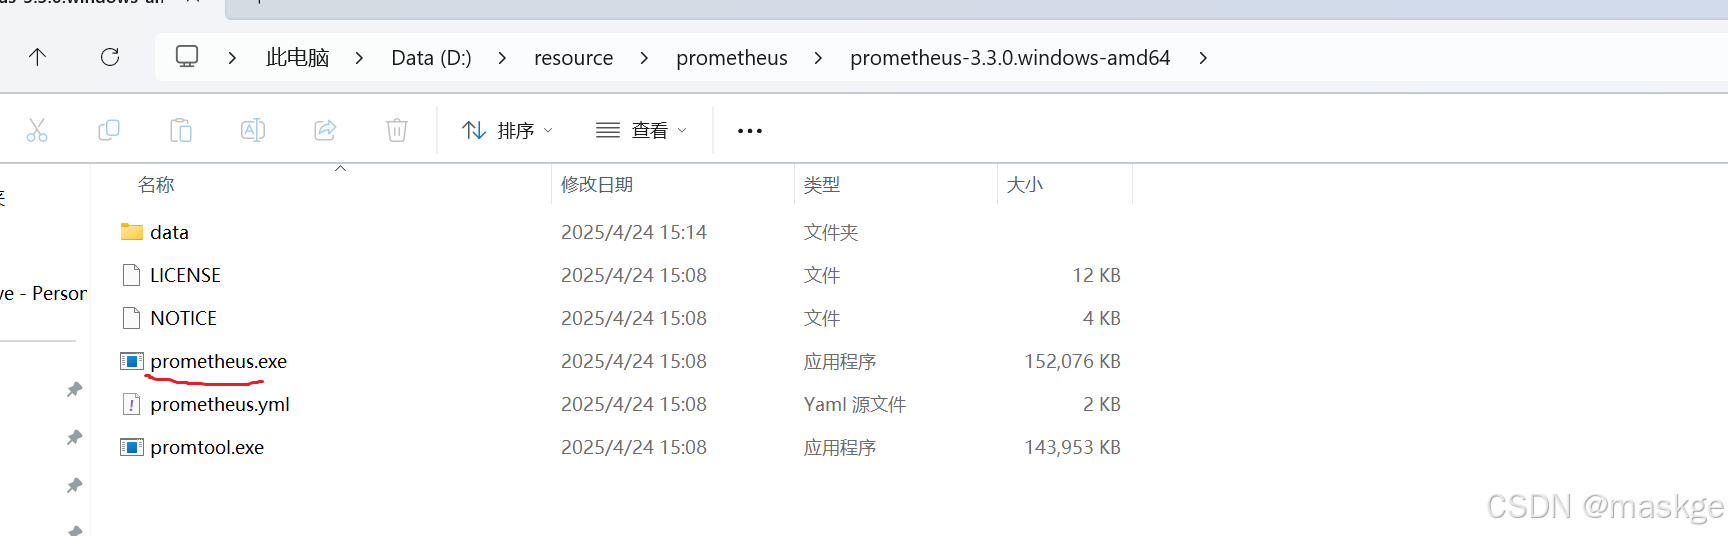
3.訪問地址
http://localhost:9090
2.grafana
官網:https://grafana.com/
1.下載windows版本安裝包
2.啟動 ,默認windows安裝完成自動啟動
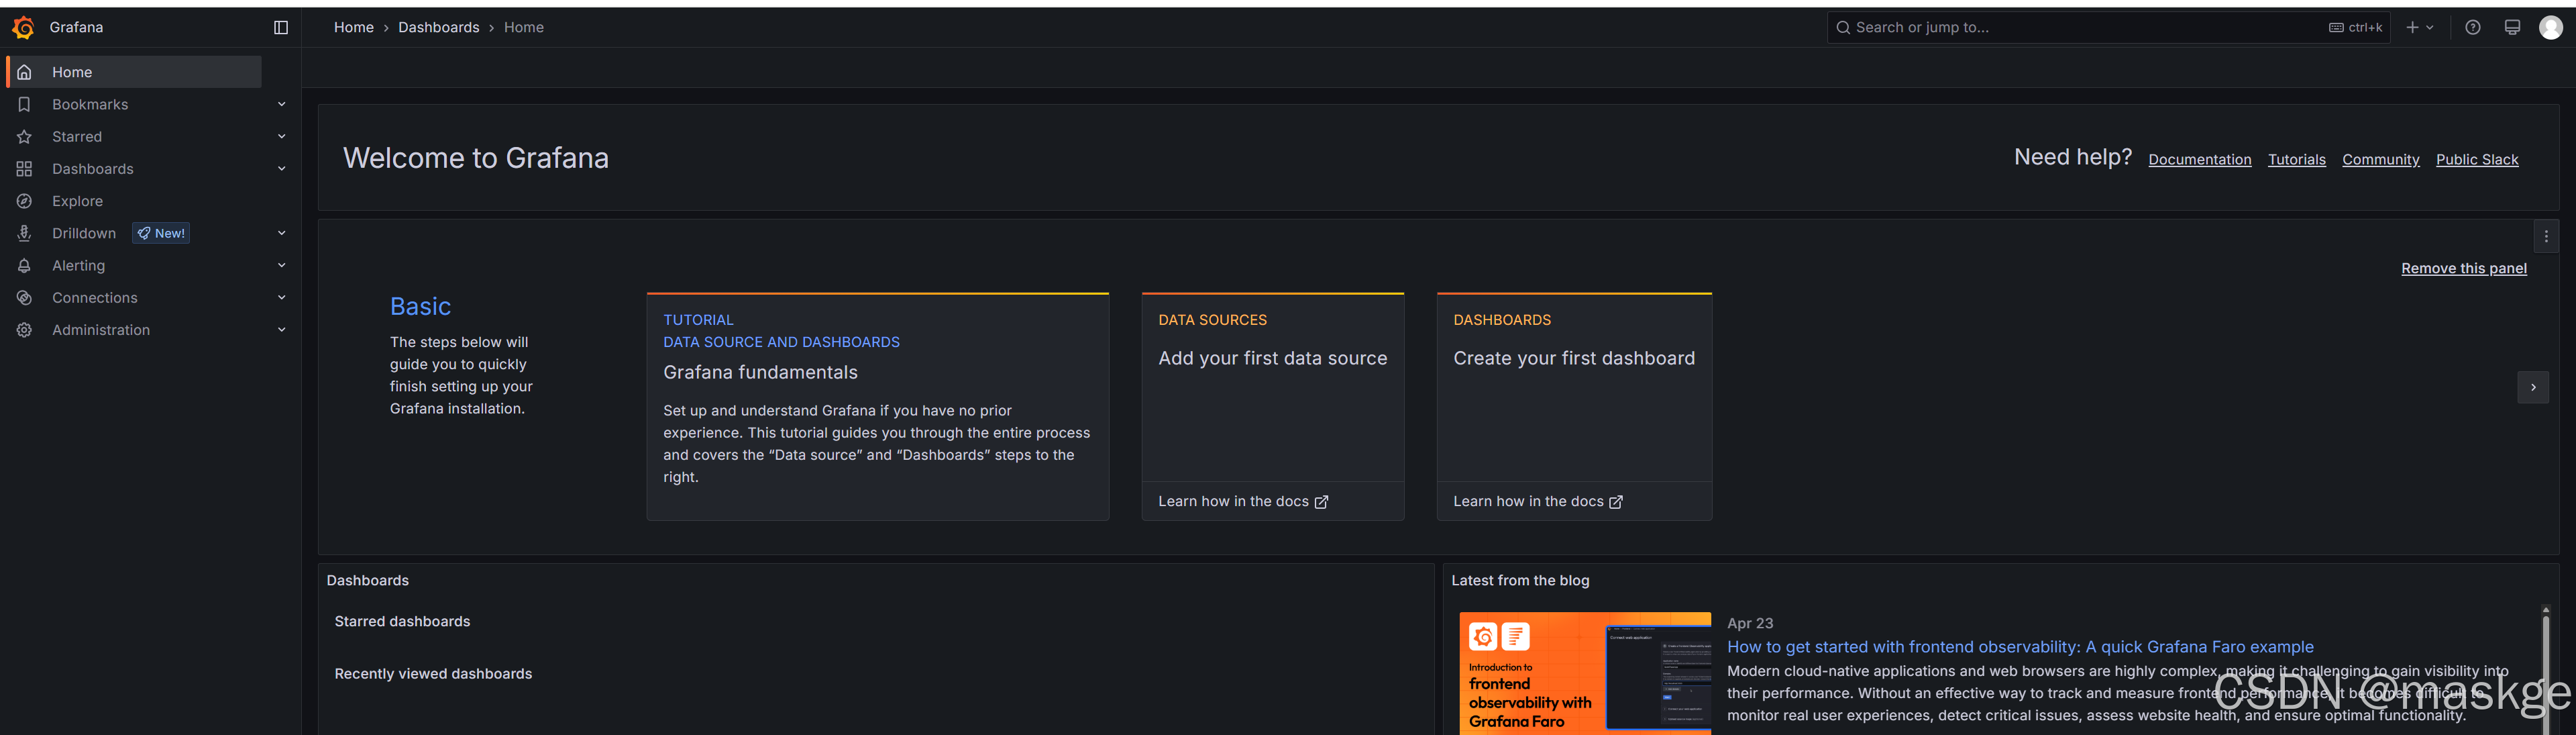
3.訪問地址
http://localhost:3000/
默認第一次登錄賬戶 admin admin,需要更改密碼
更改之后登錄賬戶:admin admin123
默認登錄首頁如下:
2. 搭建springcloudalibaba集成prometheus、grafana
1. 引入依賴,springboot3.2之后引入如下
<dependency><groupId>io.micrometer</groupId><artifactId>micrometer-registry-prometheus-simpleclient</artifactId><version>1.13.6</version></dependency><!--暴露指標數據端點--><dependency><groupId>org.springframework.boot</groupId><artifactId>spring-boot-starter-actuator</artifactId></dependency>
springboot3.2之前引入如下
<!--暴露指標數據端點--><dependency><groupId>org.springframework.boot</groupId><artifactId>spring-boot-starter-actuator</artifactId></dependency><dependency><groupId>io.micrometer</groupId><artifactId>micrometer-registry-prometheus</artifactId><version>1.14.5</version></dependency>
2. 在yml文件配置監控端點暴露配置
management:endpoints:web:exposure:include: "*"health:show-details: always #暴露所有端點信息enabled-by-default: trueendpoint:prometheus:enabled: trueprometheus:metrics:export:enabled: true3. 在當前啟動的應用代碼中添加,在prometheus顯示的時候附加當前應用名稱
@EnableFeignClients
@SpringBootApplication
@EnableDiscoveryClient
public class UserApplication {public static void main(String[] args) {SpringApplication.run(UserApplication.class, args);}/***在prometheus顯示的時候附加當前應用名* @param applicationName* @return*/@BeanMeterRegistryCustomizer<MeterRegistry> configurer(@Value("${spring.application.name}") String applicationName) {return (registry) -> registry.config().commonTags("application", applicationName);}
}
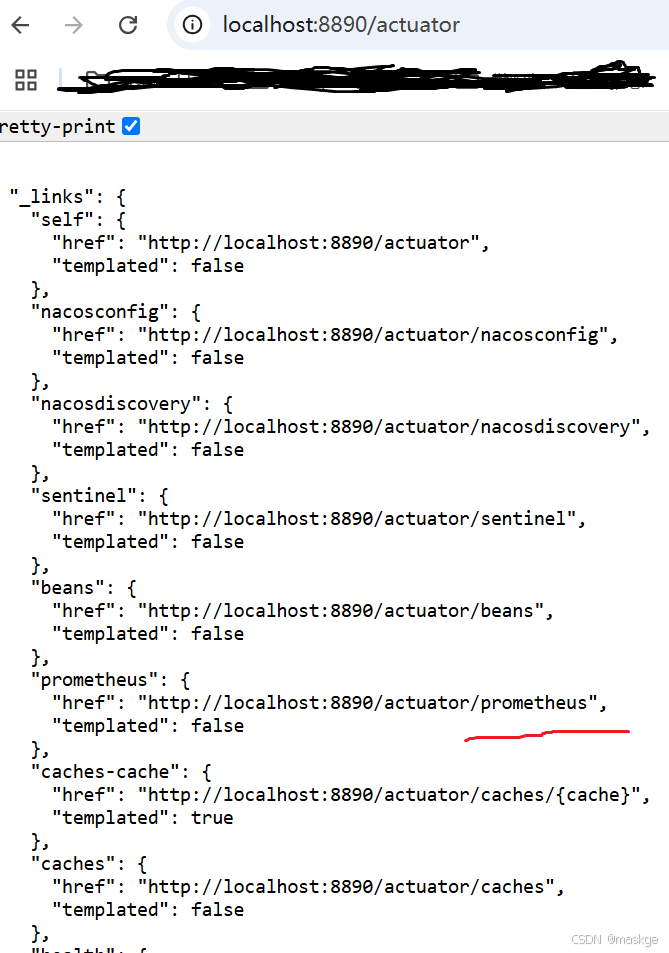
4.訪問微服務暴露的prometheus端點
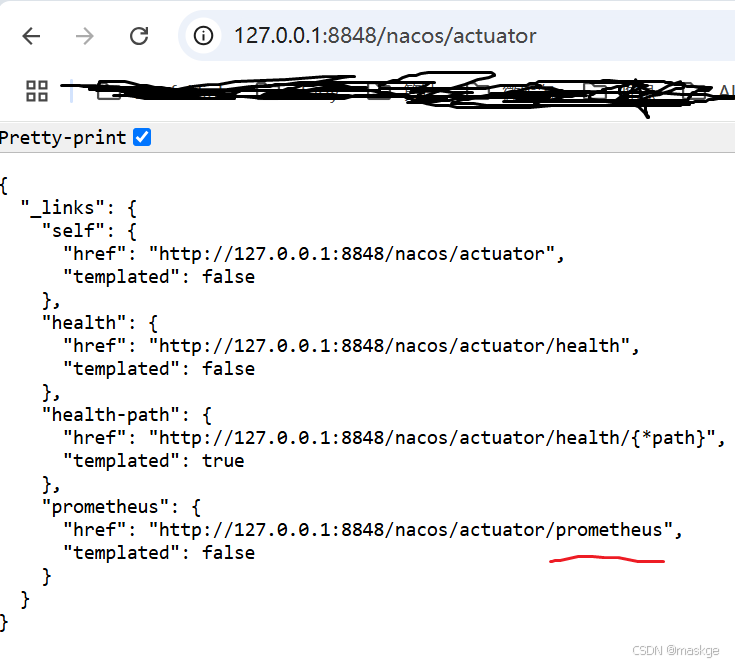
5. 修改nacos注冊中心配置文件,暴露prometheus監控點,重啟nacos server
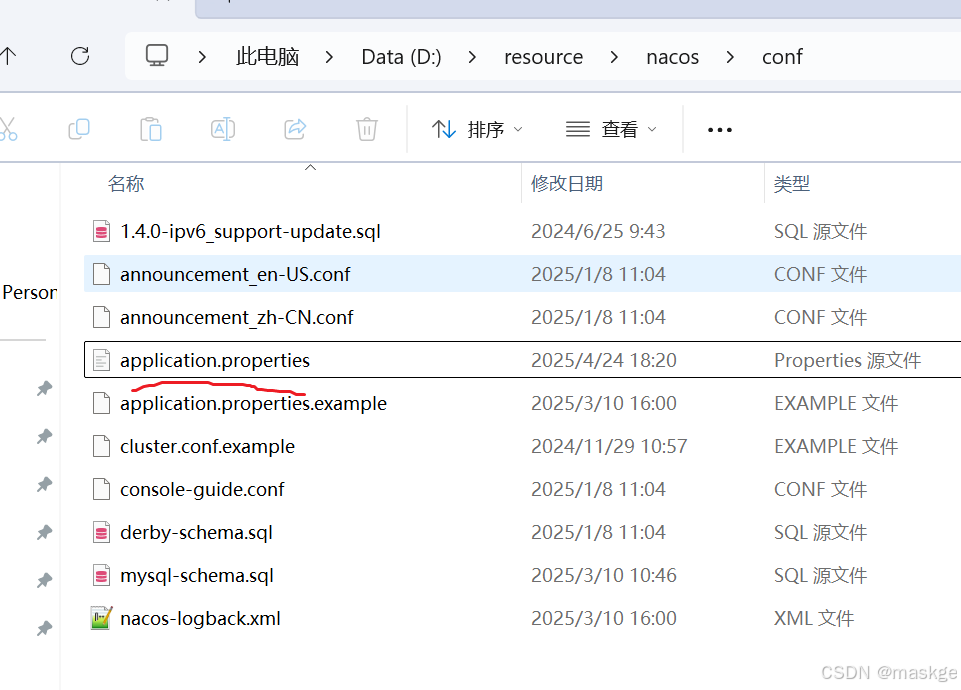
修改nacos注冊中心配置文件,暴露prometheus監控點,重啟nacos server
management.endpoints.web.exposure.include=*   #打開prometheus暴露點
nacos.prometheus.metrics.enabled=true  #開啟nacos支持prometheus
訪問nacos 暴露端點:
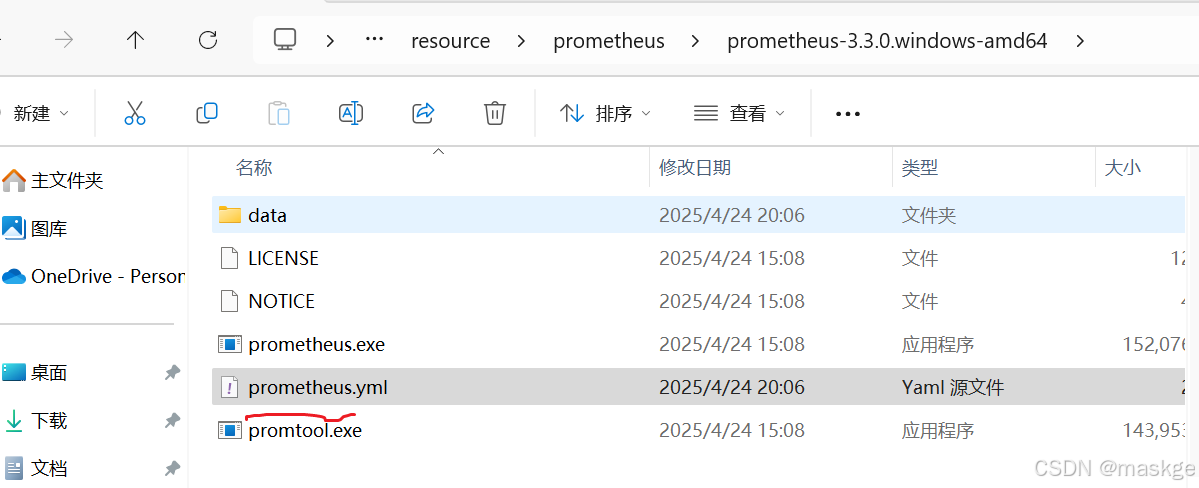
6. 修改prometheus.yml配置文件如下:
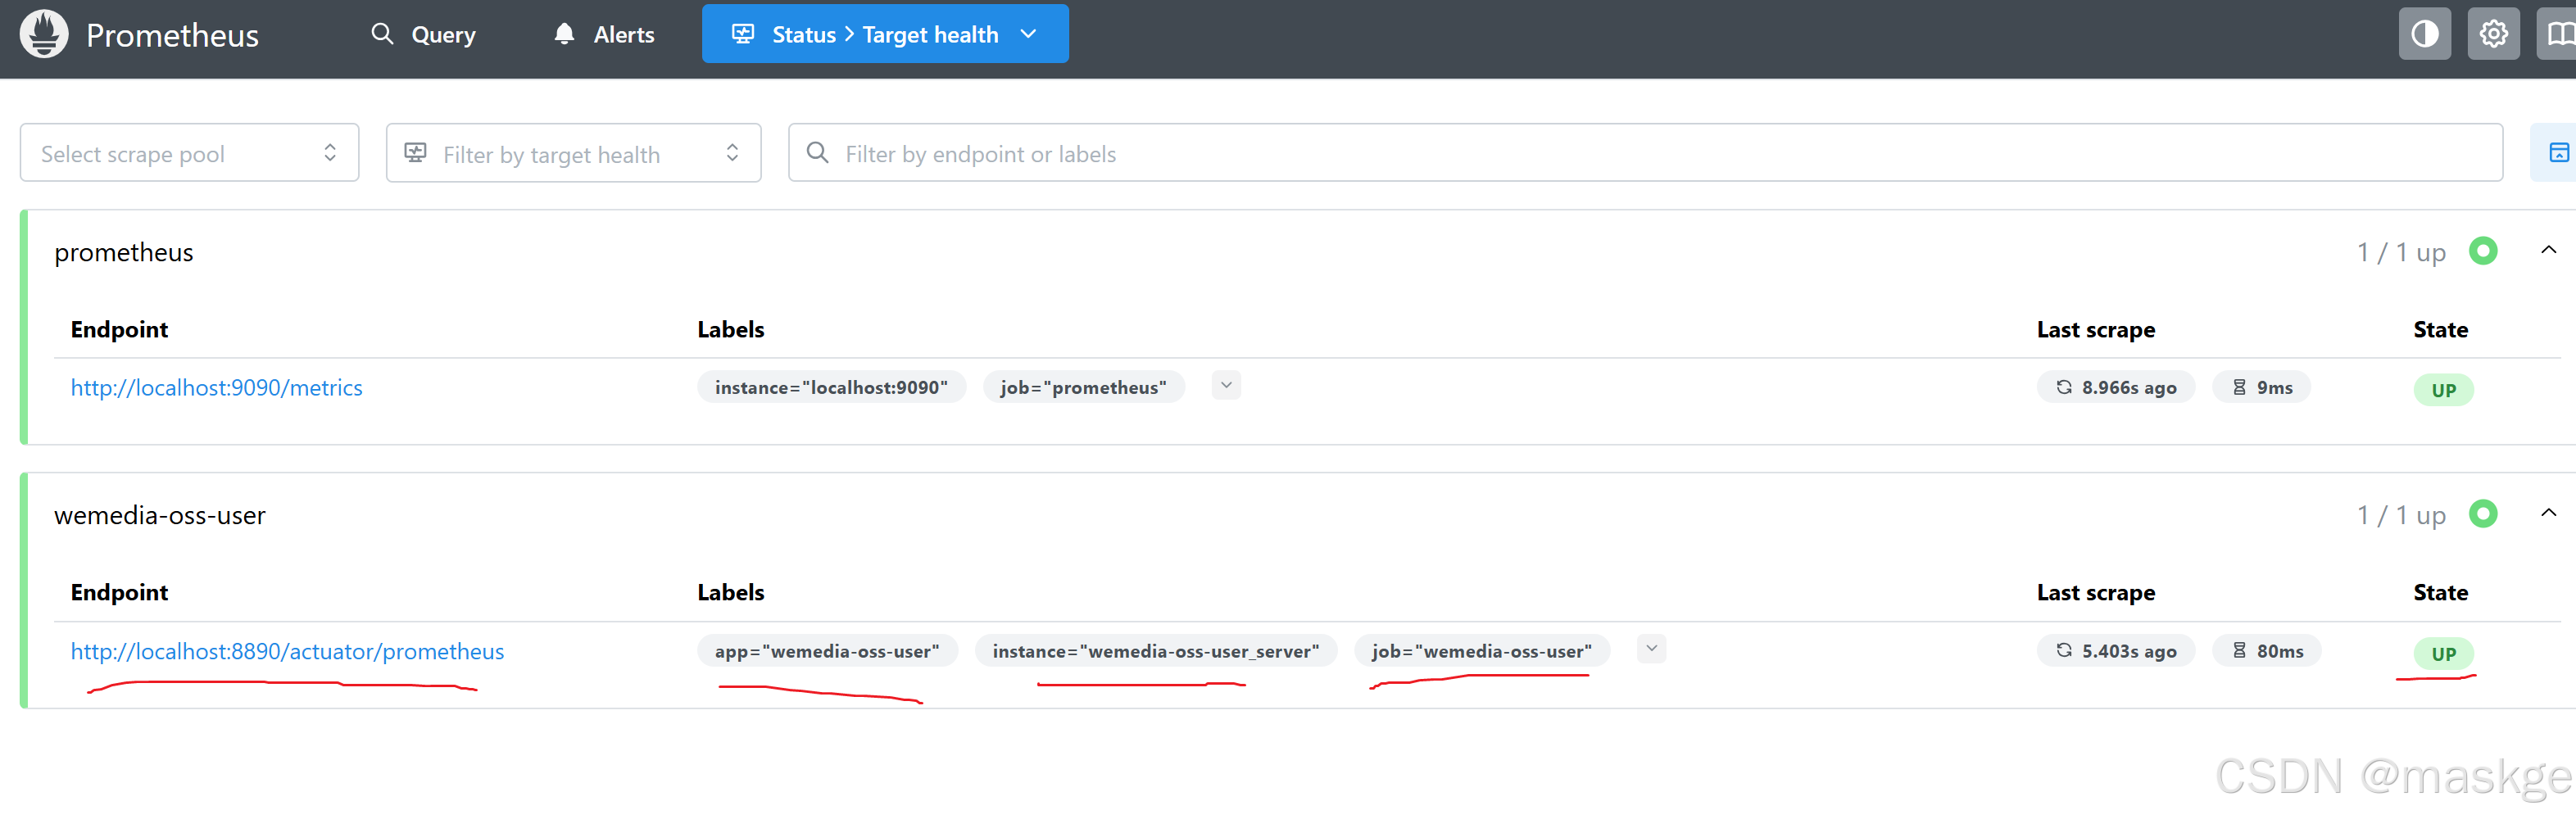
scrape_configs:# The job name is added as a label `job=<job_name>` to any timeseries scraped from this config.- job_name: "prometheus" #配置抓取任務的名稱# metrics_path defaults to '/metrics'# scheme defaults to 'http'.static_configs:- targets: ["localhost:9090"] #靜態目標列表,指定Prometheus自己#以下內容為springboot應用配置 - job_name: "wemedia-oss-user" #配置抓取任務的名稱 scrape_interval: 5s #間隔5秒拉取微服務總數據metrics_path: '/actuator/prometheus' #設置微服務給prometheus暴露的端點static_configs:- targets: ["localhost:8890"] #指定微服務的地址 labels: #自定義的額外標簽app: "wemedia-oss-user"instance: "wemedia-oss-user_server" #添加一個自定義標簽,標記目標實例7. 在prometheus上查看暴露端點
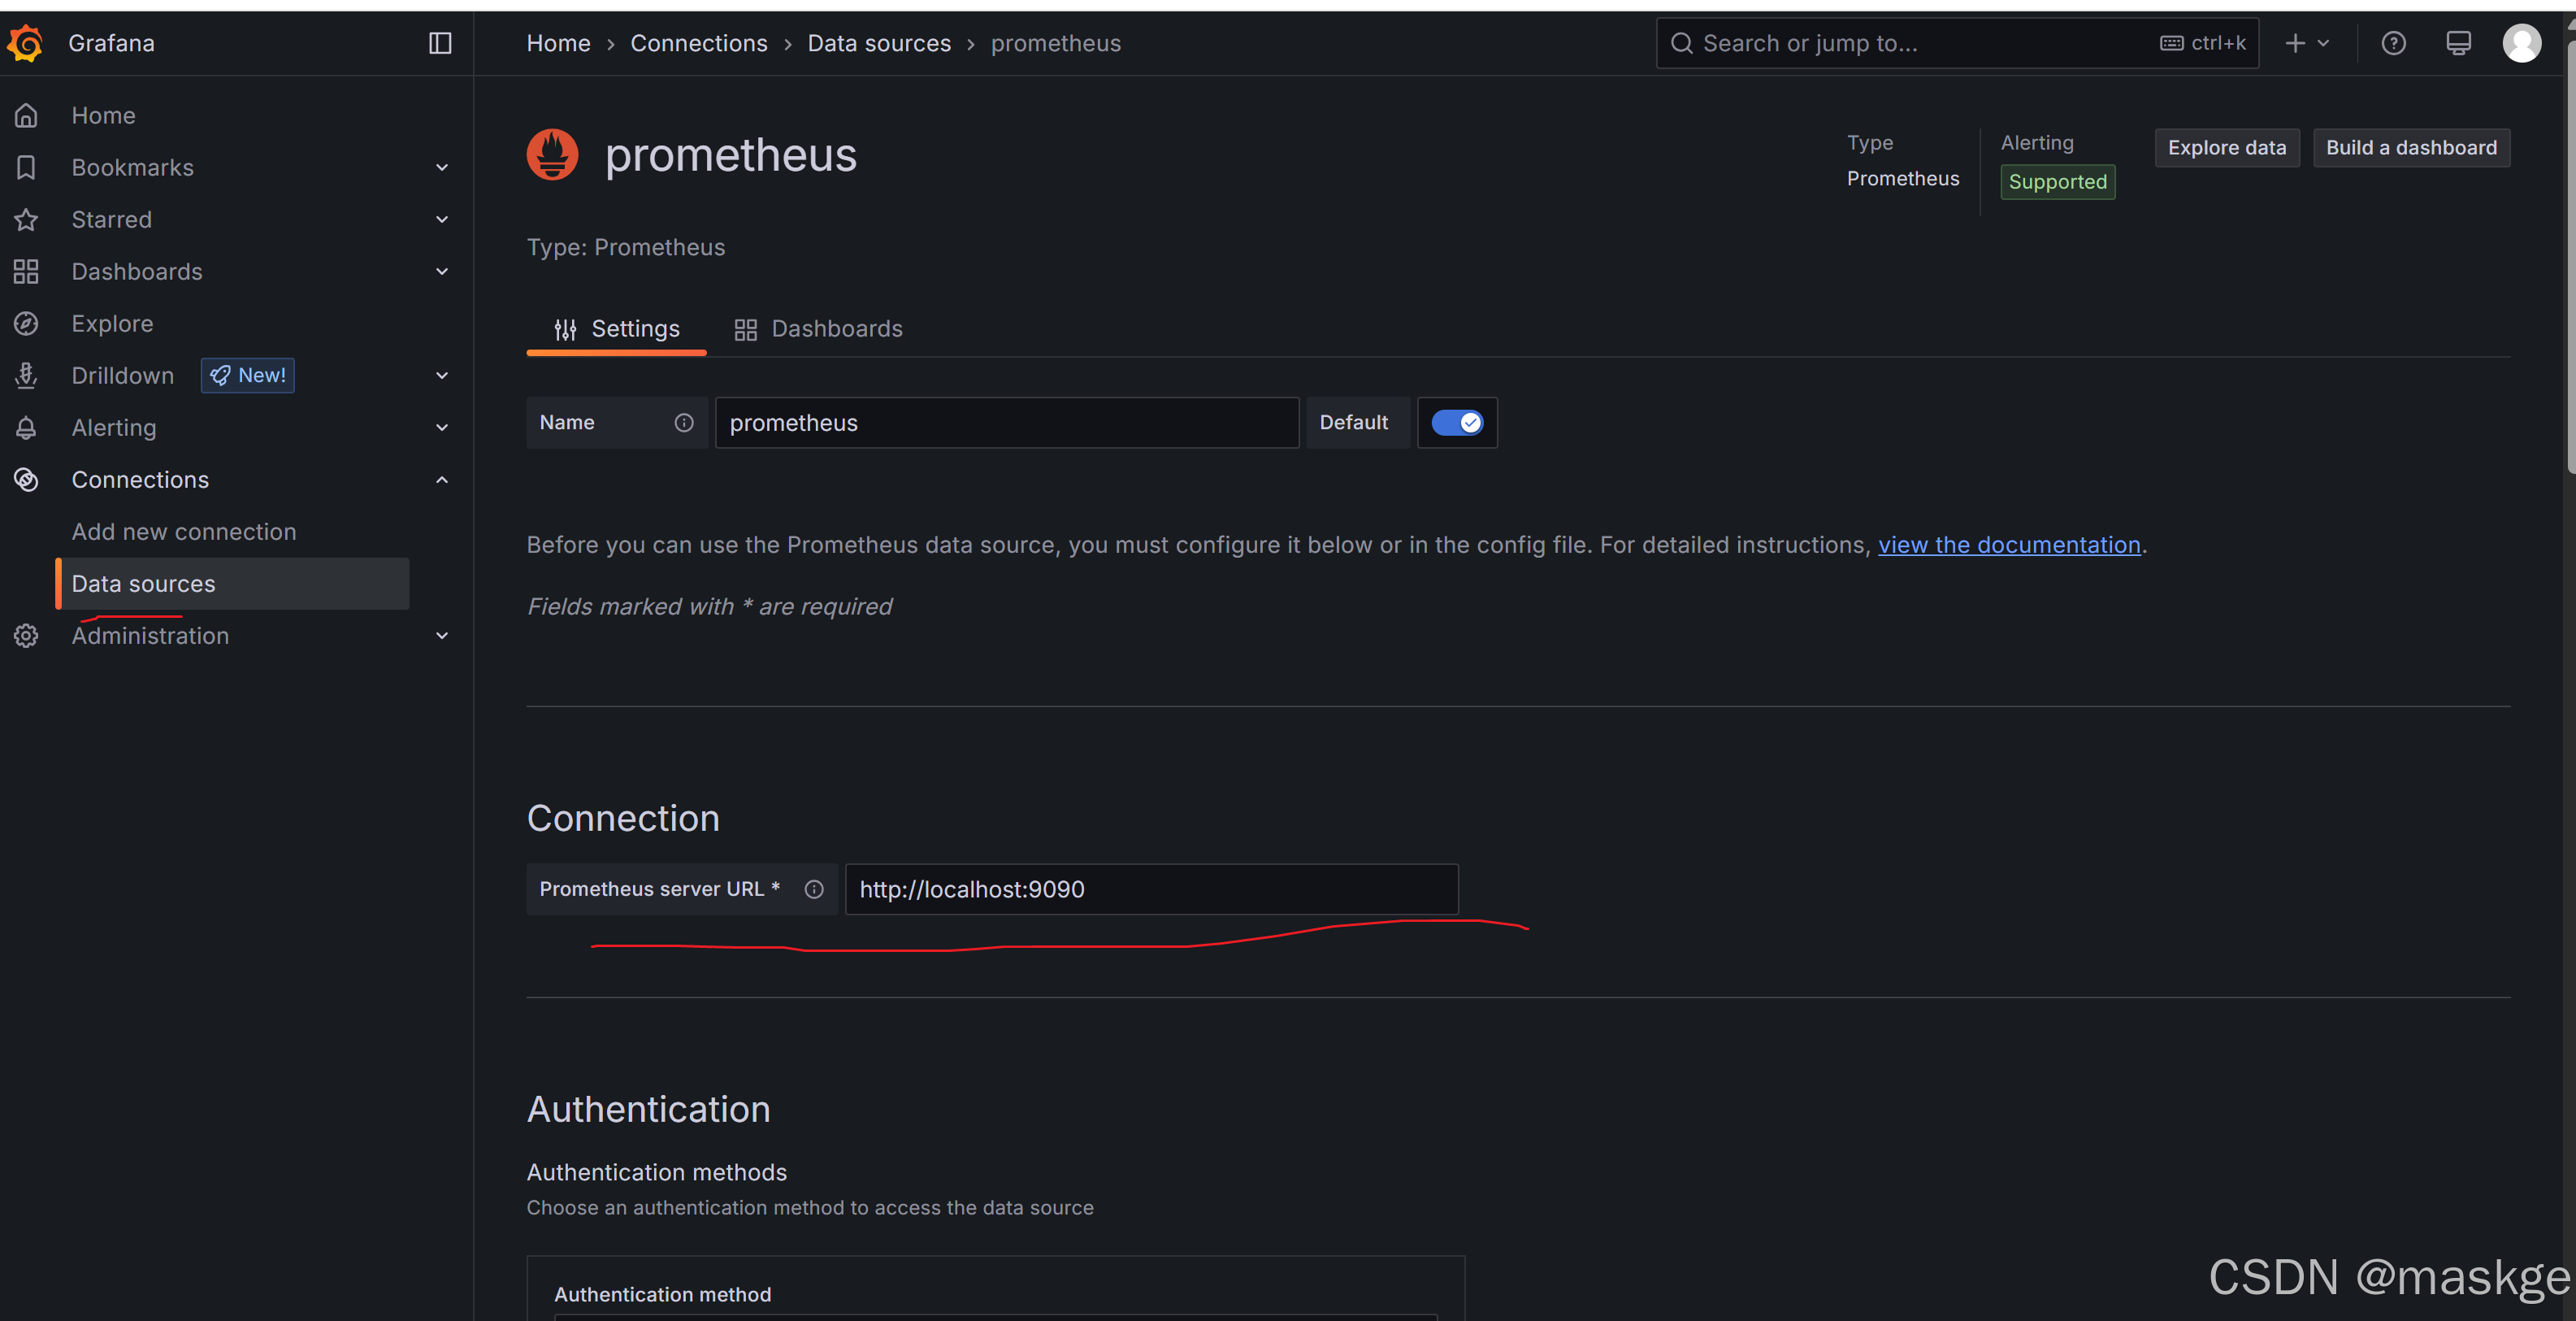
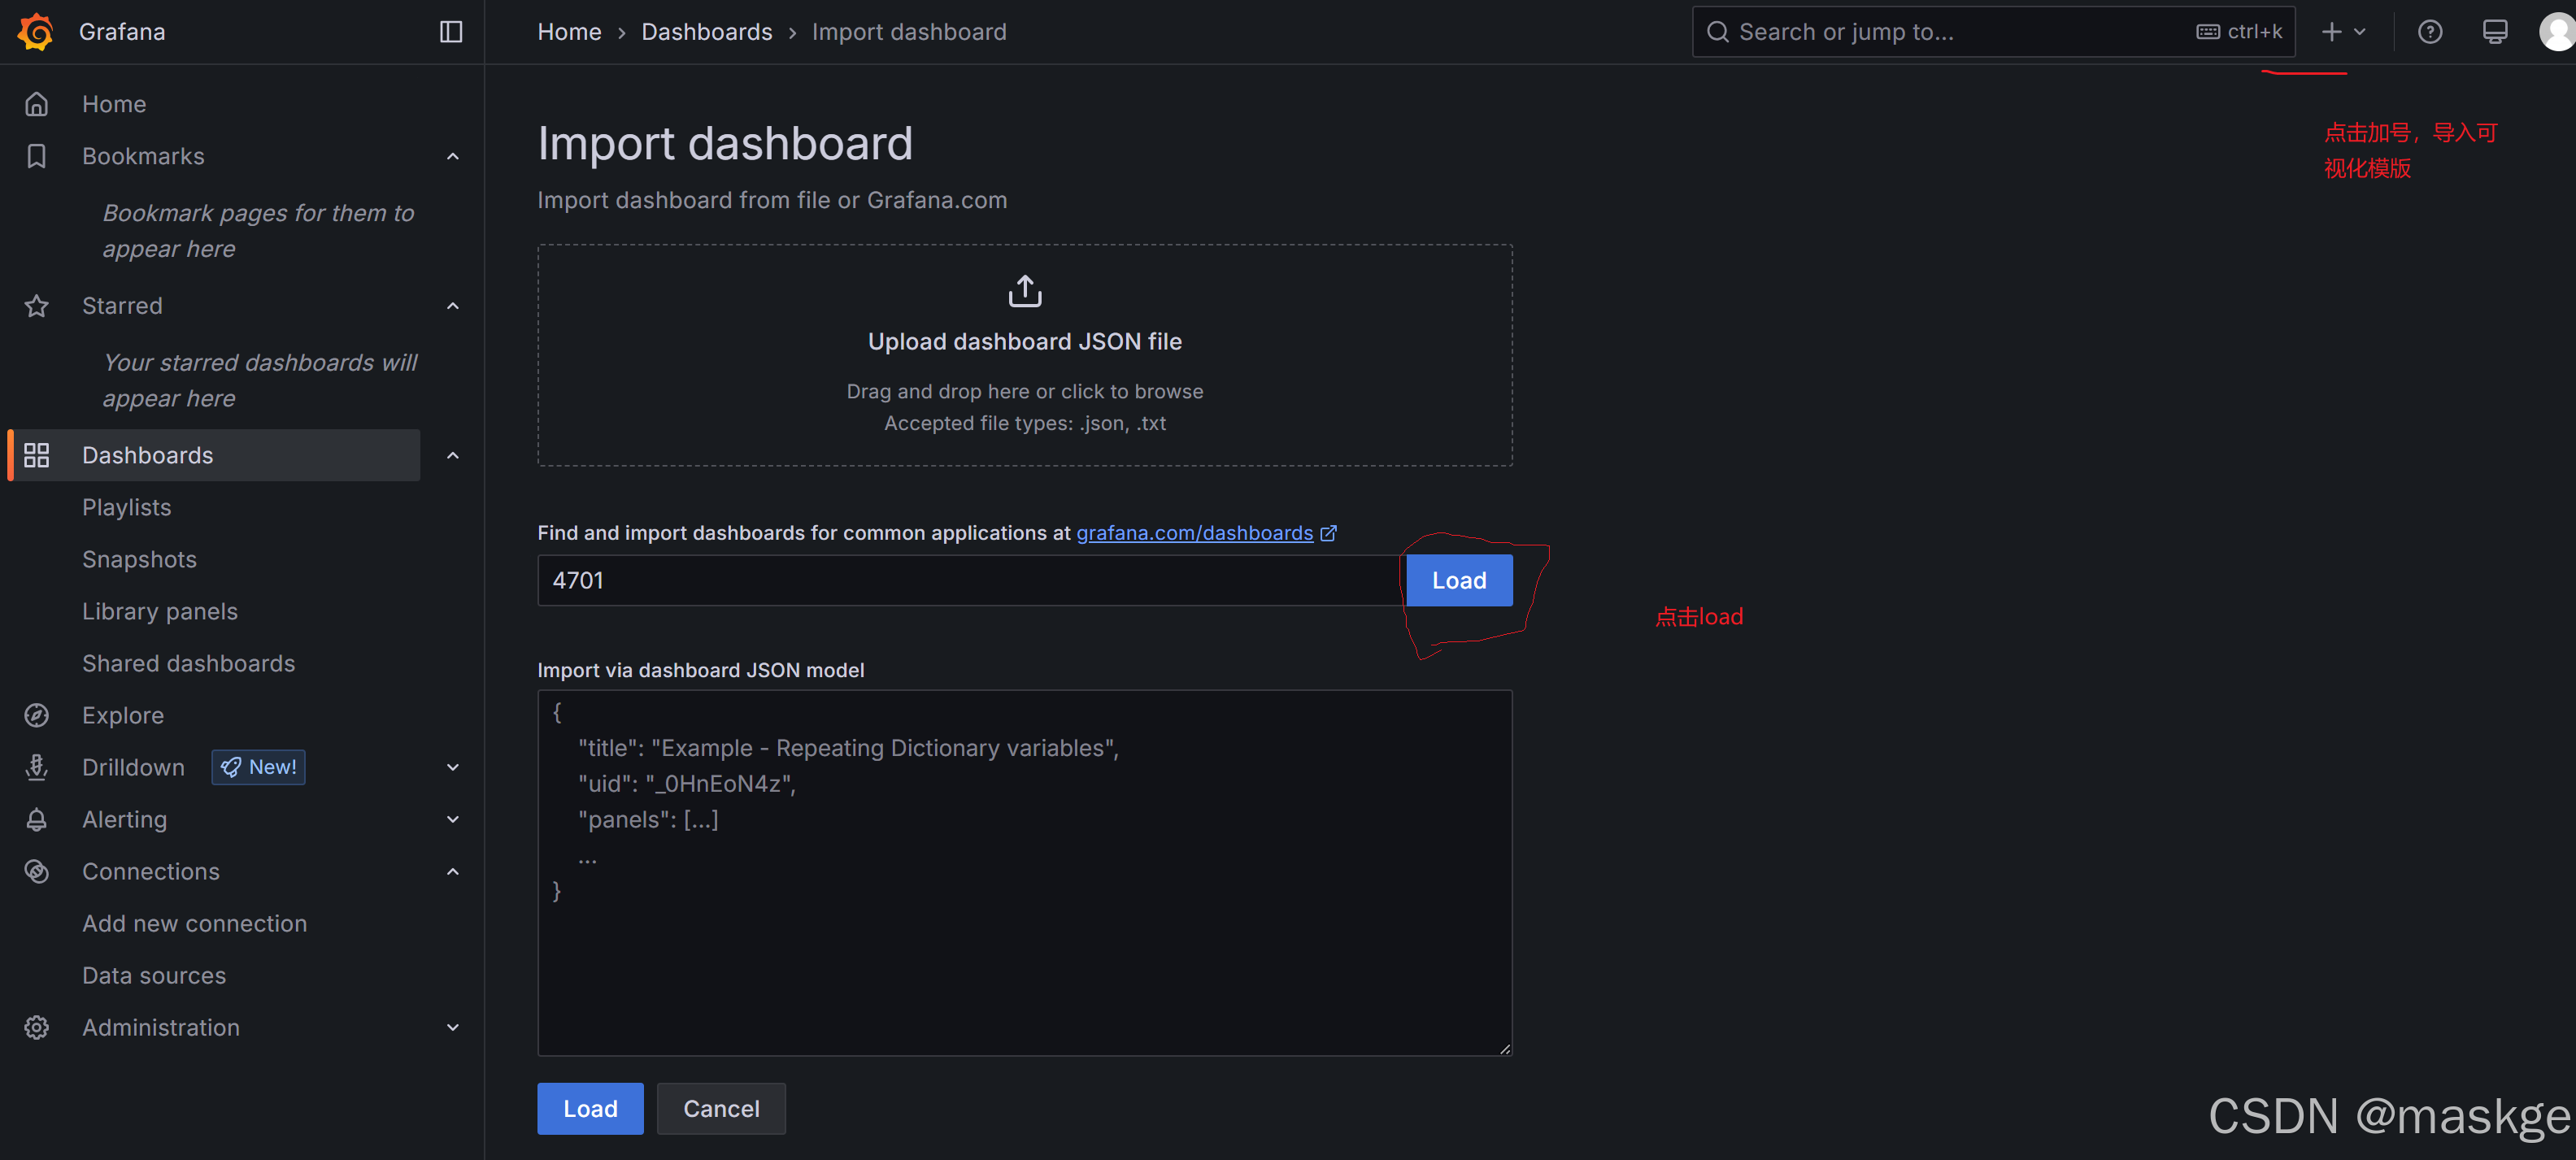
8. 在grafana上導入數據源,來自prometheus server的地址
導入jvm(micrometer)可視化看板
接著出現如下界面:
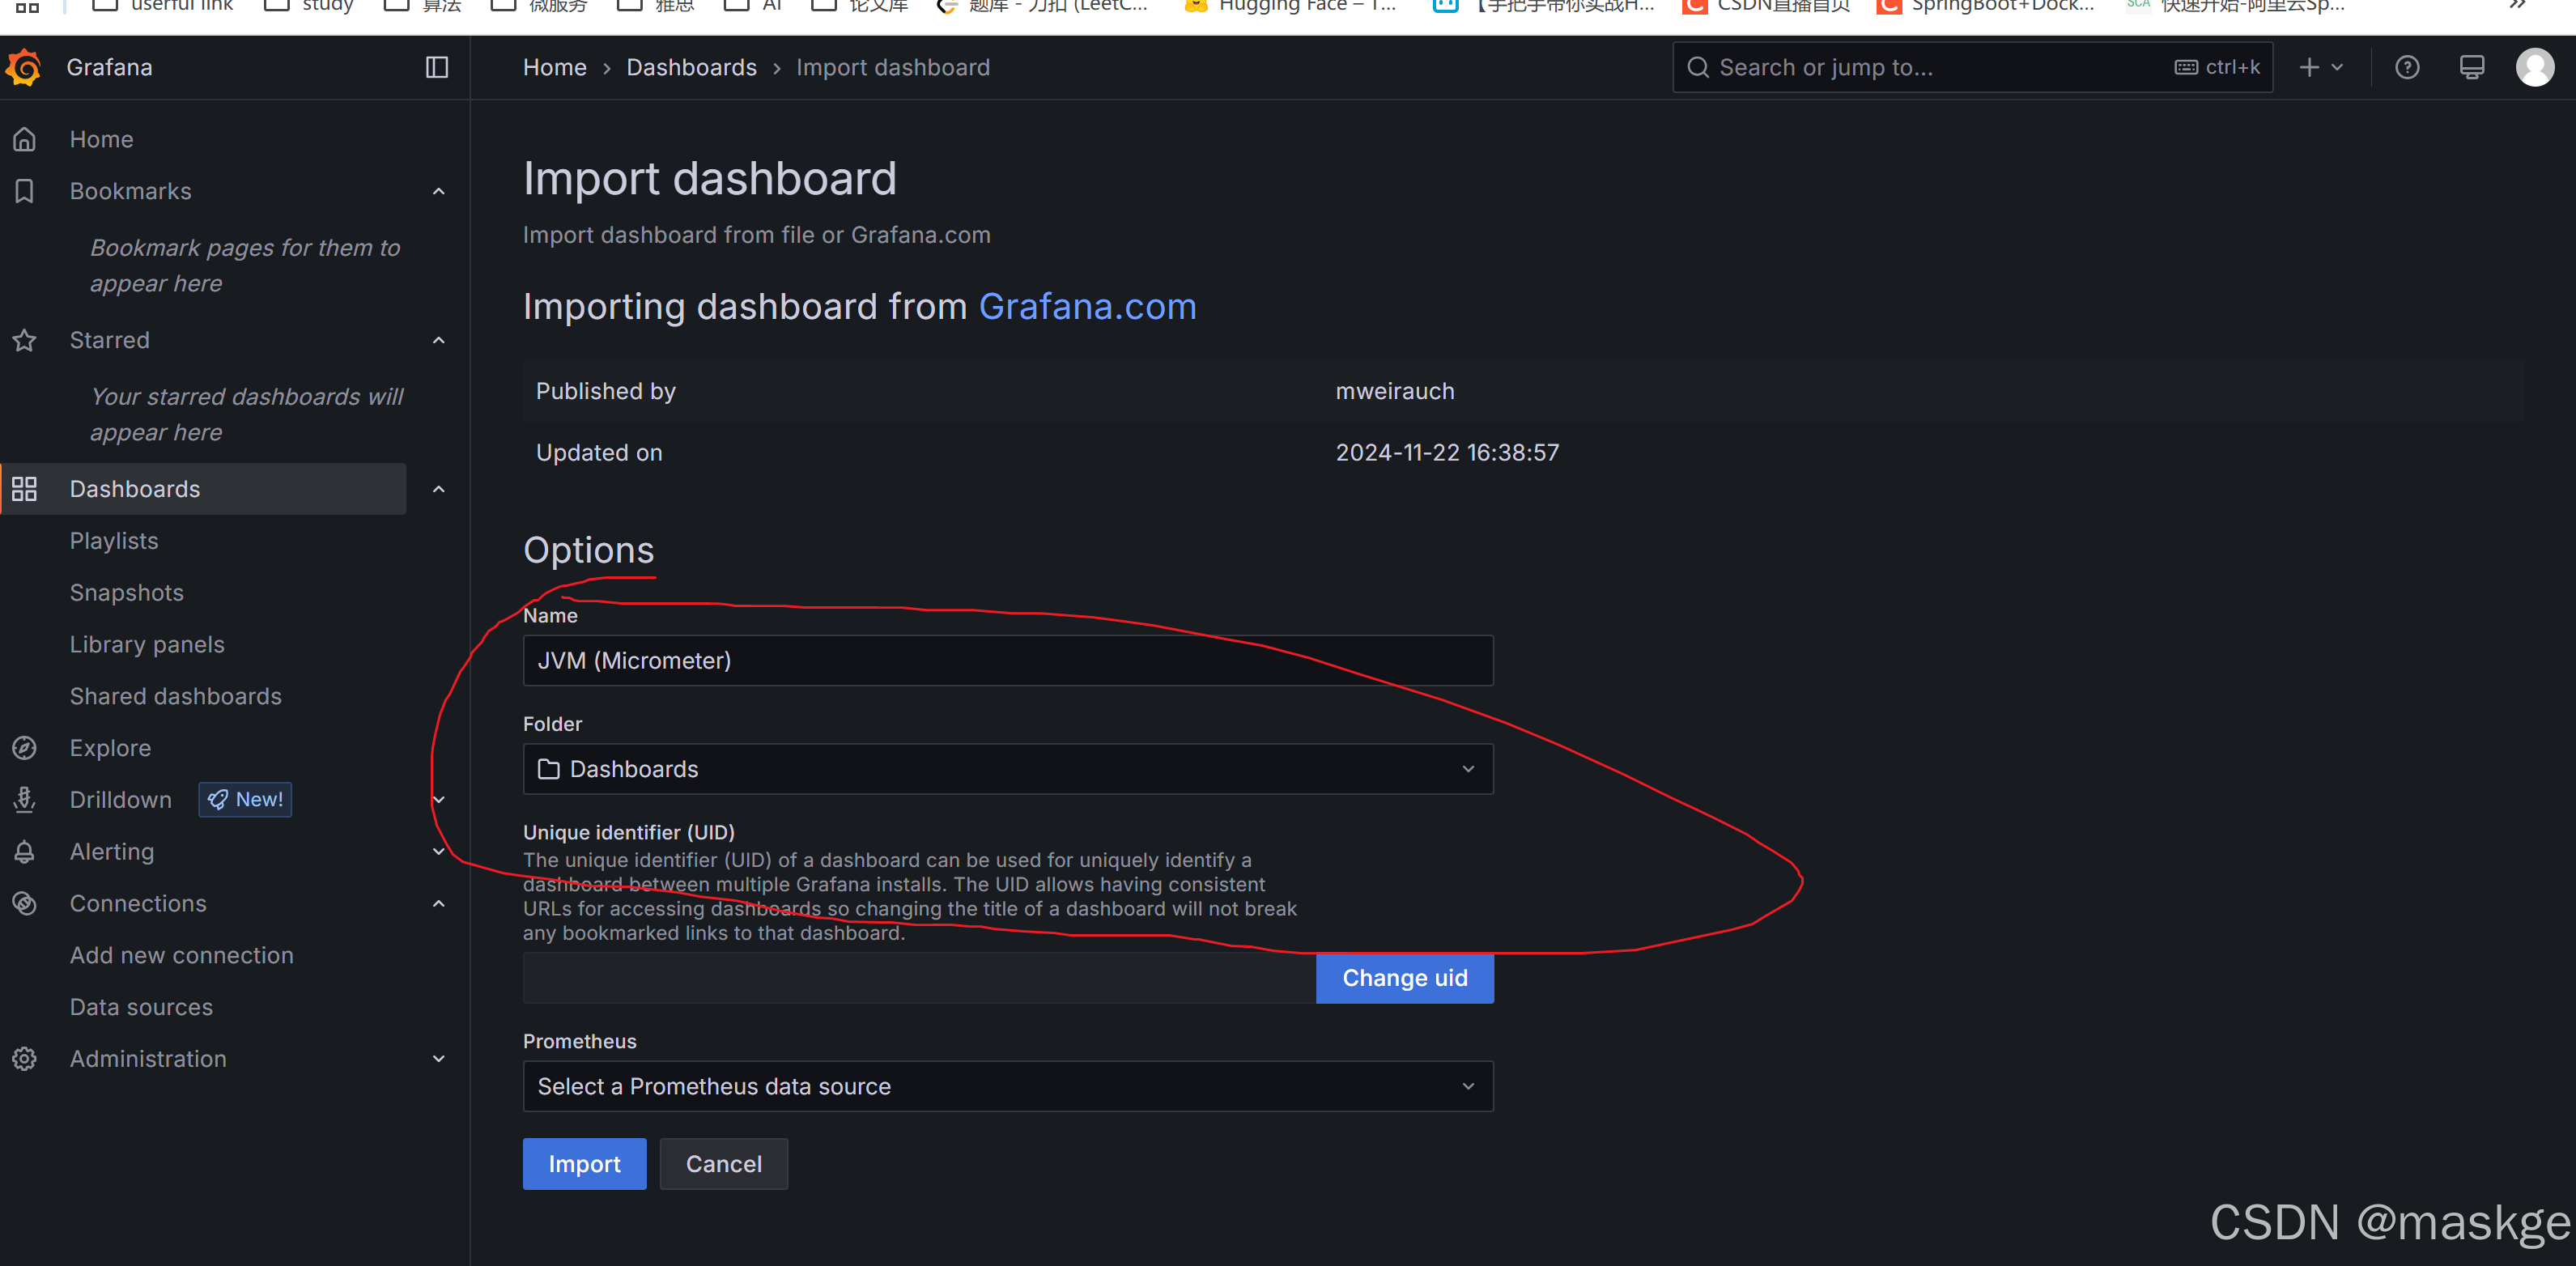
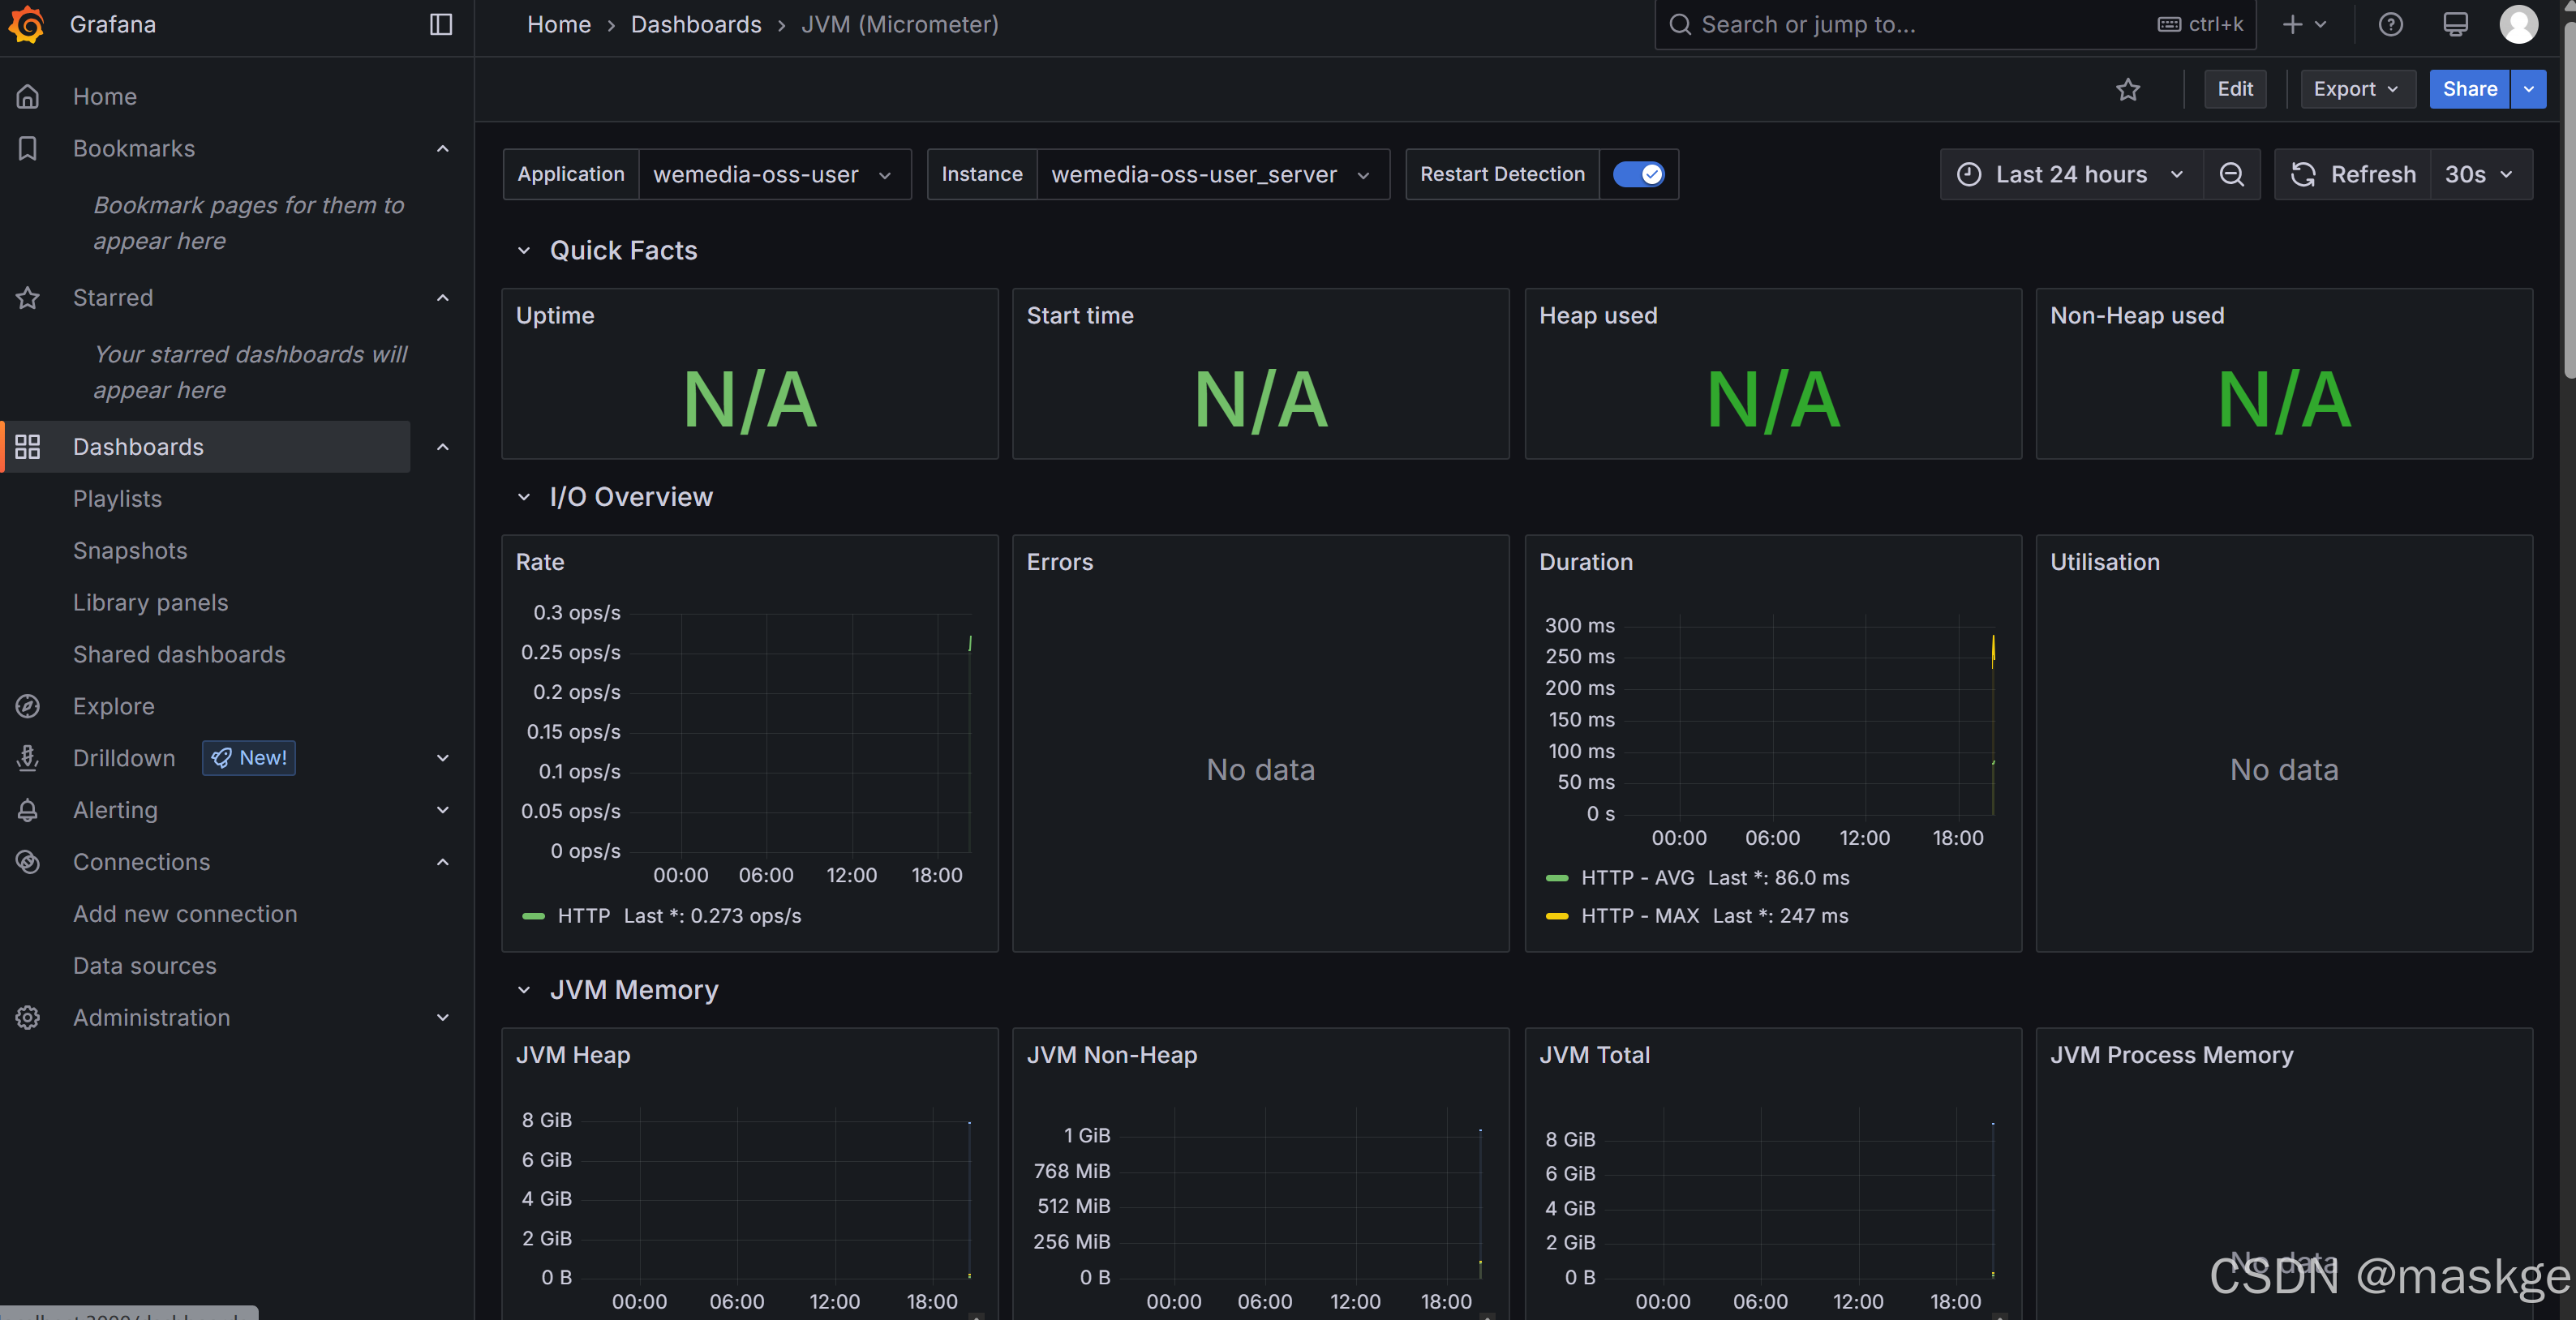
點擊導入Import按鈕,出現可視化jvm監控界面如下:
備注說明:
上面輸入的4701為jvm可視化編號
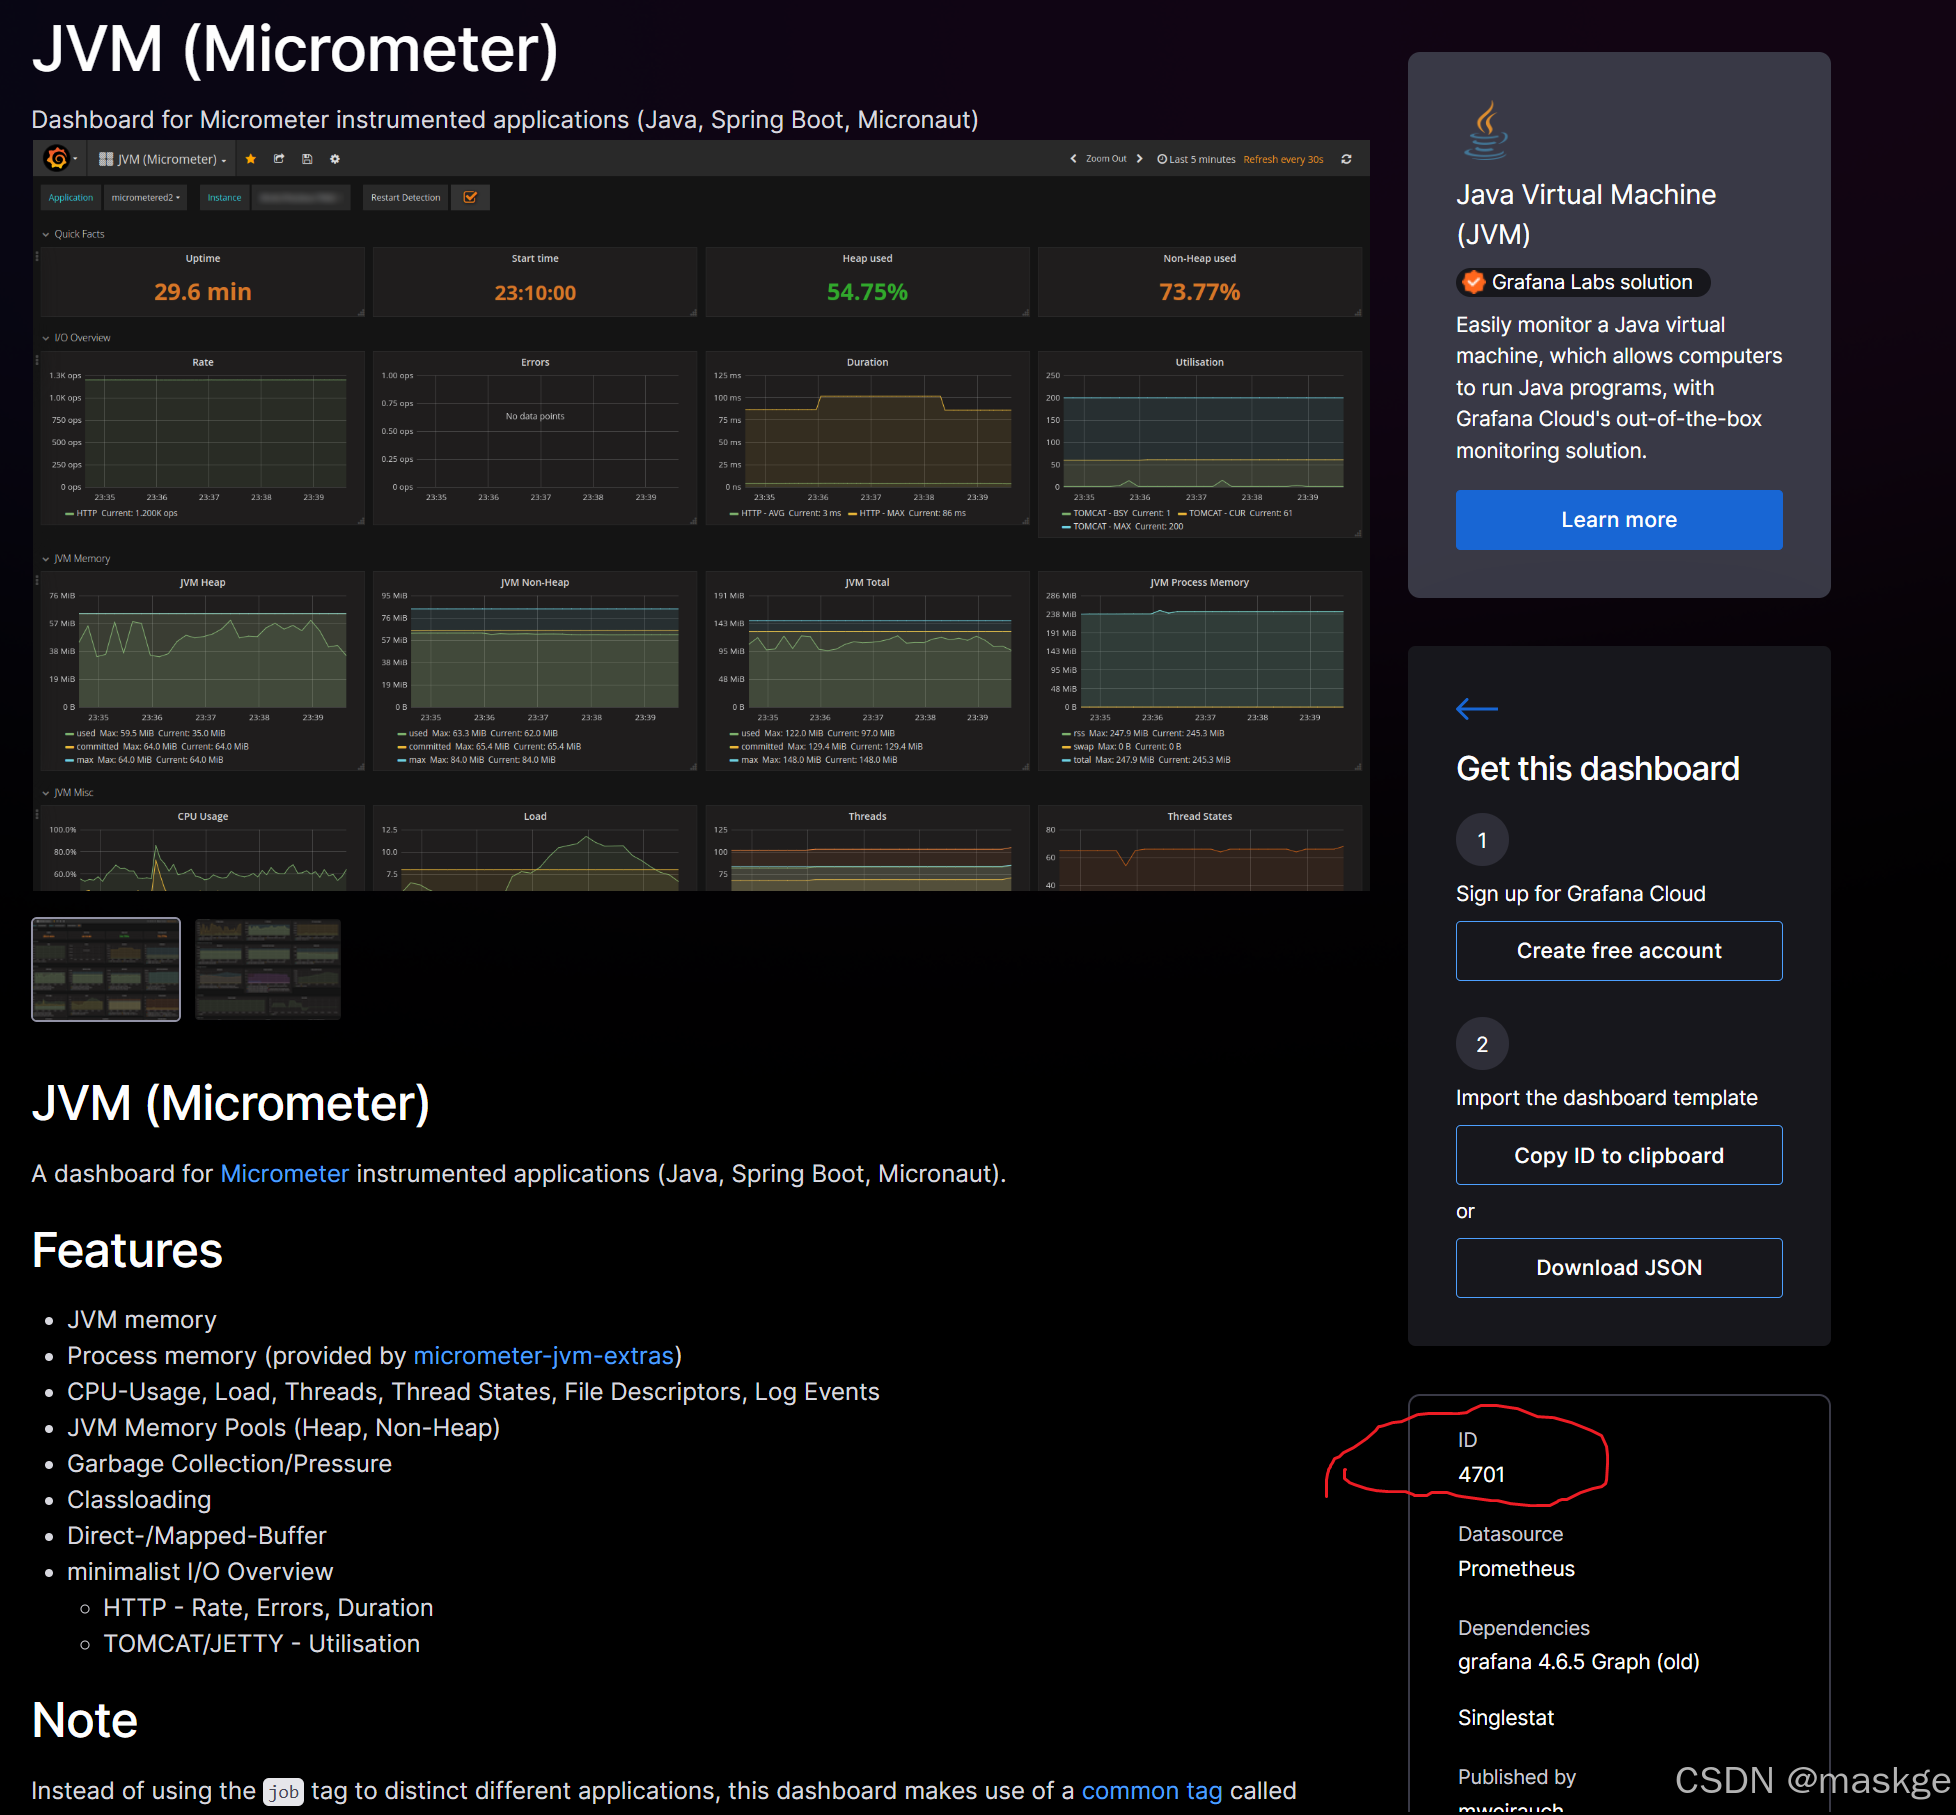
其他的可視化模版ID都可以在這個地址里找到 https://grafana.com/grafana/dashboards
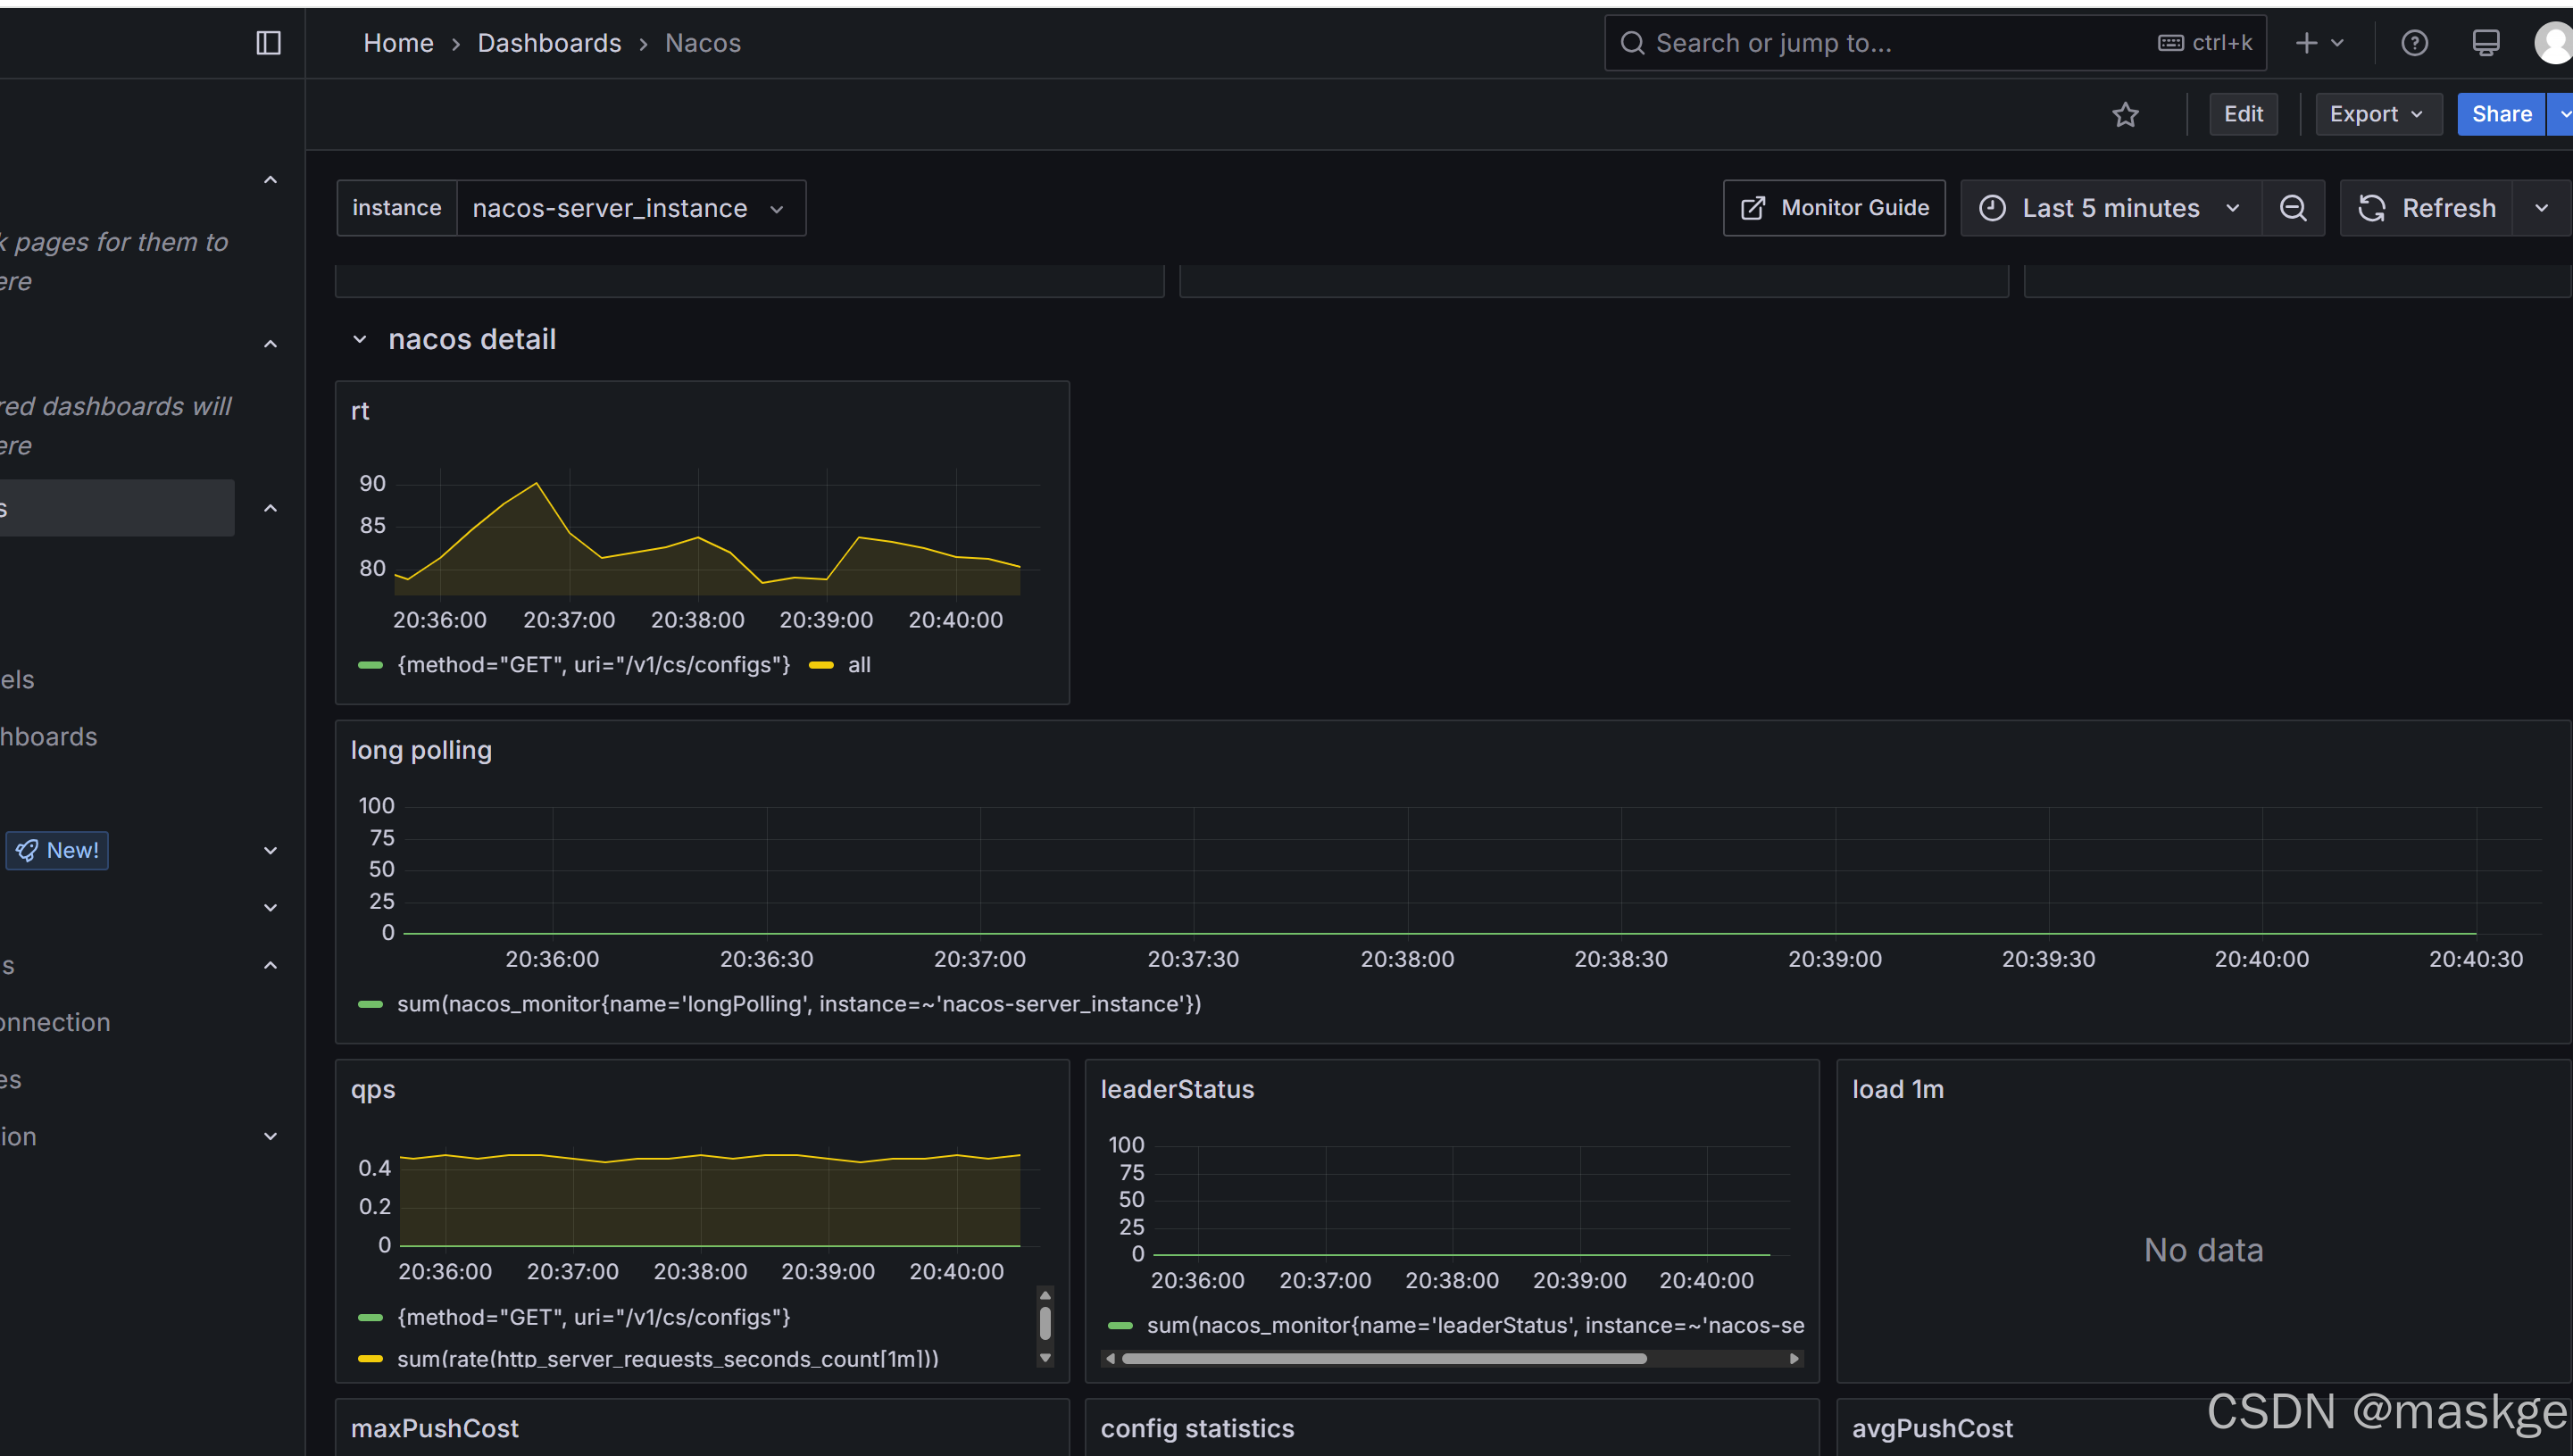
9. 配置nacos server監控
配置prometheus.yml文件中新增nacos server配置
#以下內容為nacos server配置 - job_name: "nacos-server" #配置抓取任務的名稱 scrape_interval: 5s #間隔5秒拉取微服務總數據metrics_path: '/nacos/actuator/prometheus' #設置nacos server給prometheus暴露的端點static_configs:- targets: ["localhost:8848"] #指定nacos server的地址 labels: #自定義的額外標簽app: "nacos-server"instance: "nacos-server_instance" #添加一個自定義標簽,標記目標實例
輸入nacos 可視化ID:1322
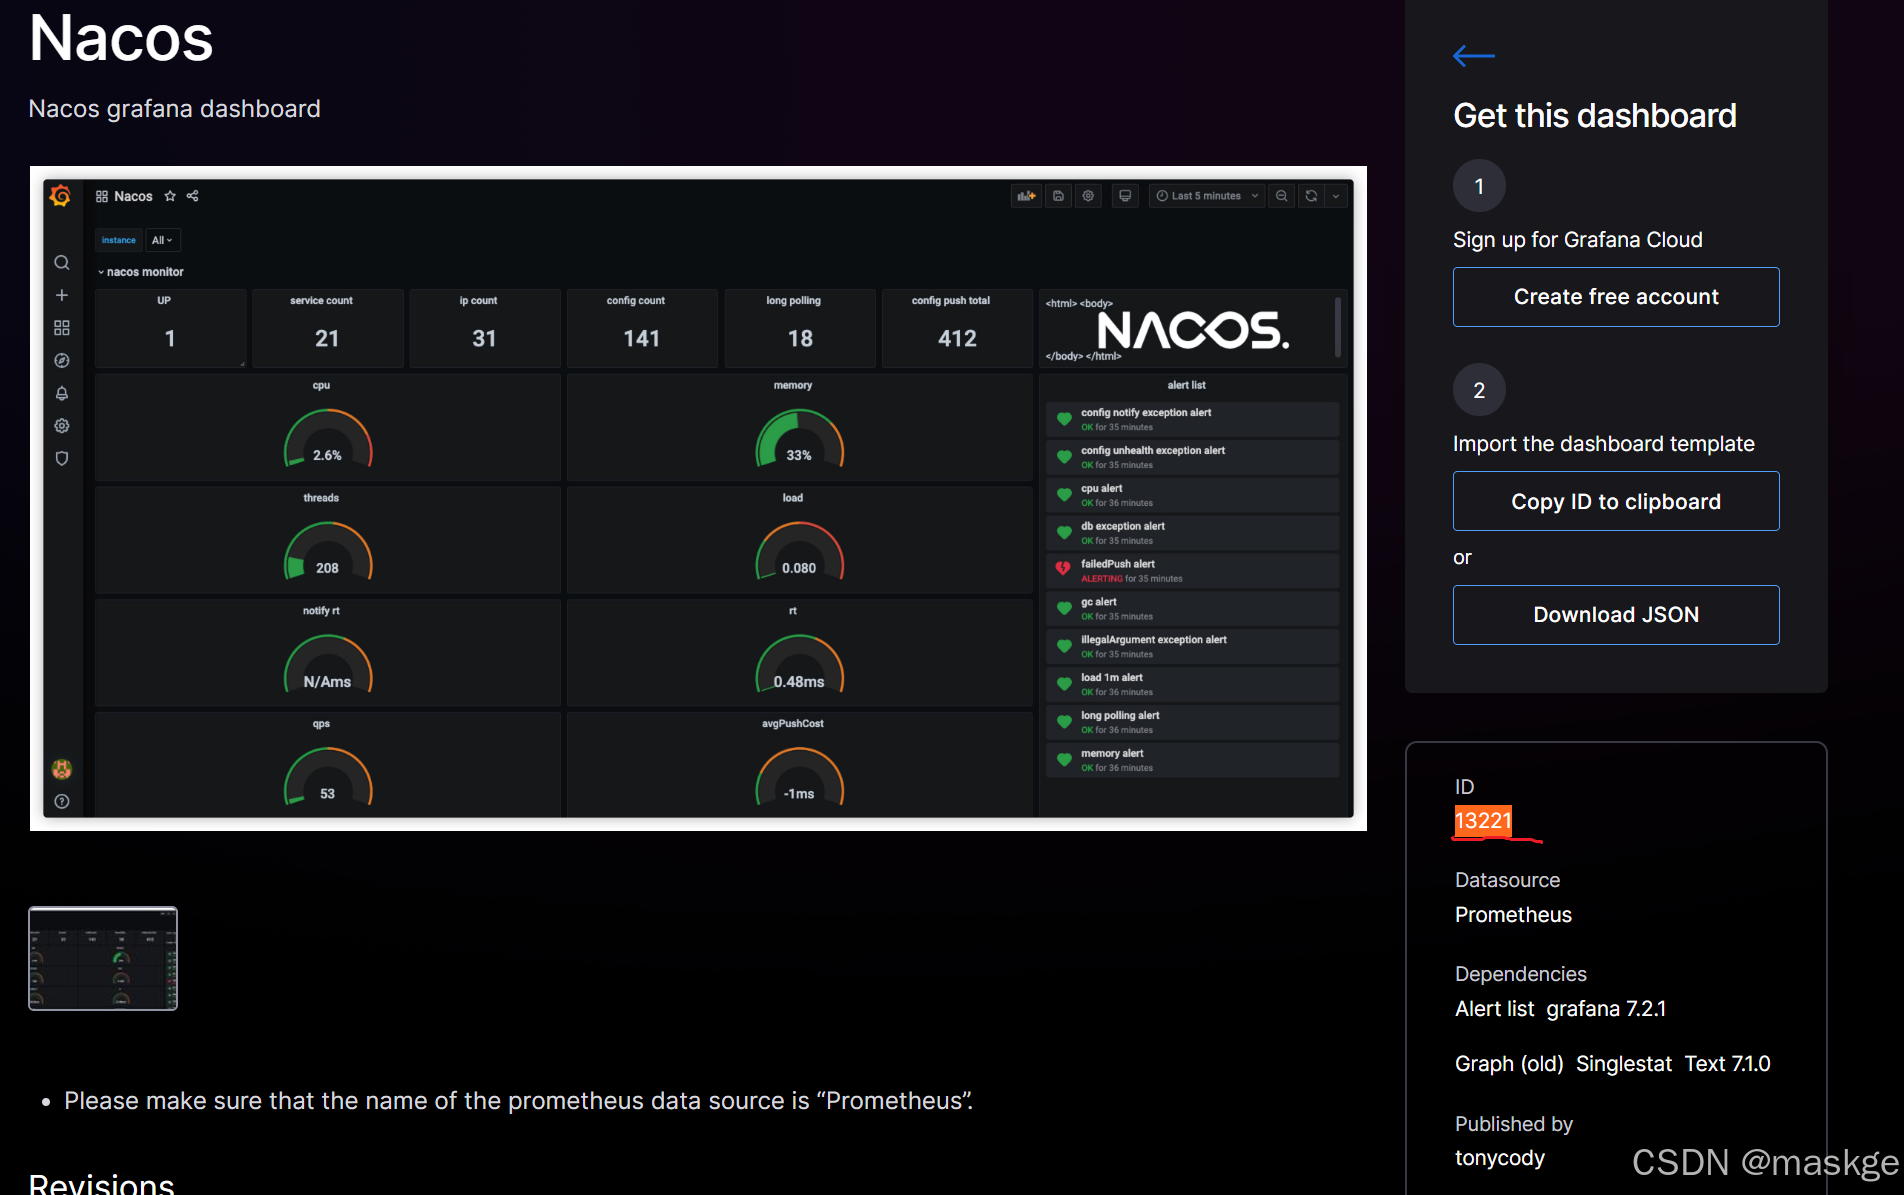
查看nacos 指標監控
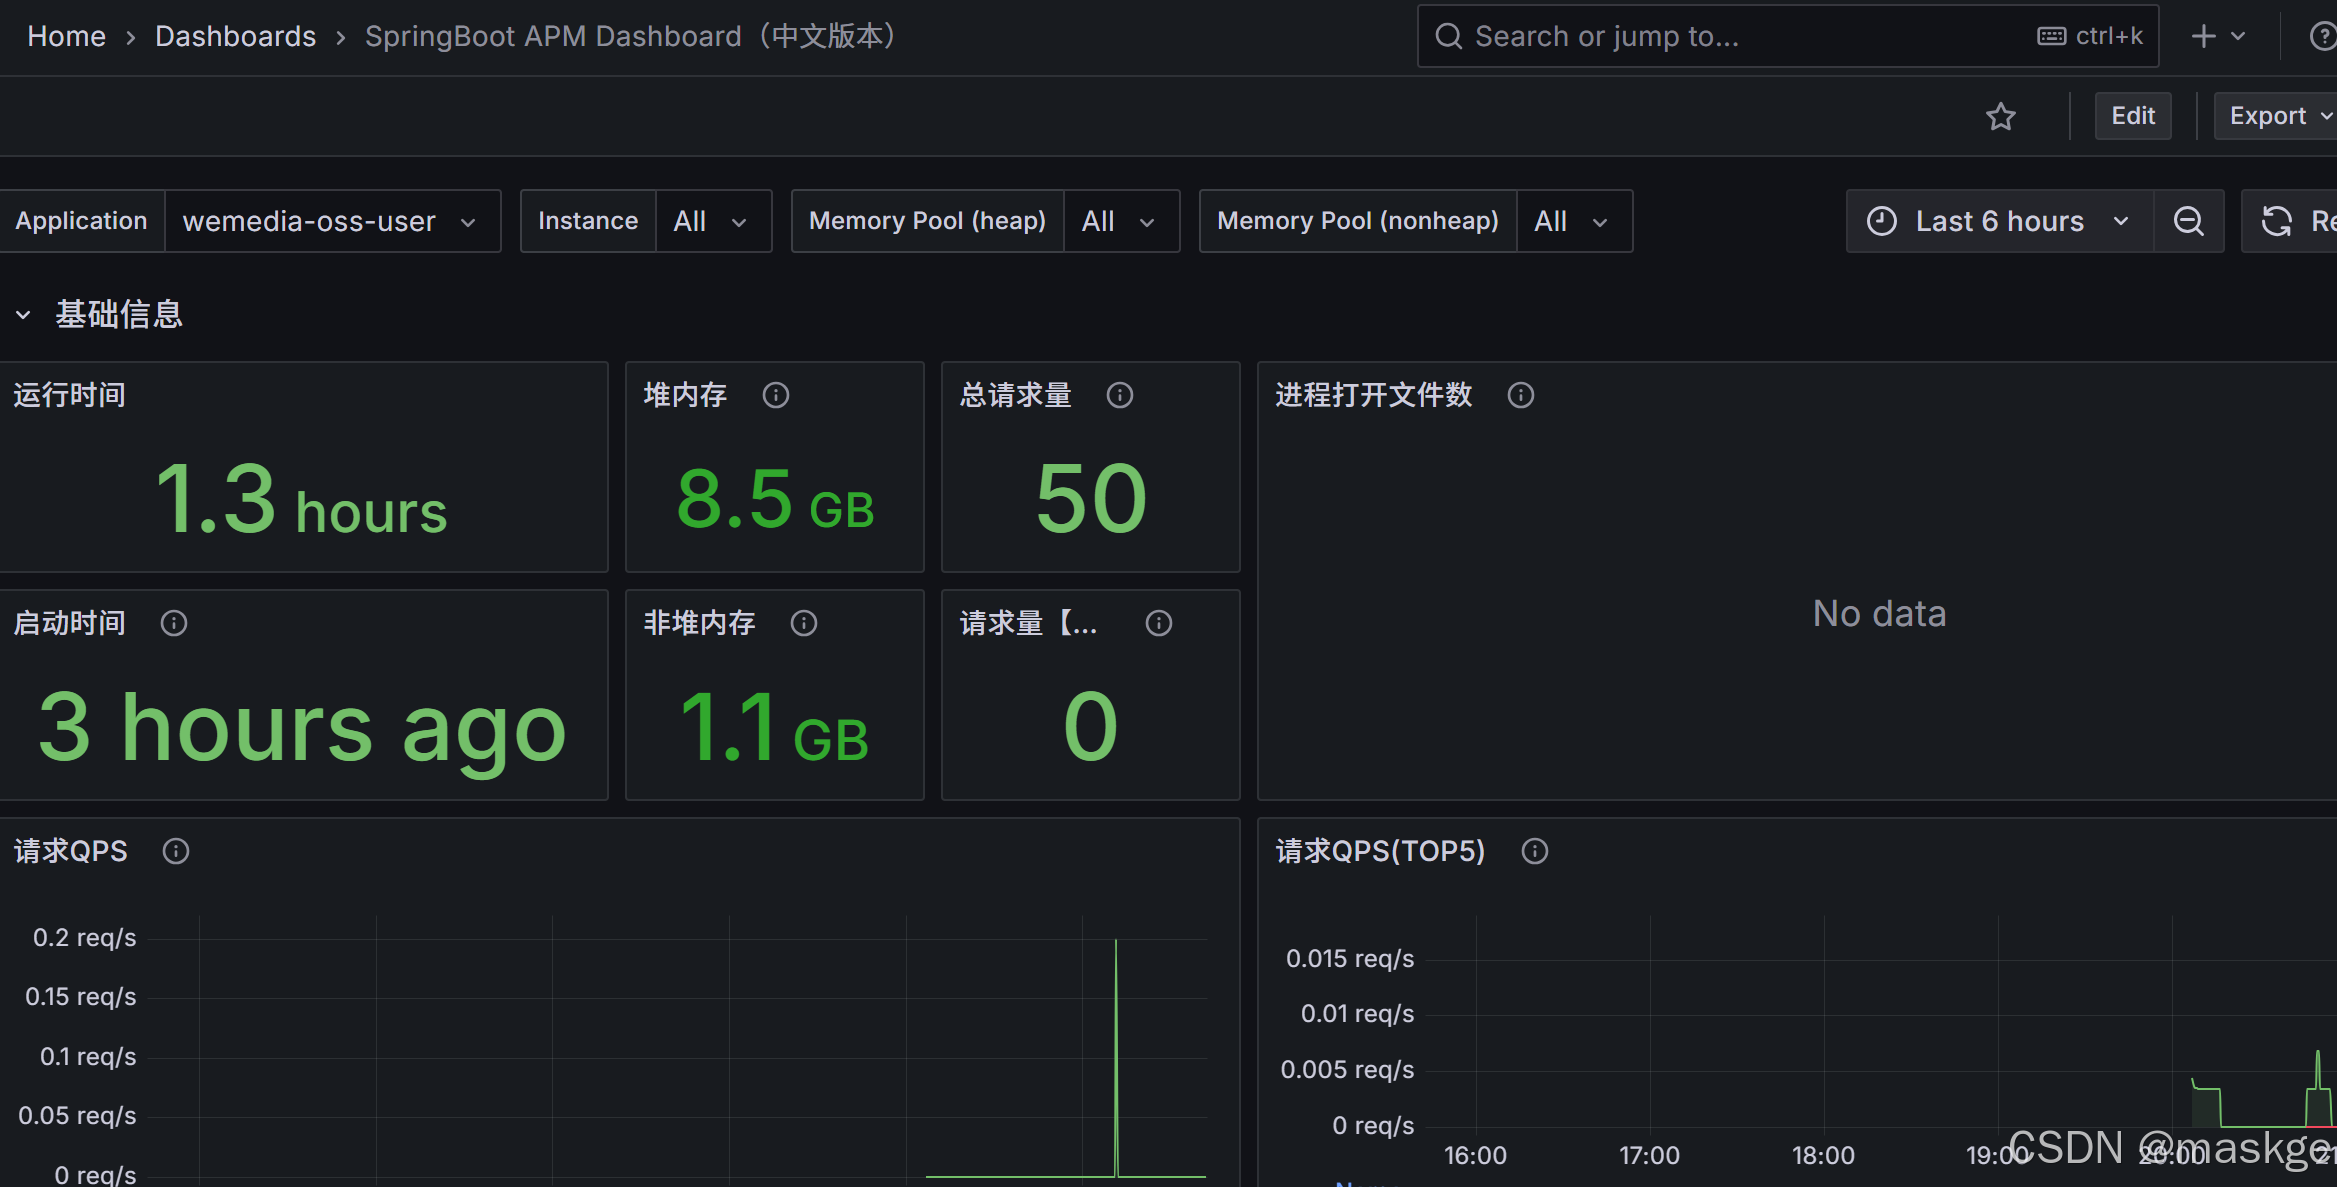
導入SpringBoot APM Dashboard(中文版本)可視化面板
導入Monitor Statistics dashboard:springboot 監控統計模版

:大模型NL2SQL繪制城市之間連線)


詳解與實踐)


—— 使用C操作MySQL)

