前言
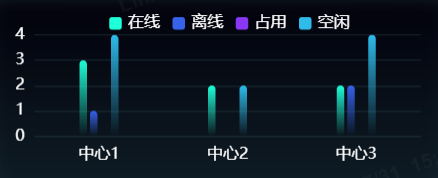
實現多個柱狀圖功能,并設置多個圖例樣式,并定時刷新數據
react引入echarts
import React, { useEffect, useRef } from 'react';
import * as echarts from 'echarts';
import DeviceApi from '@/api/screen/DeviceApi';const CenterDeviceSummary = (props) => {const chartRef = useRef(null);const initEcharts = () => {if (chartRef.current) {const chart = echarts.init(chartRef.current);const option = {tooltip: { trigger: 'axis',axisPointer: {label: {backgroundColor: '#6a7985',},},},grid: {top: '20%',left: '3%',right: '8%',bottom: '10%',containLabel: true},color: ['#1FFFD9', '#3662EC', '#8937F4', '#2FBCEB'],  //設置圖例的四個顏色legend: {orient: 'horizontal',x: 'center',   //設置圖例的位置y: 'top',top: 12,padding: 5,itemGap: 10,itemWidth: 10,itemHeight: 10,icon: 'roundRect',data: ['在線', '離線', '占用', '空閑'],   // 這里要跟series的name對上,否則圖例顯示不出來textStyle: {color: '#FFFFFF',fontSize: '0.8rem'},},xAxis: {type: 'category',data: [],axisLabel: {interval: 0,width: 10,textStyle: {color: '#FFFFFF',fontSize: '0.8rem',},formatter: function (value) {  //設x軸顯示文字的大小,大于4個字符就換行let result = '';for (let i = 0; i < value.length; i += 4) {result += value.substr(i, 4) + '\n';}return result;}},axisLine: {show: false},axisTick: {show: false},splitLine: {show: false}},yAxis: {type: 'value',axisLabel: {  // y軸文字的樣式formatter: '{value}',textStyle: {color: '#FFFFFF',fontSize: '0.8rem'},},splitLine: {  //y軸軸線的樣式show: true,lineStyle: {color: 'rgba(159,255,253,0.1)',width: 1,type: 'solid'}}},series: [{type: 'bar',data: [],name: '在線',barWidth: 6,itemStyle: {borderRadius: 3,   //柱子的圓角color: function (params) {  //柱子線性漸變return new echarts.graphic.LinearGradient(0, 0, 0, 1,[{ offset: 0, color: '#1FFFD9' },{ offset: 1, color: 'rgba(31,255,218,0)' }],false);},},barGap: '30%'  //柱子間隔},{type: 'bar',data: [],name: '離線',barWidth: 6,itemStyle: {borderRadius: 3,color: function (params) {return new echarts.graphic.LinearGradient(0, 0, 0, 1,[{ offset: 0, color: '#3662EC' },{ offset: 1, color: 'rgba(54,98,236,0)' }],false);},},barGap: '40%'},{type: 'bar',data: [],name: '占用',barWidth: 6,itemStyle: {borderRadius: 3,color: function (params) {return new echarts.graphic.LinearGradient(0, 0, 0, 1,[{ offset: 0, color: '#8A38F5' },{ offset: 1, color: 'rgba(138,56,245,0)' }],false);},},barGap: '40%'},{type: 'bar',data: [],name: '空閑',barWidth: 6,itemStyle: {borderRadius: 3,color: function (params) {return new echarts.graphic.LinearGradient(0, 0, 0, 1,[{ offset: 0, color: '#2FBCEB' },{ offset: 1, color: 'rgba(47,188,235,0)' }],false);},},barGap: '40%'}],};chart.setOption(option);const fetchData = async () => {try {const response = await DeviceApi.getSummaryByOrg();chart.setOption({xAxis: {data: response.map(item => item.orgName)},series: [{data: response.map(item => item.connectNum)},{data: response.map(item => item.disconnectNum)},{data: response.map(item => item.occupyNum)},{data: response.map(item => item.releaseNum)}]});} catch (error) {console.error('Error fetching data:', error);}}fetchData();const intervalId = setInterval(fetchData, 60 * 60 * 1000);// 當窗口大小改變時,更新圖表window.addEventListener('resize', chart.resize);// 清理函數return () => {window.removeEventListener('resize', chart.resize);clearInterval(intervalId);chart.dispose();};}};useEffect(() => {initEcharts();}, []);return (<div ><div ref={chartRef} style={{ height: '100%', width: '100%' }} /></div>)
}export default CenterDeviceSummary;
最終效果


)


與流線程(Stream Threads)的協同設計)


