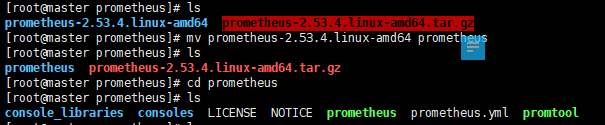
1.下載prometheus并解壓
主要配置prometheus.yml文件
在scrape_configs配置項下添加配置(hadoop202是主機名):
scrape_configs:
- job_name: ‘prometheus’
static_configs:- targets: [‘hadoop202:9090’]
添加 PushGateway 監控配置
- job_name: ‘pushgateway’
static_configs:- targets: [‘hadoop202:9091’]
-
instance: pushgatewaylabels:
添加 Node Exporter 監控配置
- job_name: ‘node exporter’
static_configs:- targets: [‘hadoop202:9100’, ‘hadoop203:9100’, ‘hadoop204:9100’]
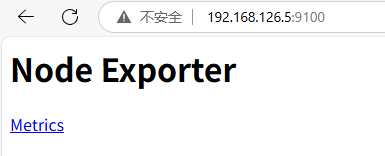
解壓啟動node_exporter后,瀏覽器可訪問該地址。
- targets: [‘hadoop202:9100’, ‘hadoop203:9100’, ‘hadoop204:9100’]
設置node_exporter開機自啟動并分發給另外的機器
創建service文件node_exporter.service修改執行地址
[atguigu@hadoop202 module] sudo vim /usr/lib/systemd/system/node_exporter.service
[Unit]
Description=node_export
Documentation=https://github.com/prometheus/node_exporter
After=network.target
[Service]
Type=simple
User=atguigu
ExecStart= /opt/module/node_exporter-1.2.2/node_exporter
Restart=on-failure
[Install]
WantedBy=multi-user.target
?設為開機自啟動(所有機器都執行)
[atguigu@hadoop202 module] sudo systemctl enable node_exporter.service
?啟動服務(所有機器都執行)
[atguigu@hadoop202 module] sudo systemctl start node_exporter.service
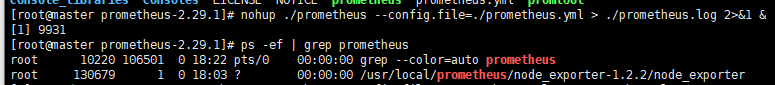
2.后臺啟動prometheus
nohup ./prometheus --config.file=./prometheus.yml
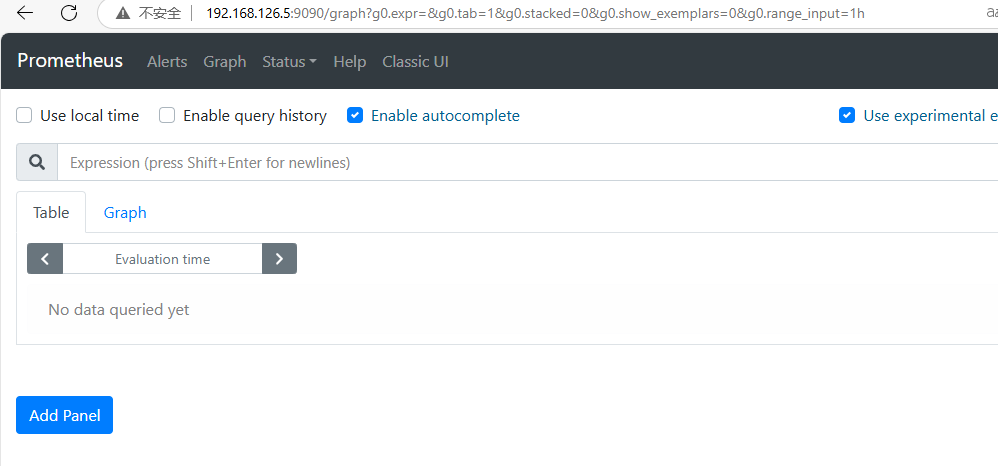
啟動完成http://192.168.126.5:9090/可以訪問
啟動pushgateway—:9091前邊記得加空格
nohup ./pushgateway --web.listen-address :9091 > .pushgateway.log 2>&1 &

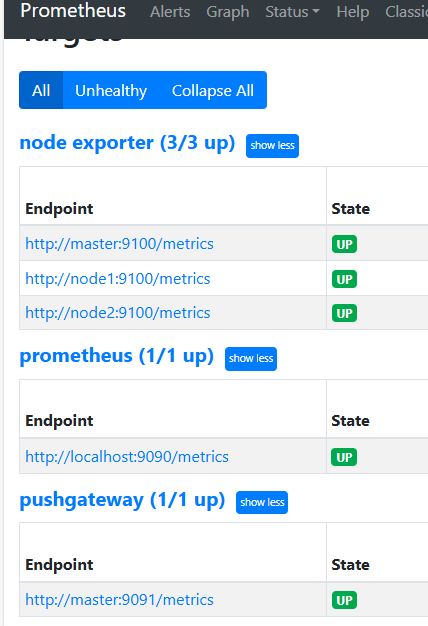
啟動后狀態全部正常
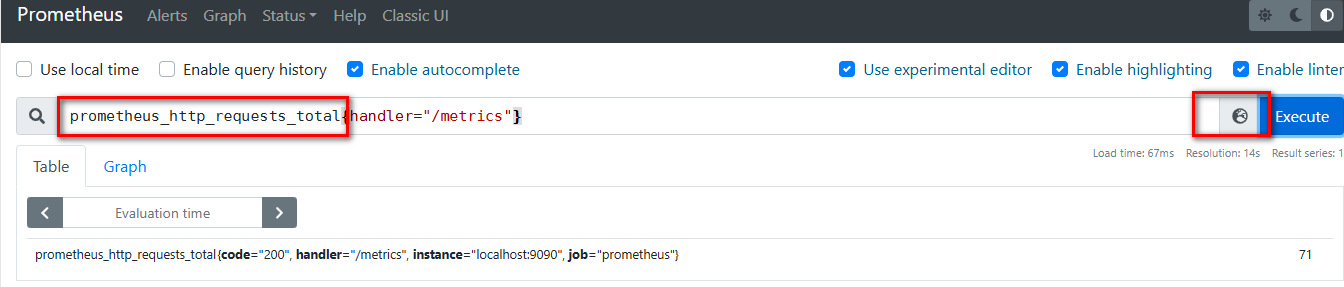
3.promql簡單查詢–瞬時向量,也可以通過正則表達式查詢
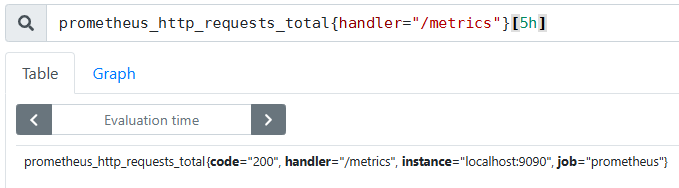
4.時間向量–5h表示5小時內的
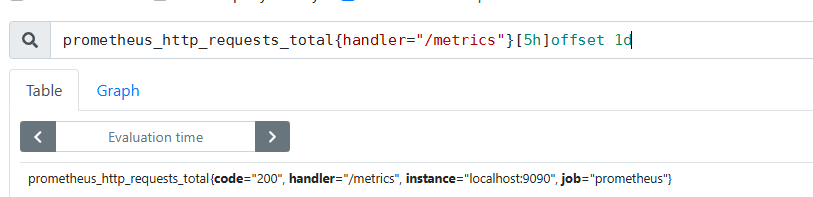
5時間位移操作–統計前一天的數據(5小時)
6.聚合操作
sum(prometheus_http_requests_total)
7.正則匹配多個值
prometheus_http_requests_total{code=~“302|400”}
8.啟動grafana
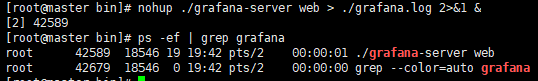
訪問grafana
http://192.168.126.5:3000/
默認密碼admin

 failed 解決方案)
)


)


——物體跟蹤)


)


