最近由于在工作中涉及到了海量圖形渲染的問題,因此我開始研究相關的解決方案。我在網絡上尋找相關的解決方案時發現許多的文章都提到利用Openlayers中的WebGLPointsLayer類,可以實現渲染海量的點,之后我又了解到利用WebGLVectorLayer類可以渲染其它的圖形。經過測試我發現利用WebGL圖層真的可以簡單方案實現對海量圖形的渲染,但是其對ol版本有很高的要求。
一、WebGL渲染的現狀
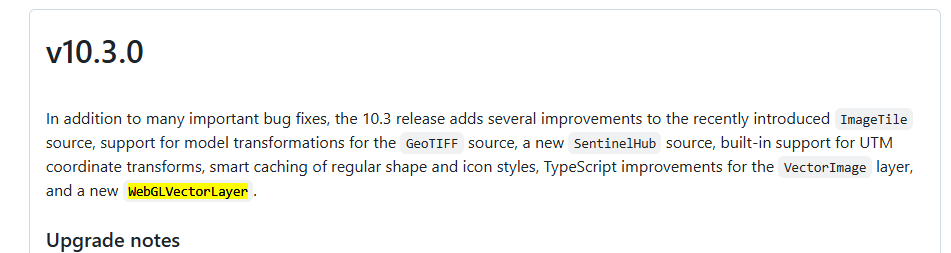
1.版本要求高
在使用的過程中我發現,WebGLPointsLayer和WebGLVectorLayer屬于是最新的實驗性的API,它們對ol版本的要求很高(我一開始使用的10.1.0的ol當中居然都沒有WebGLVectorLayer類,我升級到最新的10.5.0版本后才可以使用)。
WebGLVectorLayer需要至少10.3.0的版本才能使用。
2.缺乏參考資料
目前我再官方的API文檔中搜索WebGLPointsLayer和WebGLVectorLayer均無相關的API介紹。
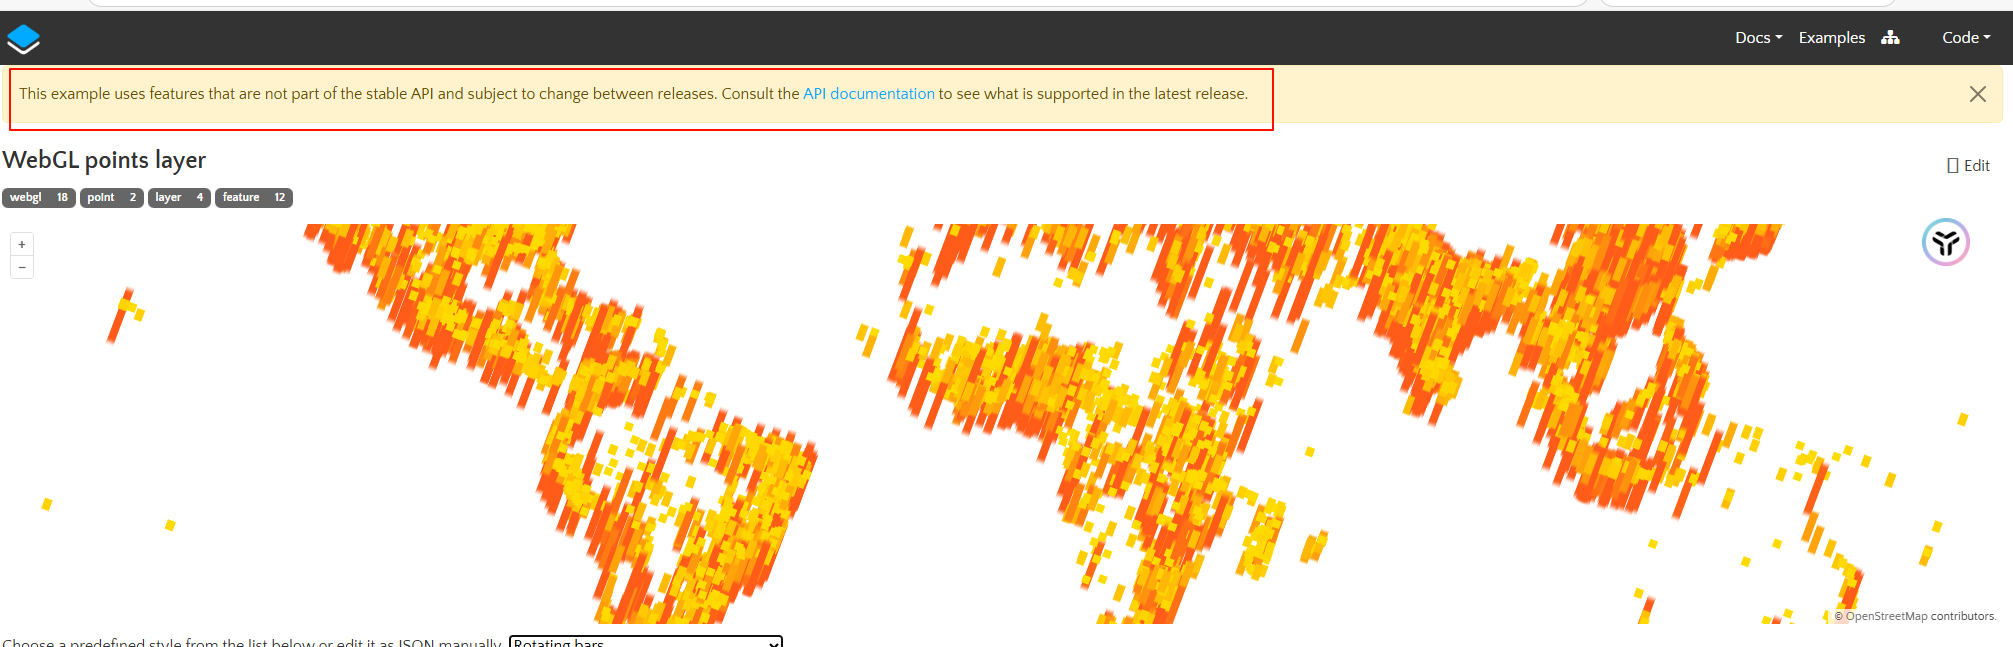
想要了解它們的使用方式我推薦參考以下的幾個官方示例:
- Icon Sprites with WebGL
- WebGL Vector Layer
- WebGL points layer
3.謹慎使用WebGL矢量圖層
總的來說WebGL矢量圖層是一種十分方便快捷的解決海量圖形渲染問題的方案,我個人感覺這種WebGL渲染也應該是Openlayers未來的一個更新方向。
但是目前這些接口并不穩定未來可能會發生變化,并且目前恐怕也很少有項目會去使用最新版本的ol,因此不推薦在生產項目中使用這種方案來解決海量圖形渲染問題。
二、使用WebGLPointsLayer渲染點
在下面的示例中我隨機生成了10w個點并通過WebGLPointsLayer渲染到了地圖中。
webgl渲染10w點
/***@abstract 生成當前地圖范圍內的隨機點數據* @param {*} map* @param {number} count 點數量* @returns*/
export const randomPointFeature = (map, count) => {const point = turf.randomPoint(count, {bbox: map.getView().calculateExtent(map.getSize()),});const features = new GeoJSON().readFeatures(point);return features;
};
import { Vector as VectorSource } from "ol/source";
import WebGLPointsLayer from "ol/layer/WebGLPoints";function addRiver_webgl_point() {//生成10w+點const features = randomPointFeature(window.map, 100000);const pointSource = new VectorSource({features,});let style = {"circle-radius": 3,"circle-fill-color": "red",};const pointLayer = new WebGLPointsLayer({source: pointSource,style,});window.map.addLayer(pointLayer);Message.success("10w+點添加成功!");
}三、使用WebGLVectorLayer渲染圖形
WebGLPointsLayer圖層只能添加點要素,如果要添加線或面要素則需要使用WebGLVectorLayer圖層,下面的示例中我展示了使用WebGLVectorLayer圖層向地圖中渲染了一個由20w+的多邊形組成的河流三角網。
webgl渲染河流三角網
import WebGLVectorLayer from "ol/layer/WebGLVector.js";
import { Vector as VectorSource } from "ol/source";
import GeoJSON from "ol/format/GeoJSON.js";// 河流三角網數據
import riverGrid from "@/assets/geojson/LDJ.json";function addRiver_webgl() {// 讀取GeoJSON數據const riverMeshFeatures = new GeoJSON().readFeatures(riverGrid, {dataProjection: "EPSG:4547",featureProjection: "EPSG:4326",});const riverSource = new VectorSource({features: riverMeshFeatures,});const style = {"stroke-color": ["*", ["get", "COLOR"], [220, 0, 0]],"stroke-width": 4.5,"fill-color": ["*", ["get", "COLOR"], [255, 255, 255, 0.3]],};const riverLayer = new WebGLVectorLayer({source: riverSource,style,});window.map.addLayer(riverLayer);Message.success("河流三角網添加成功!");
}
四、flat樣式
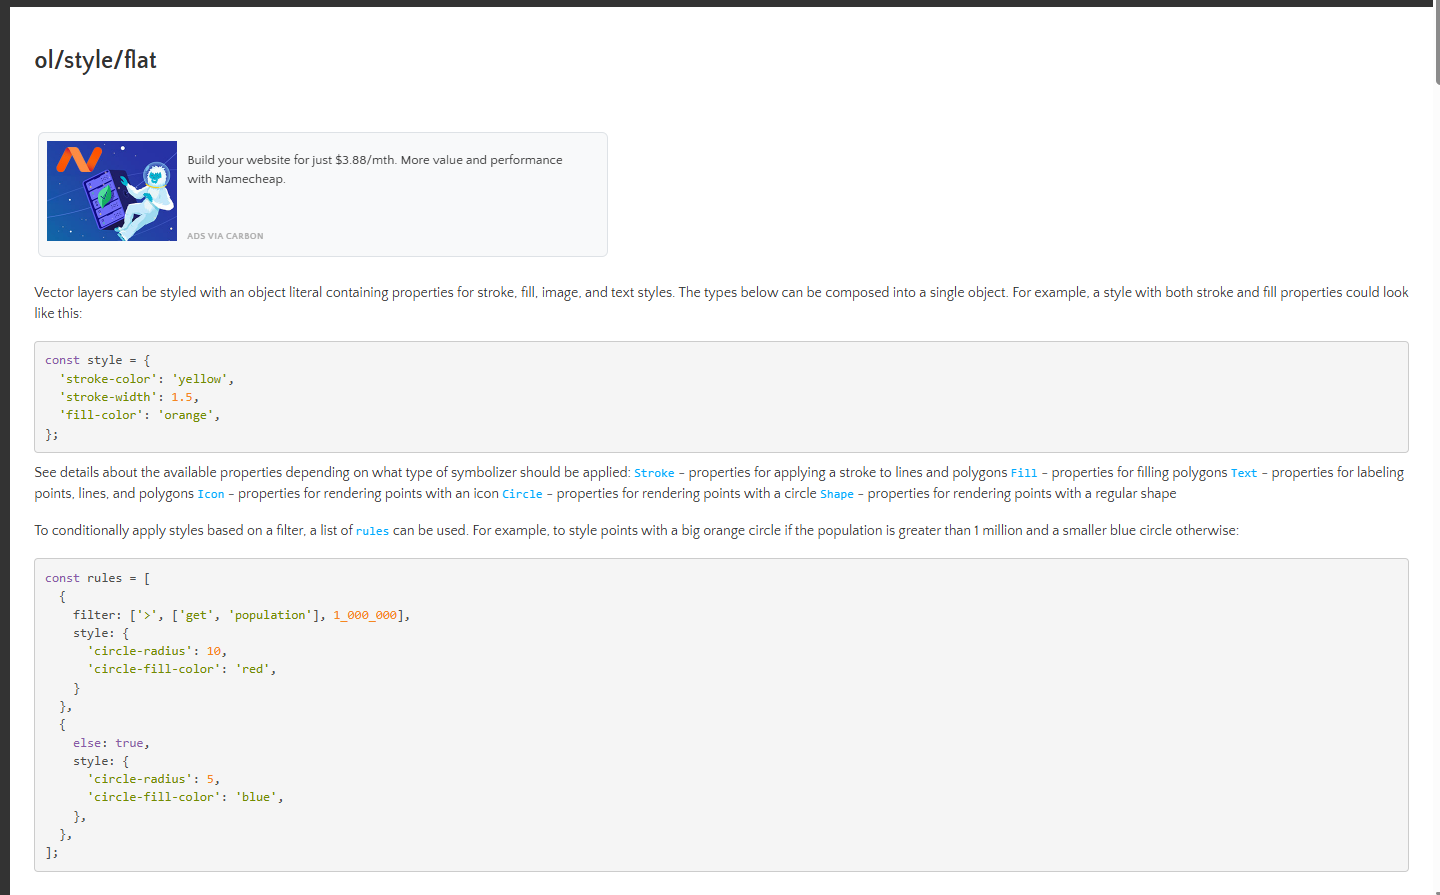
使用WebGL渲染矢量圖形的流程非常簡單,基本上就是創建一個矢量數據源,然后在將其添加到WebGL矢量圖層中。

我個人感覺其中唯一的難點就是“給圖層設置樣式”,WebGL圖層不能使用Style類來設置樣式(如果用了會報錯),需要使用 flat樣式。
// ? 錯誤的樣式設置方式
const style = new Style({image: new CircleStyle({radius: 5,fill: new Fill({color: "rgba(255, 0, 0, 0.5)",}),stroke: new Stroke({color: "#333",width: 1,}),}),
});// ? 正確的樣式設置方式
let style = {"circle-radius": 3,"circle-fill-color": "red",
};
我也是第一次接觸到 flat樣式 (感覺有種既視感,似乎在哪里見過類似的東西 mapbox?),之后有時間我會好好研究一下。
參考資料
- 259:vue+openlayers: 顯示海量多邊形數據,10ms加載完成_webglvectorlayerrenderer-CSDN博客
- OpenLayers教程11_在OpenLayers中啟用WebGL渲染_openlayers webgl-CSDN博客
- Icon Sprites with WebGL
- WebGL Vector Layer
- WebGL points layer

題解)

,源碼可白嫖!)


:PSI5 —— 汽車安全傳感器的“抗干擾狙擊手”)
)
)


【詳細自用版】)


)
