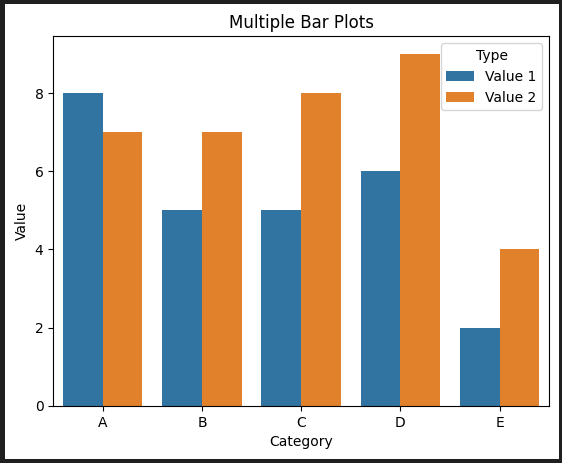
1. 將多個柱狀繪制在一個圖中
import seaborn as sns
import matplotlib.pyplot as plt
import numpy as np
import pandas as pd# 創建示例數據
categories = ['A', 'B', 'C', 'D', 'E']
values1 = np.random.randint(1, 10, size=len(categories))
values2 = np.random.randint(1, 10, size=len(categories))# 創建 DataFrame
df = pd.DataFrame({'Category': categories * 2,'Value': np.concatenate([values1, values2]),'Type': ['Value 1'] * len(categories) + ['Value 2'] * len(categories)
})# 使用 Seaborn 繪制
sns.barplot(x='Category', y='Value', hue='Type', data=df)# 添加標簽
plt.xlabel('Category')
plt.ylabel('Value')
plt.title('Multiple Bar Plots')
plt.legend(title='Type')
plt.show()
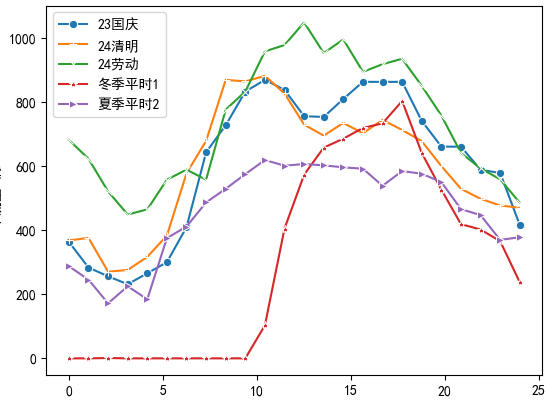
2. 將多個折線圖畫在一張圖上
import seaborn as sns
import matplotlib.pyplot as plt
plt.rcParams['font.sans-serif'] = ['SimHei']  # 指定中文字體為黑體
plt.rcParams['axes.unicode_minus'] = False  # 解決負號顯示為方塊的問題
x = np.linspace(0,24,24)
sns.lineplot(x=x,y=df_23guoqing['flow'], marker='o',label='23國慶')
# sns.lineplot(x=x,y=df_240101['flow'], marker='s',label='24元旦')
sns.lineplot(x=x,y=df_24qingm['flow'], marker='+',label='24清明')
sns.lineplot(x=x,y=df_240501['flow'], marker='x',label='24勞動')
sns.lineplot(x=x,y=df_240205['flow'], marker='*',label='冬季平時1')
sns.lineplot(x=x,y=df_240508['fflow'], marker='>',label='夏季平時2')
plt.xlabel('小時')
plt.ylabel('車流量 輛/h')
plt.legend()
plt.show()
在這里插入圖片描述


新特性概覽(二):解構賦值、擴展與收集、class類全面解析)


)


)

