apexcharts數據可視化之雷達圖
有完整配套的Python后端代碼。
本教程主要會介紹如下圖形繪制方式:
- 基礎雷達圖
- 多組數據雷達圖
- 雷達圖標記點
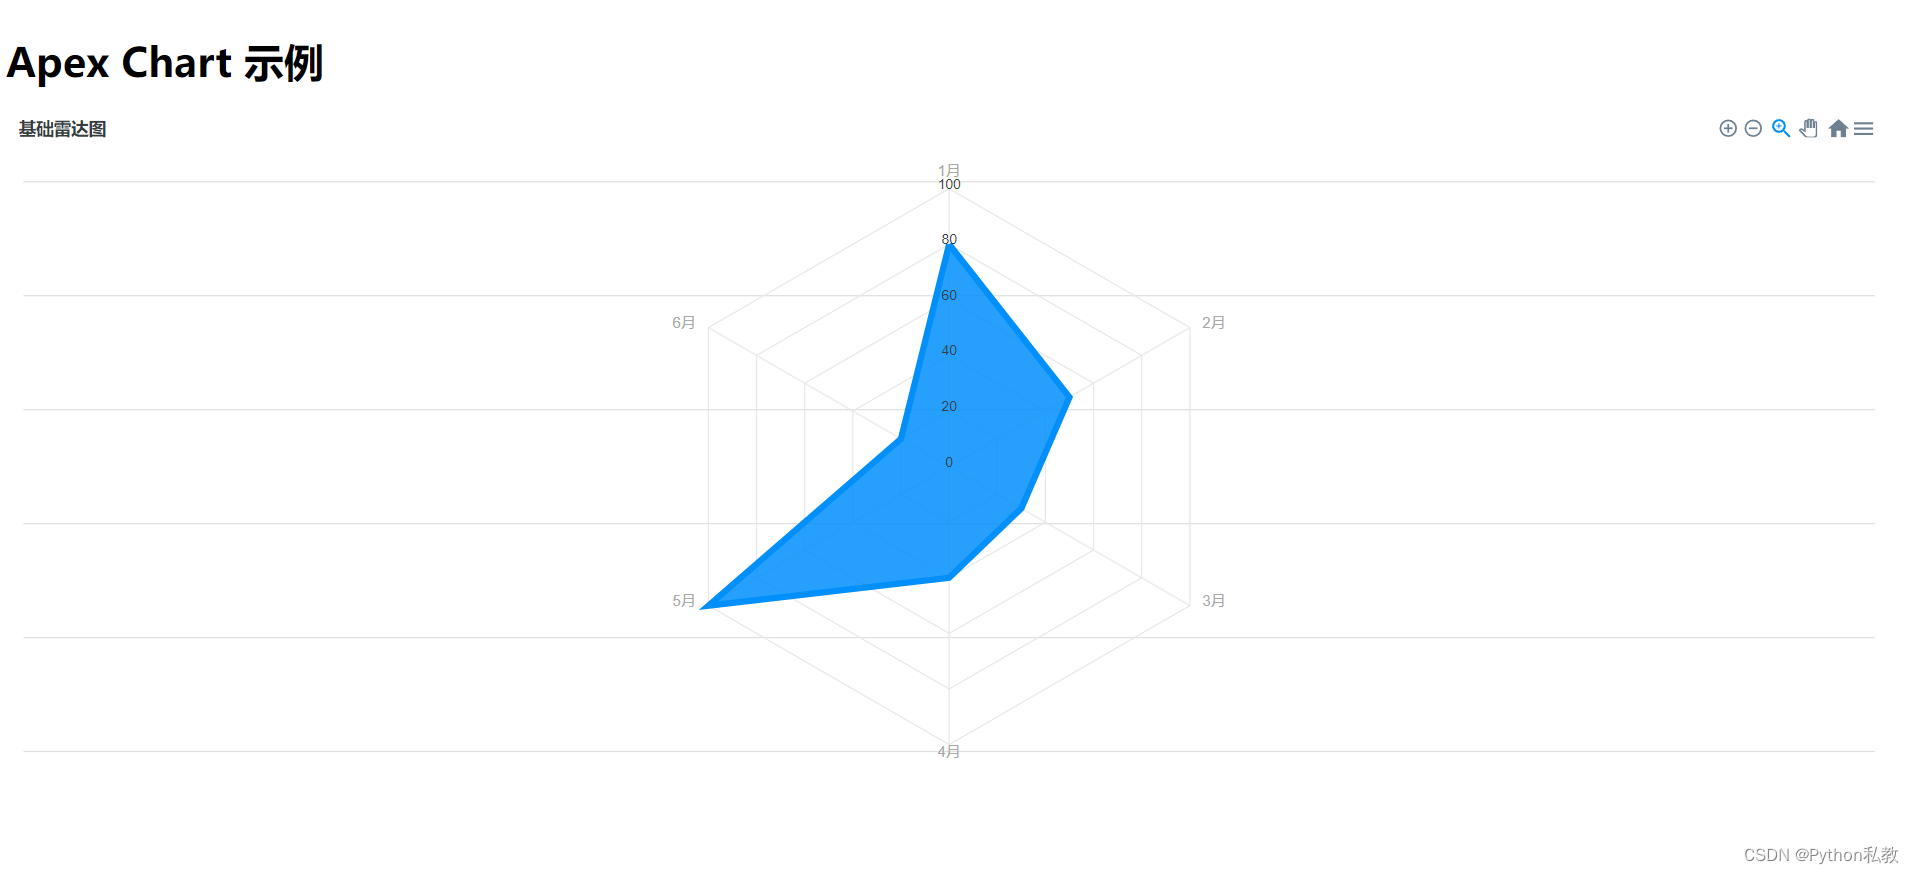
基礎雷達圖
import ApexChart from 'react-apexcharts';export function BasicRadar() {// 數據序列const series = [{name: '數據1',data: [80, 50, 30, 40, 100, 20],}]// 圖表選項const options = {chart: {height: 350,type: 'radar',},title: {text: '基礎雷達圖'},yaxis: {stepSize: 20},xaxis: {categories: ['1月', '2月', '3月', '4月', '5月', '6月']}}return (<div id="chart"><ApexChart options={options} series={series} type="radar" height={550}/></div>)
}
多組數據雷達圖
import ApexChart from 'react-apexcharts';export function MultiRadar() {// 數據序列const series = [{name: '數據 1',data: [80, 50, 30, 40, 100, 20],}, {name: '數據 2',data: [20, 30, 40, 80, 20, 80],}, {name: '數據 3',data: [44, 76, 78, 13, 43, 10],}]// 圖表選項const options = {chart: {height: 350,type: 'radar',dropShadow: {enabled: true,blur: 1,left: 1,top: 1}},title: {text: '多組數據雷達圖'},stroke: {width: 2},fill: {opacity: 0.1},markers: {size: 0},yaxis: {stepSize: 20},xaxis: {categories: ['2011', '2012', '2013', '2014', '2015', '2016']}}return (<div id="chart"><ApexChart options={options} series={series} type="radar" height={550}/></div>)
}

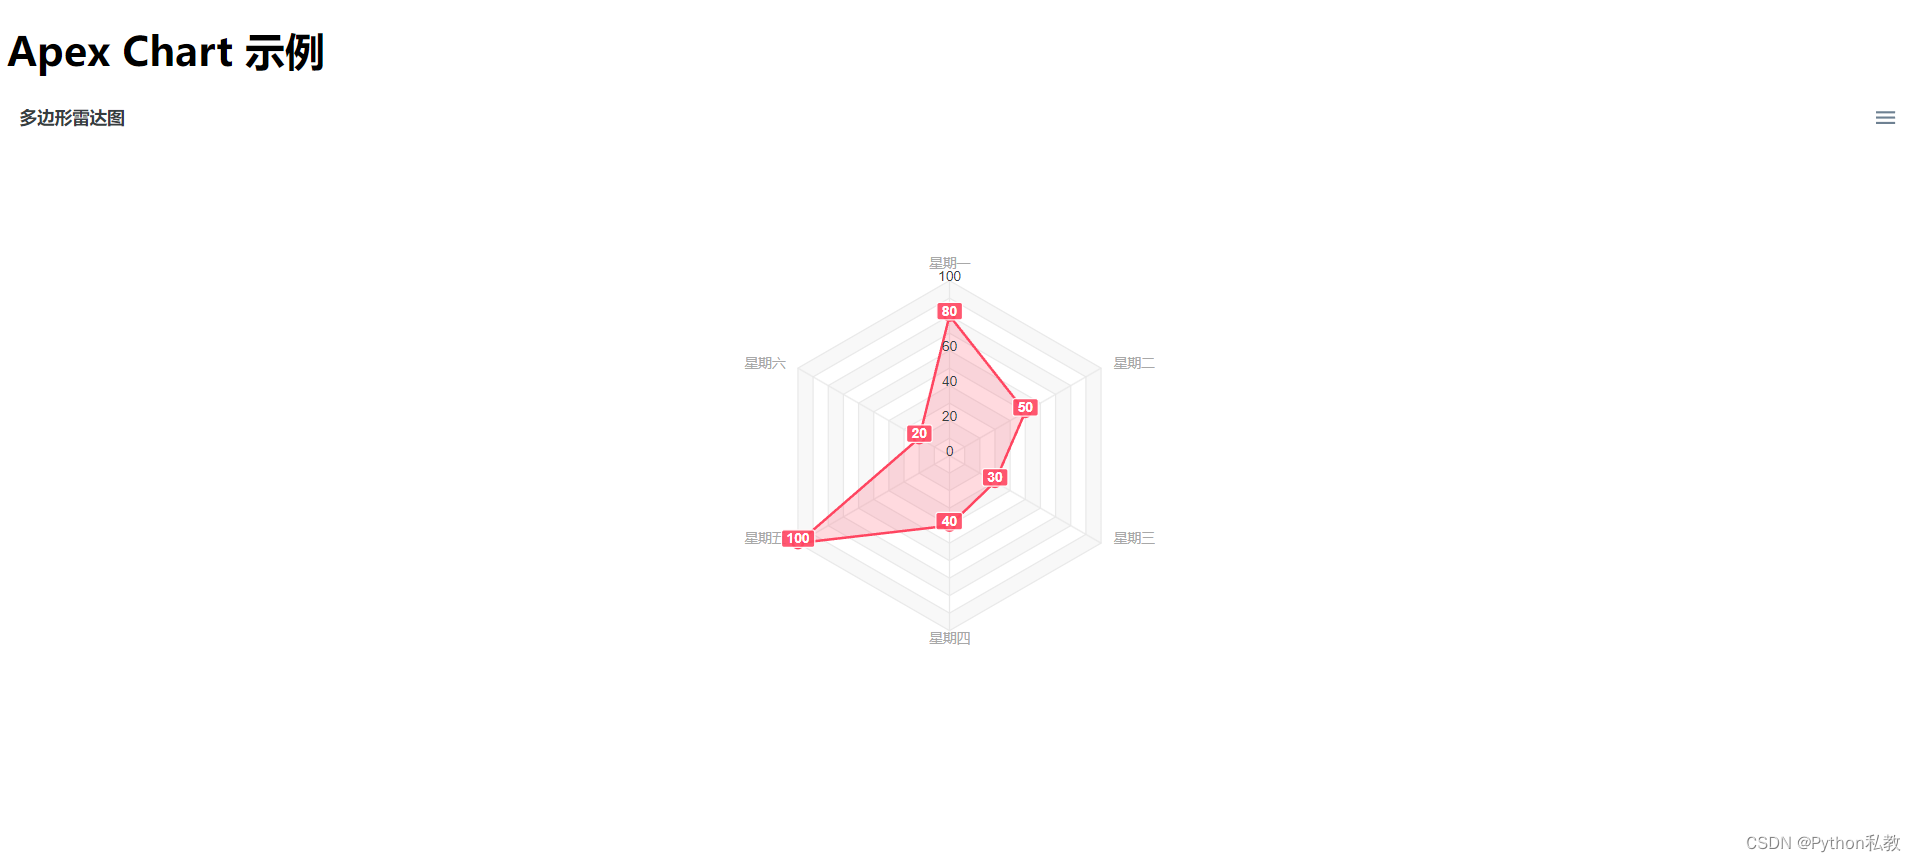
雷達圖標記點
import ApexChart from 'react-apexcharts';export function PolygonRadar() {// 數據序列const series = [{name: '數據 1',data: [80, 50, 30, 40, 100, 20],}]// 圖表選項const options = {chart: {height: 350,type: 'radar',},dataLabels: {enabled: true},// 繪制參數plotOptions: {radar: {size: 140,polygons: {strokeColors: '#e9e9e9',fill: {colors: ['#f8f8f8', '#fff']}}}},title: {text: '多邊形雷達圖'},colors: ['#FF4560'],// 標記點markers: {size: 4,colors: ['#fff'],strokeColor: '#FF4560',strokeWidth: 2,},tooltip: {y: {formatter: function(val) {return val}}},xaxis: {categories: ['星期一', '星期二', '星期三', '星期四', '星期五', '星期六', '星期天']},yaxis: {labels: {formatter: function(val, i) {if (i % 2 === 0) {return val} else {return ''}}}}}return (<div id="chart"><ApexChart options={options} series={series} type="radar" height={550}/></div>)
}


修改和刪除)


產品規格說明書)


