1、R語言繪制海岸線邊界
參考:
Drawing beautiful maps programmatically with R, sf and ggplot2 — Part 1: Basics
使用R繪制世界地圖及緯度統計圖
Drawing maps with R. A basic tutorial:https://dr2blog.hcommons.org/2020/03/23/drawing-maps-with-r-a-basic-tutorial/
準備工作:安裝所需要的包,如install.packages("rnaturalearth")等等。
測試:
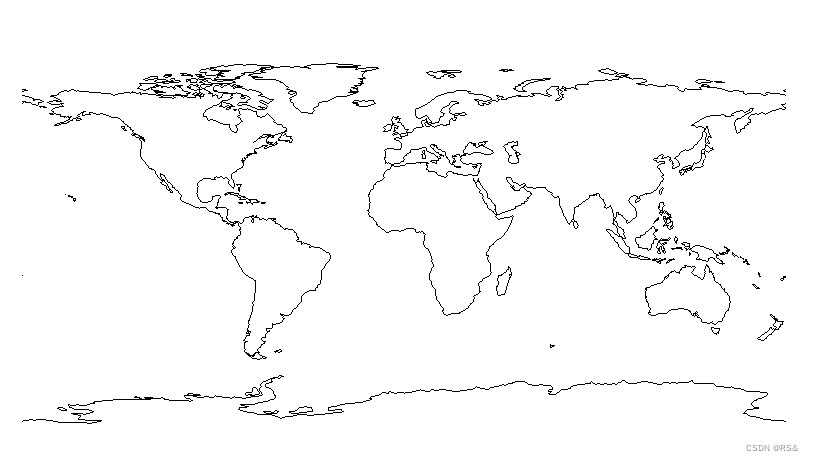
library(ggplot2)
library(rnaturalearth)coast <- ne_coastline(scale = "small", returnclass = "sf")
ggplot(data = coast) + geom_sf() + theme_classic()
結果:
如果想只顯示指定區域:
library(ggplot2)
library(rnaturalearth)coast <- ne_coastline(scale = "small", returnclass = "sf")
xlim <- c(-175, 175)  # 經度范圍
ylim <- c(-55, 80)    # 緯度范圍ggplot(data = coast) + geom_sf() + coord_sf(xlim = xlim, ylim = ylim) + theme_classic()
參考資料:
1、ggplot2 for ocean data:https://hansenjohnson.github.io/ggplot2_tutorial/

)


-常用的擴展之pg_store_plans)


)


)

