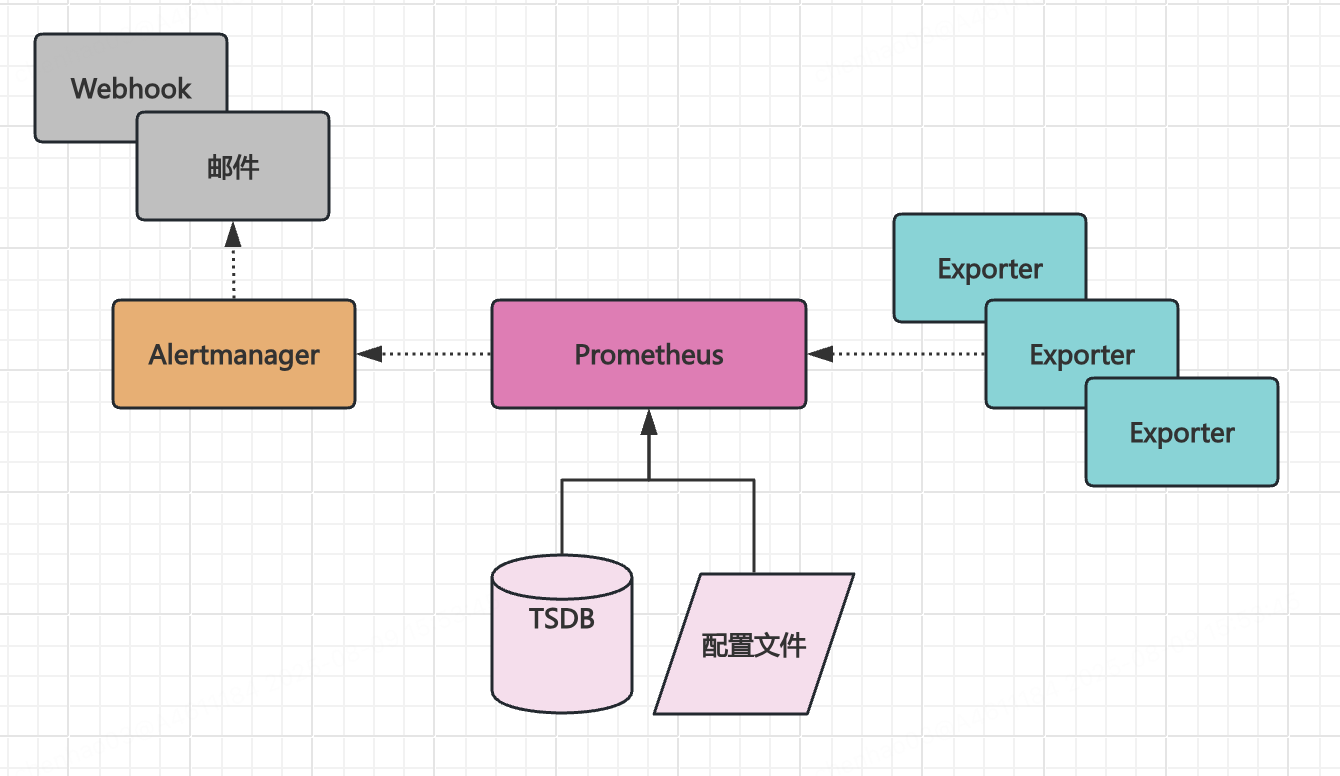
Promethues 組件
- prometheus server
- exporter
- alertmanager
環境準備
- Docker
拉取鏡像備用
# https://hub.docker.com/r/prom/prometheus
docker pull m.daocloud.io/docker.io/prom/prometheus:main# https://hub.docker.com/r/prom/node-exporter
docker pull m.daocloud.io/docker.io/prom/node-exporter:master# https://hub.docker.com/r/prom/alertmanager
docker pull m.daocloud.io/docker.io/prom/alertmanager:main
- 接收 Prometheus Alertmanager Webhook 告警的 API
本文使用 php 接收
$ cat index.php
<?php$a = $_GET;
$b = $_POST;
$c = file_get_contents('php://input');file_put_contents('debug.log', print_r([date('Y-m-d H:i:s', time()), $a, $b, $c], true), FILE_APPEND);print_r([$a, $b, $c]);# 在 9977 端口監聽 HTTP 請求,用于告警的 webhook
$ php -S 0.0.0.0:9977
代碼示例
目錄結構
tree .
├── alertmanager # Alertmanager 相關配置及數據目錄
│   ├── config
│   │   └── alertmanager.yml # 配置文件
│   └── data # 數據目錄
├── prometheus # Prometheus 相關配置及數據目錄
│   ├── config
│   │   ├── alert_rules.yml # 告警配置
│   │   └── prometheus.yml # prometheus 配置文件
│   └── data # 數據目錄
├── run-alertmanager.sh # 啟動 Alertmanager 腳本
├── run-node-exporter.sh # 啟動 Node-Exporter 腳本
└── run-prometheus.sh # 啟動 Prometheus Server 腳本
腳本內容
alertmanager/config/alertmanager.yml
route:group_by: ['alertname']group_wait: 30sgroup_interval: 5mrepeat_interval: 1hreceiver: 'web.hook'
receivers:- name: 'web.hook'webhook_configs:# webhook 的通知地址- url: 'http://192.168.1.8:9977/'
inhibit_rules:- source_match:severity: 'critical'target_match:severity: 'warning'equal: ['alertname', 'dev', 'instance']
prometheus/config/prometheus.yml
# my global config
global:scrape_interval: 15s # Set the scrape interval to every 15 seconds. Default is every 1 minute.evaluation_interval: 15s # Evaluate rules every 15 seconds. The default is every 1 minute.# scrape_timeout is set to the global default (10s).# Alertmanager configuration
alerting:alertmanagers:- static_configs:- targets:# alertmanager 的服務地址- 192.168.1.8:9093# Load rules once and periodically evaluate them according to the global 'evaluation_interval'.
rule_files:# - "first_rules.yml"# - "second_rules.yml"- "alert_rules.yml"# A scrape configuration containing exactly one endpoint to scrape:
# Here it's Prometheus itself.
scrape_configs:# The job name is added as a label `job=<job_name>` to any timeseries scraped from this config.- job_name: "prometheus"# metrics_path defaults to '/metrics'# scheme defaults to 'http'.static_configs:- targets: ["localhost:9090"]# The label name is added as a label `label_name=<label_value>` to any timeseries scraped from this config.labels:app: "prometheus"- job_name: "my_node_exporter"# metrics_path defaults to '/metrics'# scheme defaults to 'http'.static_configs:# node_exporter 地址- targets: ["192.168.1.8:9100"]# The label name is added as a label `label_name=<label_value>` to any timeseries scraped from this config.labels:app: "another_node_exporter"
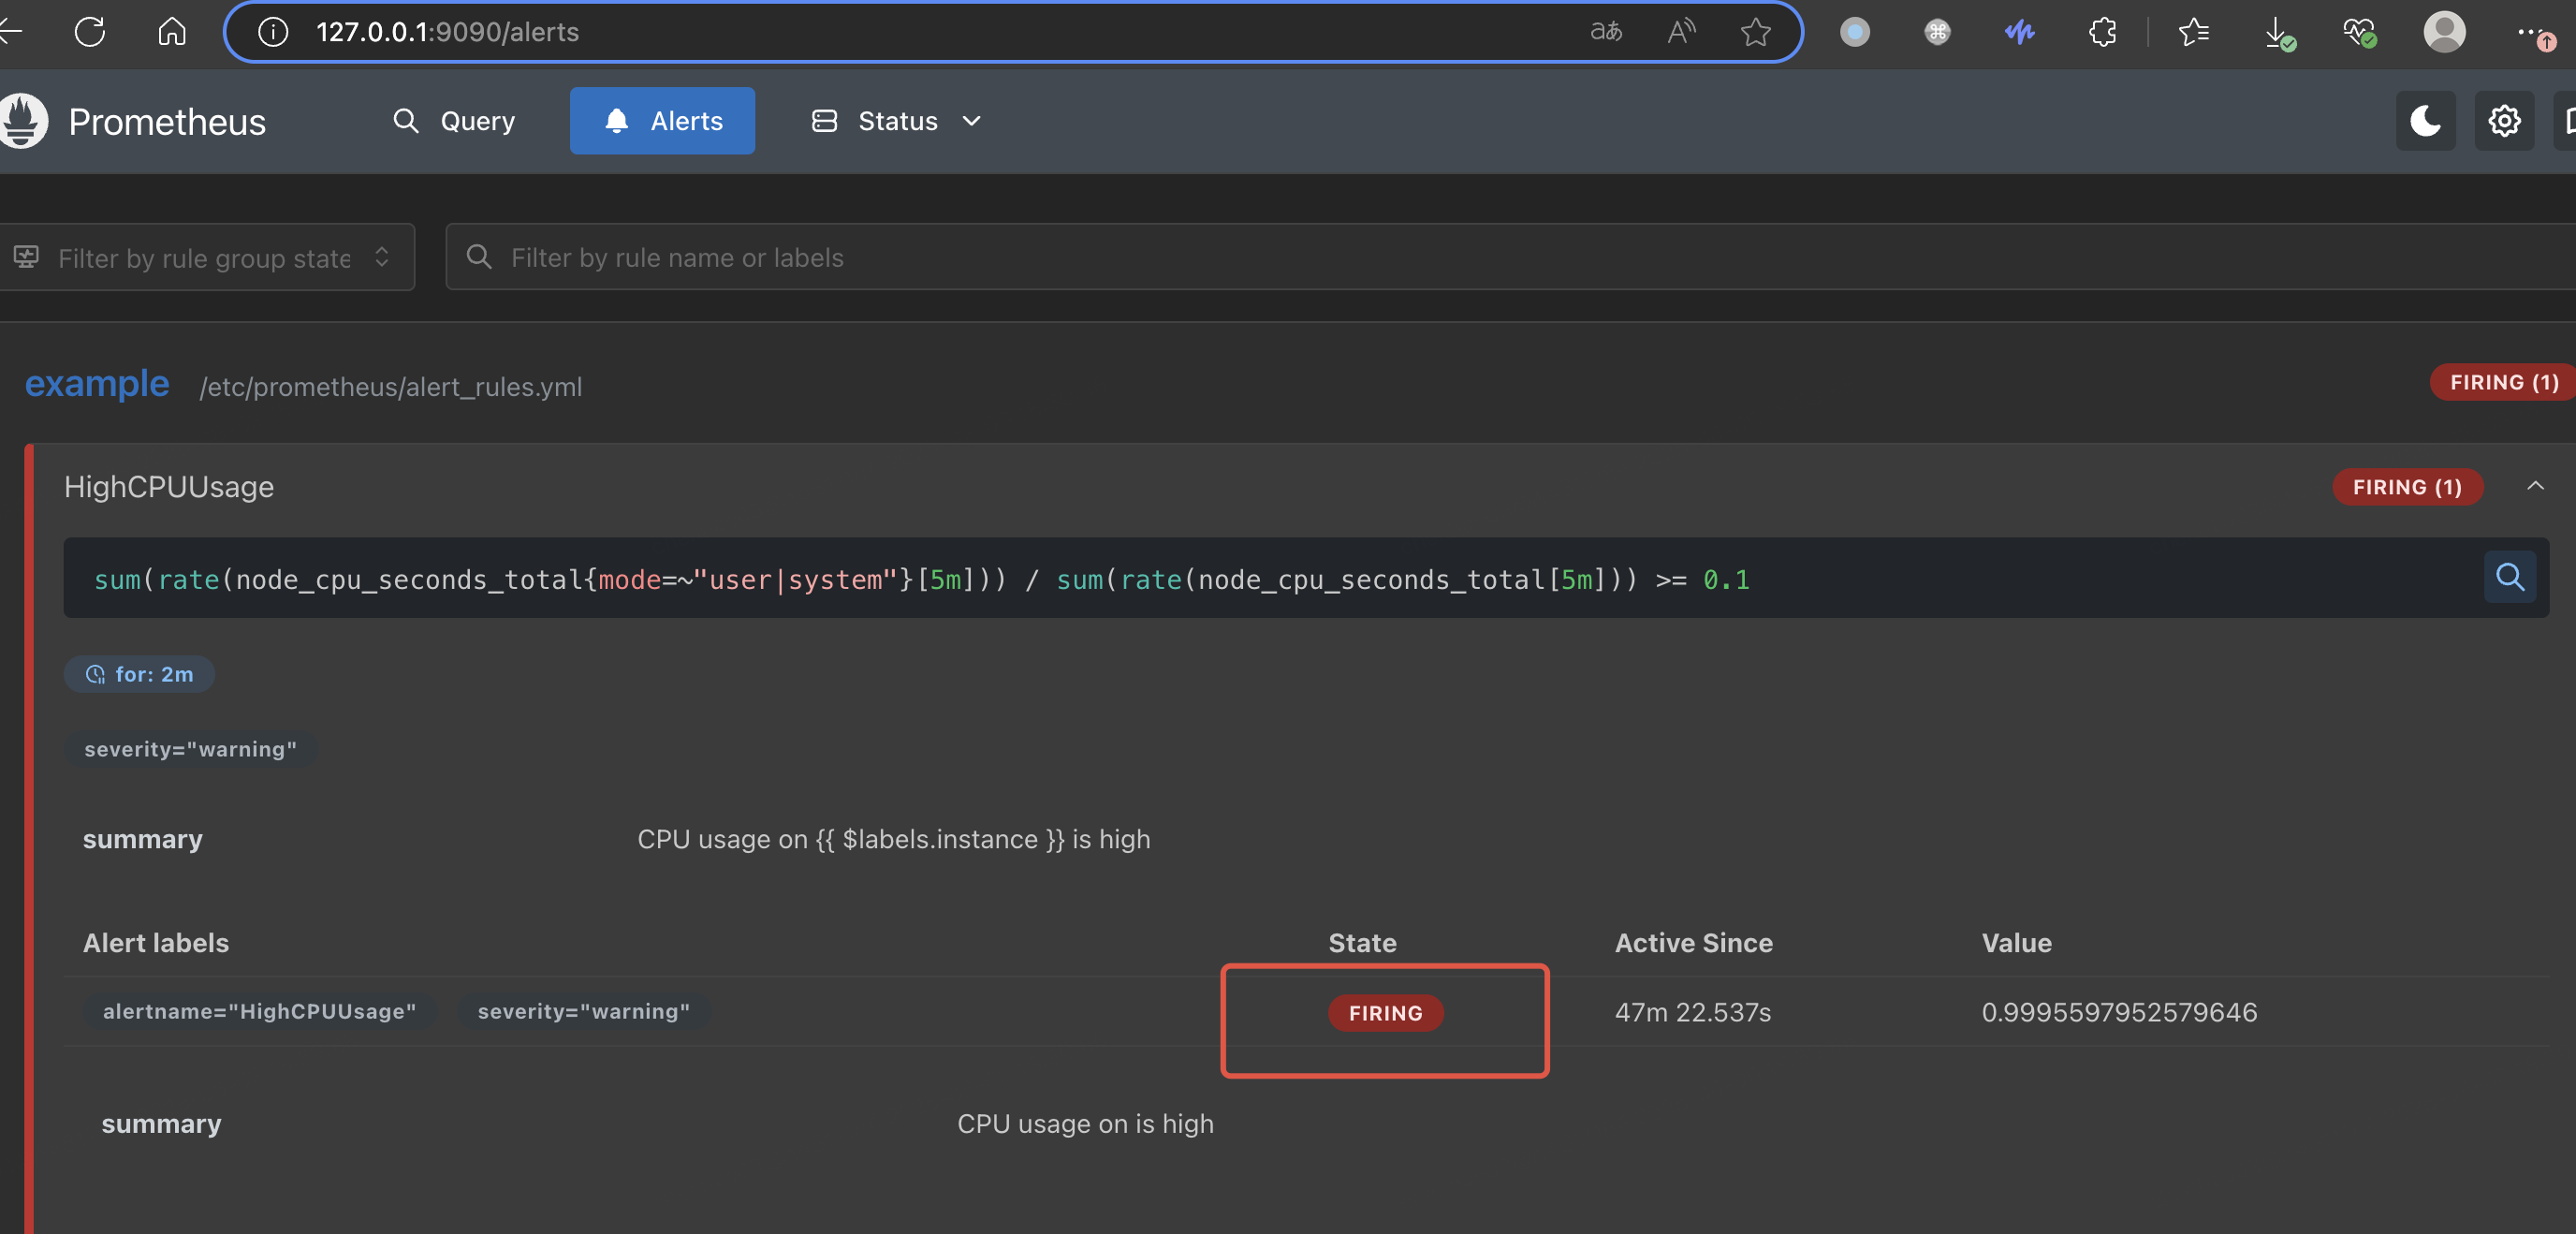
prometheus/config/alert_rules.yml
groups:- name: examplerules:- alert: HighCPUUsage# 當 CPU 使用率 >= 85% 持續時間 >= 2 分鐘以上時進行告警expr: sum(rate(node_cpu_seconds_total{mode=~"user|system"}[5m]))/sum(rate(node_cpu_seconds_total[5m])) >= 0.8for: 2mlabels:severity: warningannotations:summary: "CPU usage on {{ $labels.instance }} is high"
run-alertmanager.sh
#!/bin/shCONFIG_PATH=$PWD/alertmanager/config
DATA_PATH=$PWD/alertmanager/data
IMAGE=m.daocloud.io/docker.io/prom/alertmanager:maindocker run --rm --name alertmanager -d \-v $CONFIG_PATH:/etc/alertmanager \-v $DATA_PATH:/alertmanager \-p 9093:9093 \$IMAGE
run-node-exporter.sh
#!/bin/shIMAGE=m.daocloud.io/docker.io/prom/node-exporter:master
docker run -d \-p 9100:9100 \$IMAGE
run-prometheus.sh
#!/bin/sh
IMAGE=m.daocloud.io/docker.io/prom/prometheus:main
CONFIG_PATH=$PWD/prometheus/config
DATA_PATH=$PWD/prometheus/data# 注:--web.enable-lifecycle 啟用熱重載
# 配置熱重載方式:curl -X POST http://192.168.1.8:9090/-/reload
docker run --rm --name prometheus -d \-v $CONFIG_PATH:/etc/prometheus \-v $DATA_PATH:/prometheus \-p 127.0.0.1:9090:9090 \$IMAGE \--config.file=/etc/prometheus/prometheus.yml \--storage.tsdb.path=/prometheus \--web.enable-lifecycle
開始運行
(1)啟動組件
# 啟動 Alertmanager
sh run-alertmanager.sh# 啟動 Exporter
sh run-node-exporter.sh# 啟動 Prometheus Server
sh run-prometheus.sh# 查看容器狀態
docker ps
CONTAINER ID   IMAGE                                               COMMAND                   CREATED          STATUS          PORTS                                         NAMES
f8eafe761ada   m.daocloud.io/docker.io/prom/alertmanager:main      "/bin/alertmanager -…"   37 minutes ago   Up 37 minutes   0.0.0.0:9093->9093/tcp, [::]:9093->9093/tcp   alertmanager
e9059e4b093e   m.daocloud.io/docker.io/prom/prometheus:main        "/bin/prometheus --c…"   39 minutes ago   Up 39 minutes   127.0.0.1:9090->9090/tcp                      prometheus
b2d29afc5f8d   m.daocloud.io/docker.io/prom/node-exporter:master   "/bin/node_exporter …"   2 hours ago      Up 2 hours      0.0.0.0:9100->9100/tcp, [::]:9100->9100/tcp   pedantic_edison
(2)進入 node-exporter 通過命令 yes > /dev/null & 使 CPU 負載達到告警閥值
docker exec -it b2d29afc5f8d /bin/sh
b2d29afc5f8d $ yes > /dev/null &
b2d29afc5f8d $ yes > /dev/null &
b2d29afc5f8d $ yes > /dev/null &
b2d29afc5f8d $ yes > /dev/null &
...
b2d29afc5f8d $ yes > /dev/null &
b2d29afc5f8d $ yes > /dev/null &
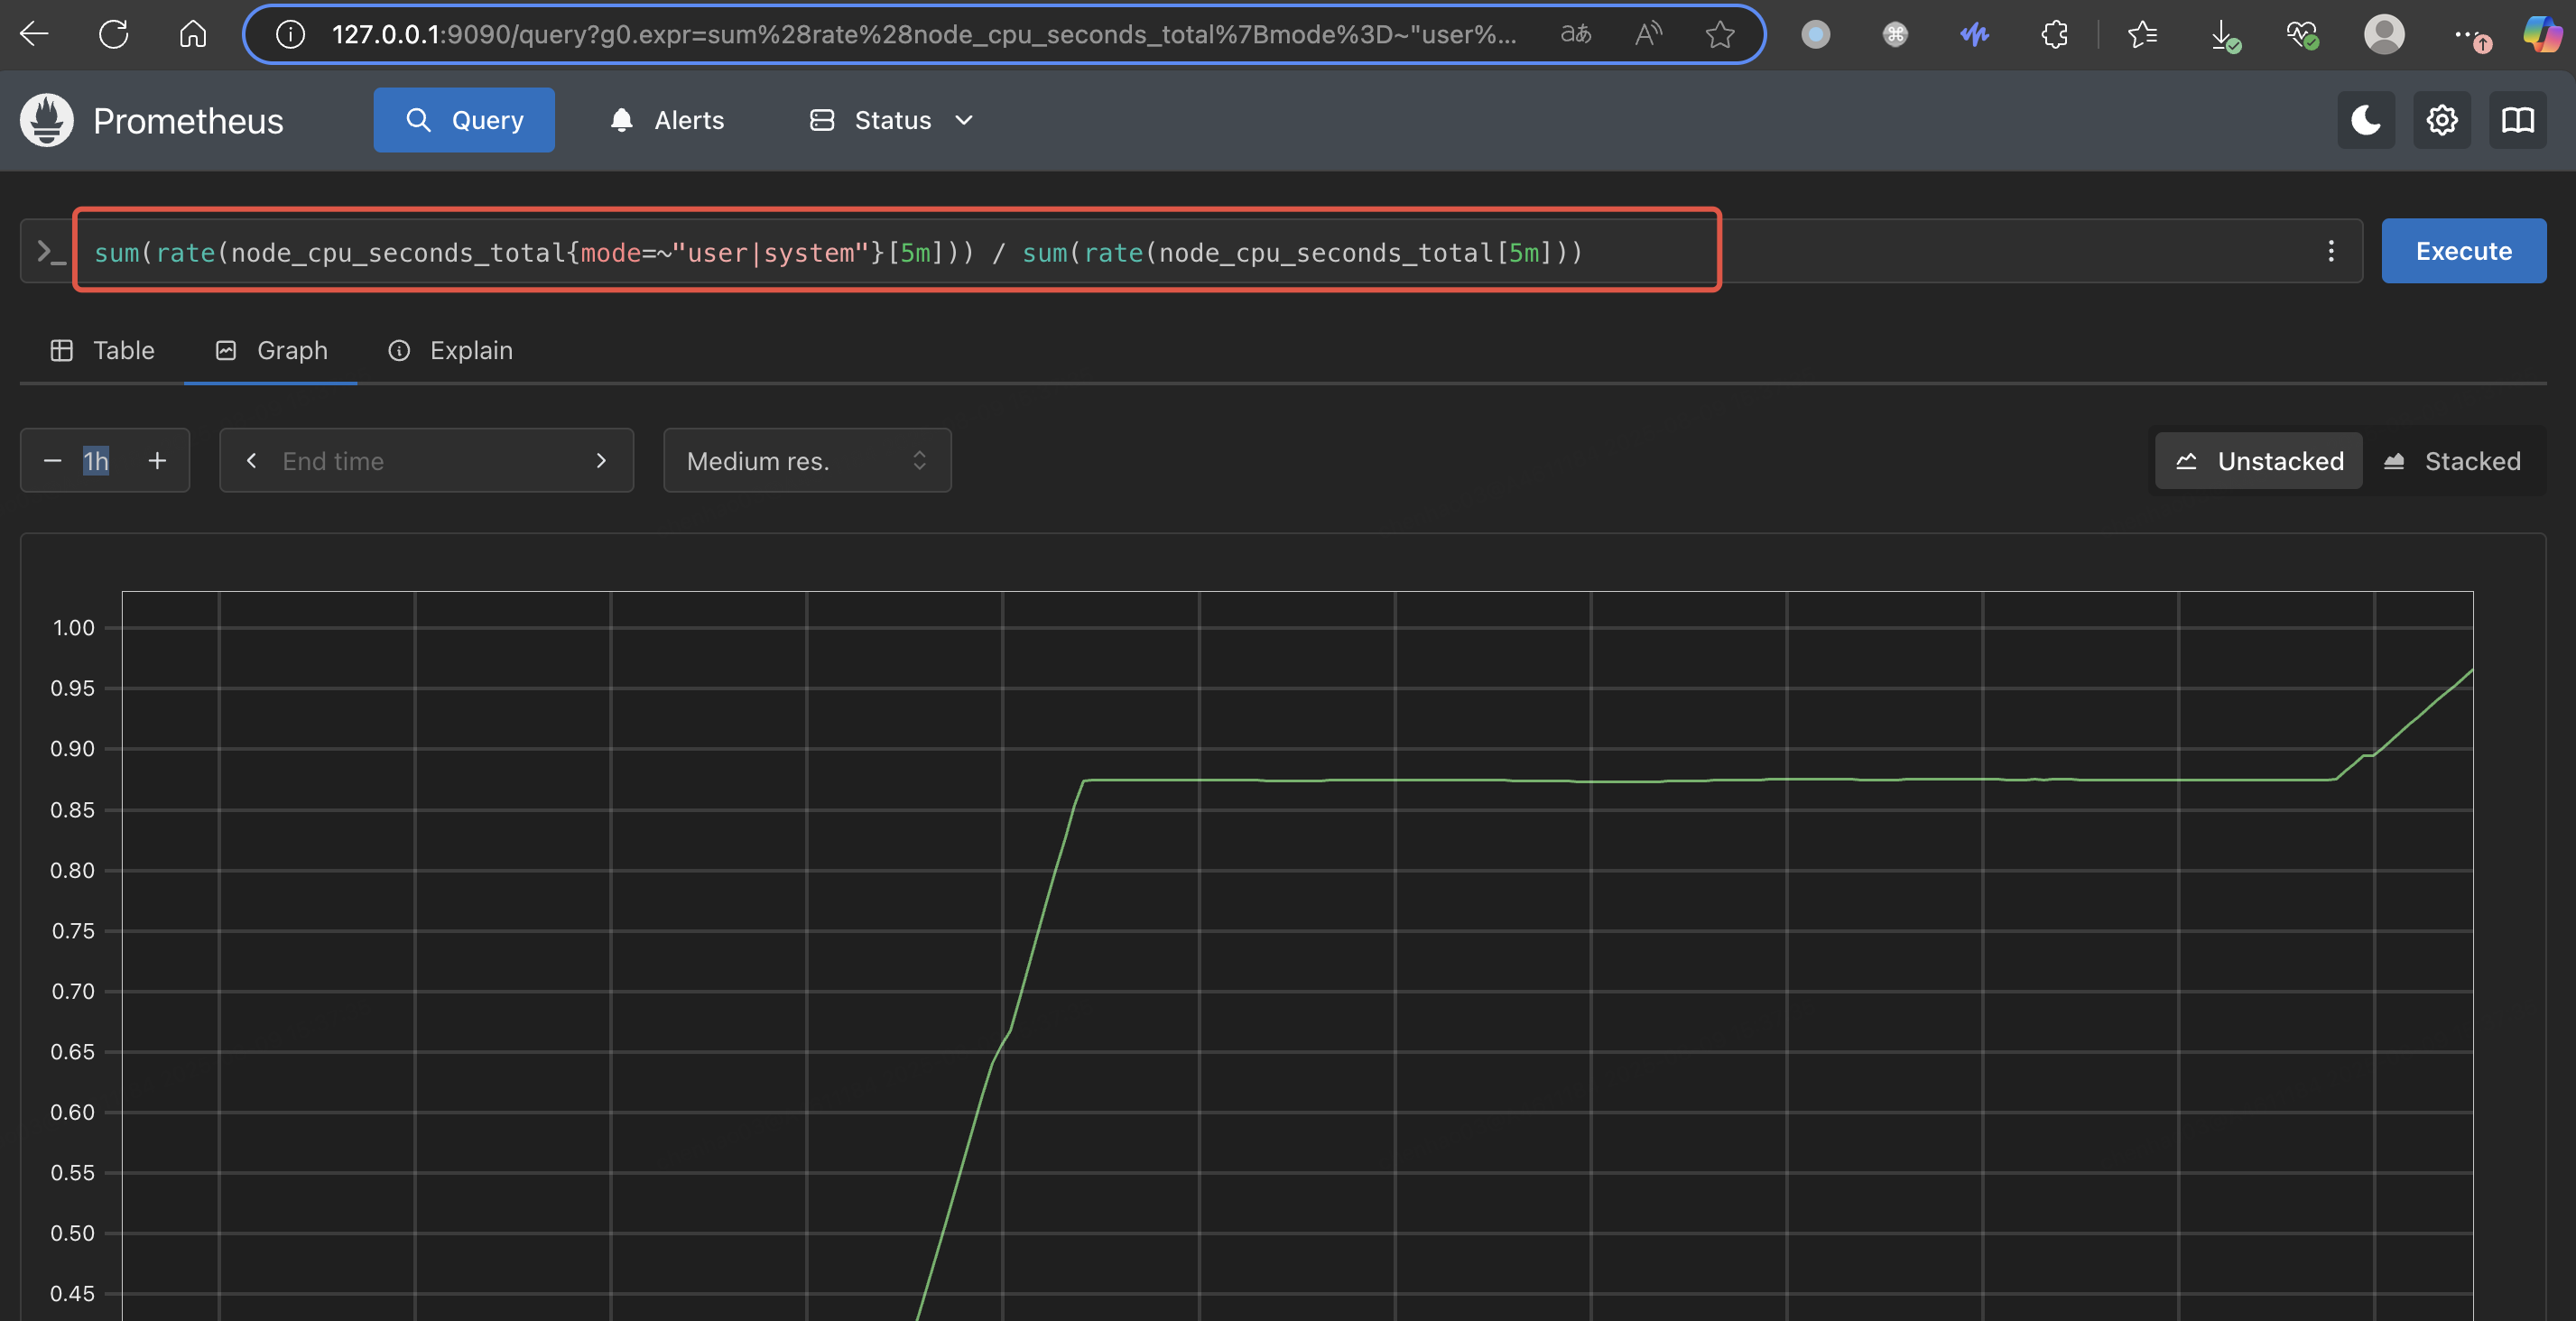
(3)然后訪問 192.168.1.8:9090 查看 CPU 使用率變化情況
查詢語句 sum(rate(node_cpu_seconds_total{mode=~"user|system"}[5m])) / sum(rate(node_cpu_seconds_total[5m]))
(4)點擊 Alerts 查看是否觸發告警
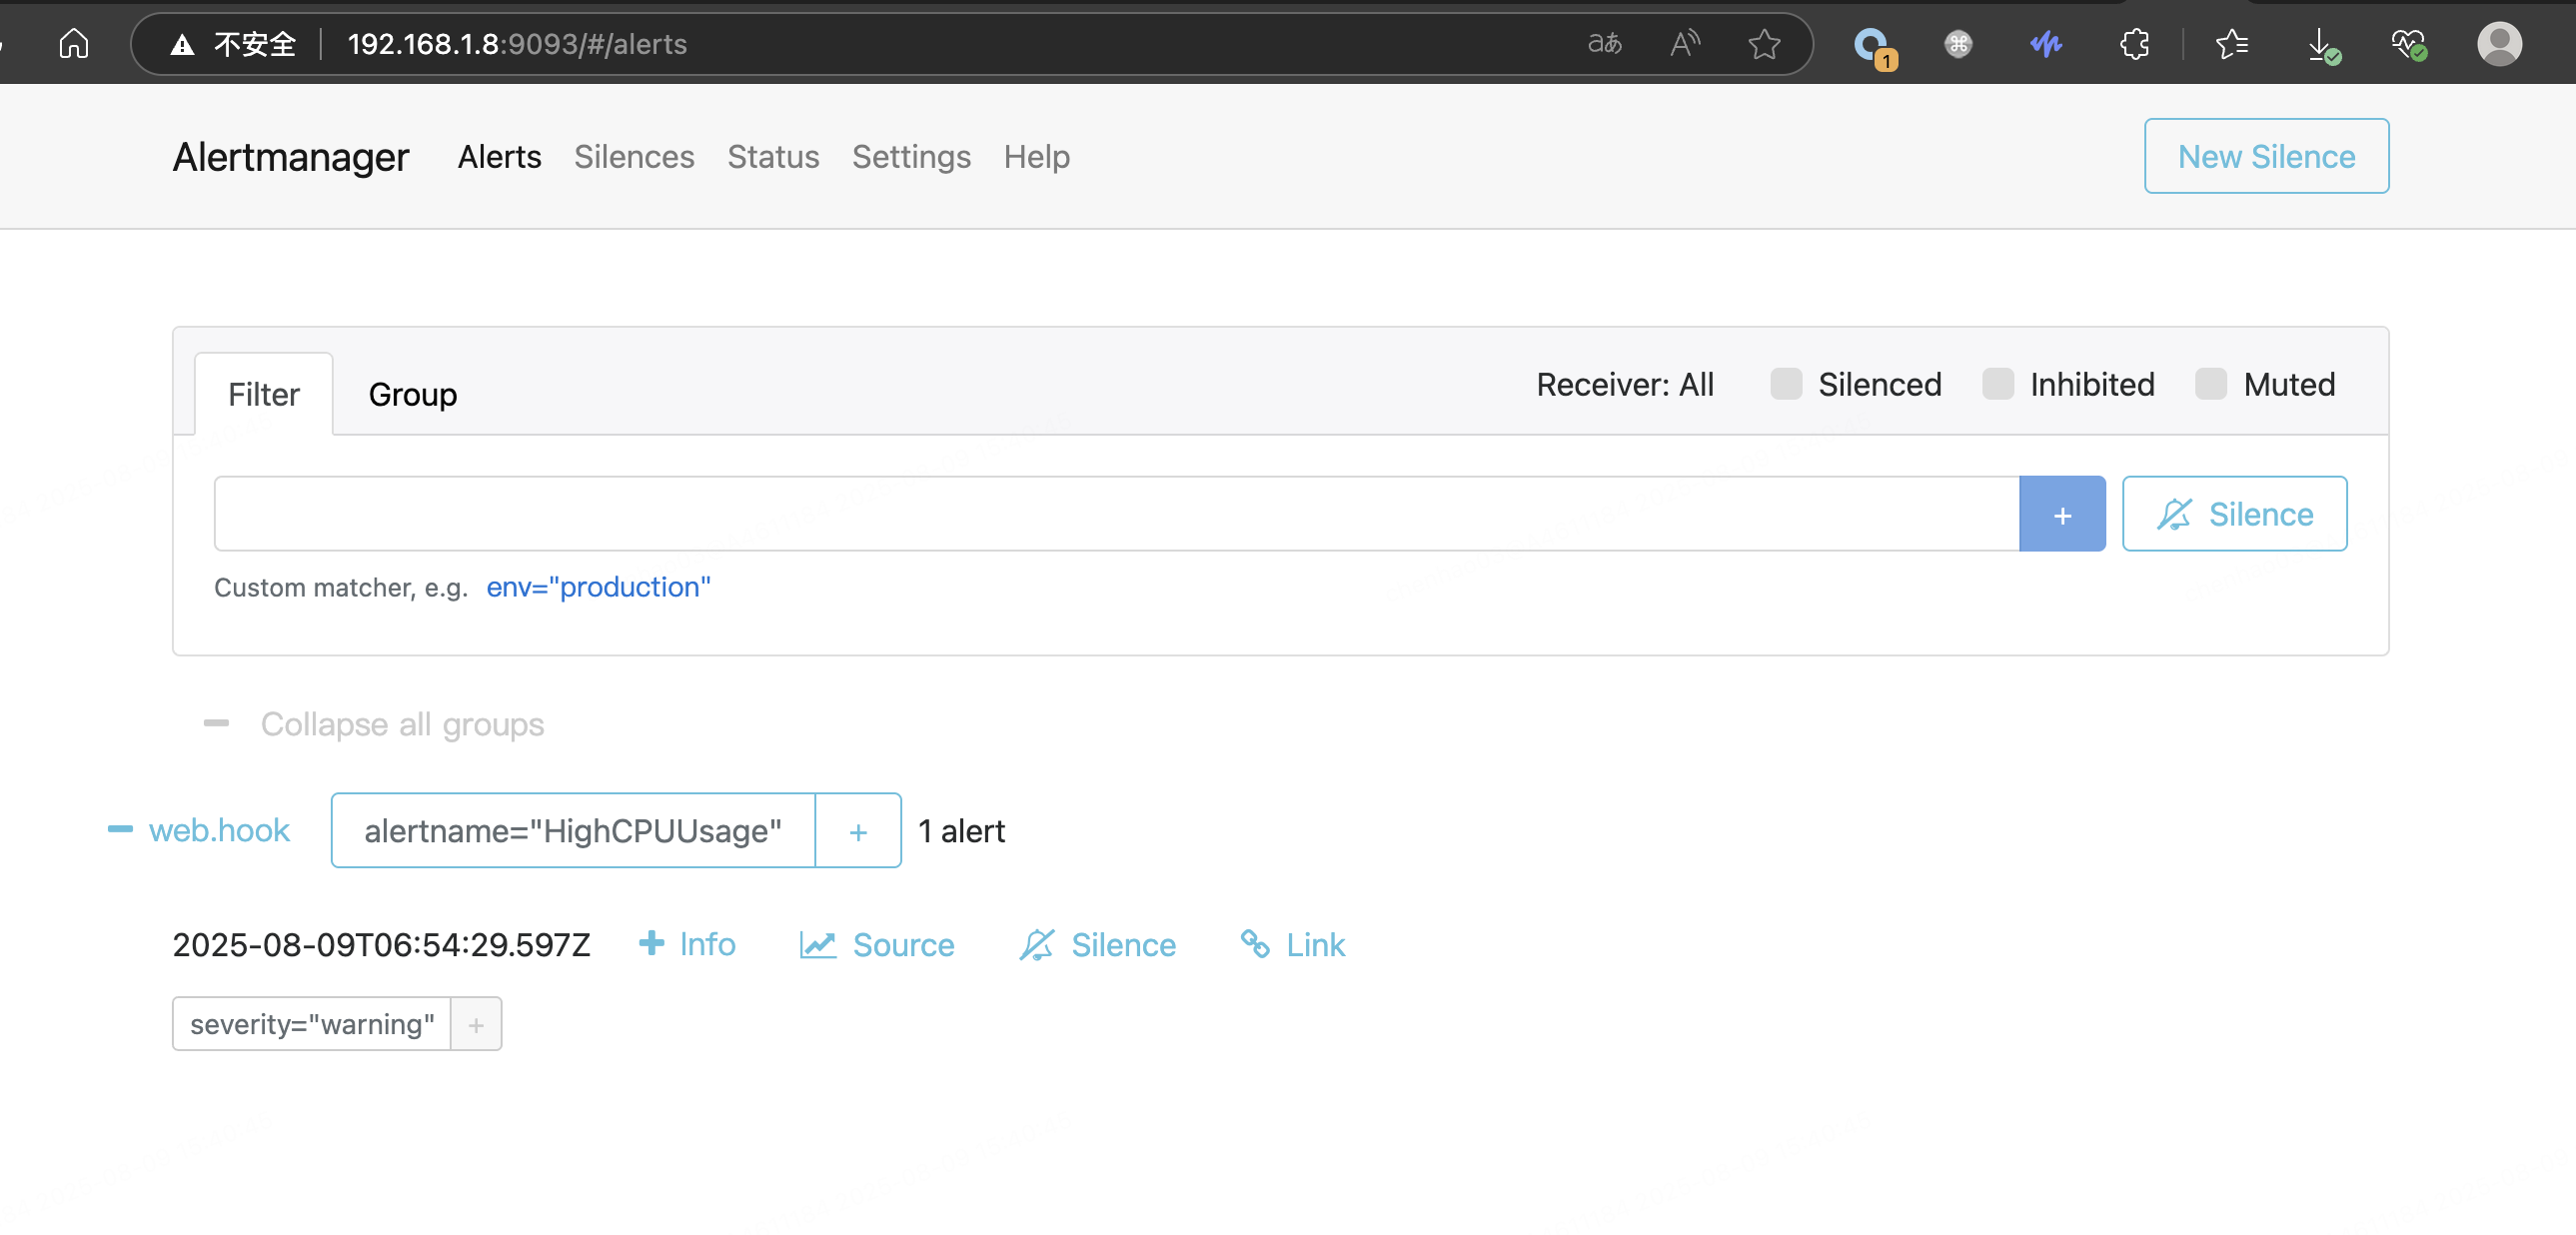
(5)訪問 192.168.1.8:9093 查看 Alertmanager 是否觸發告警 webhook
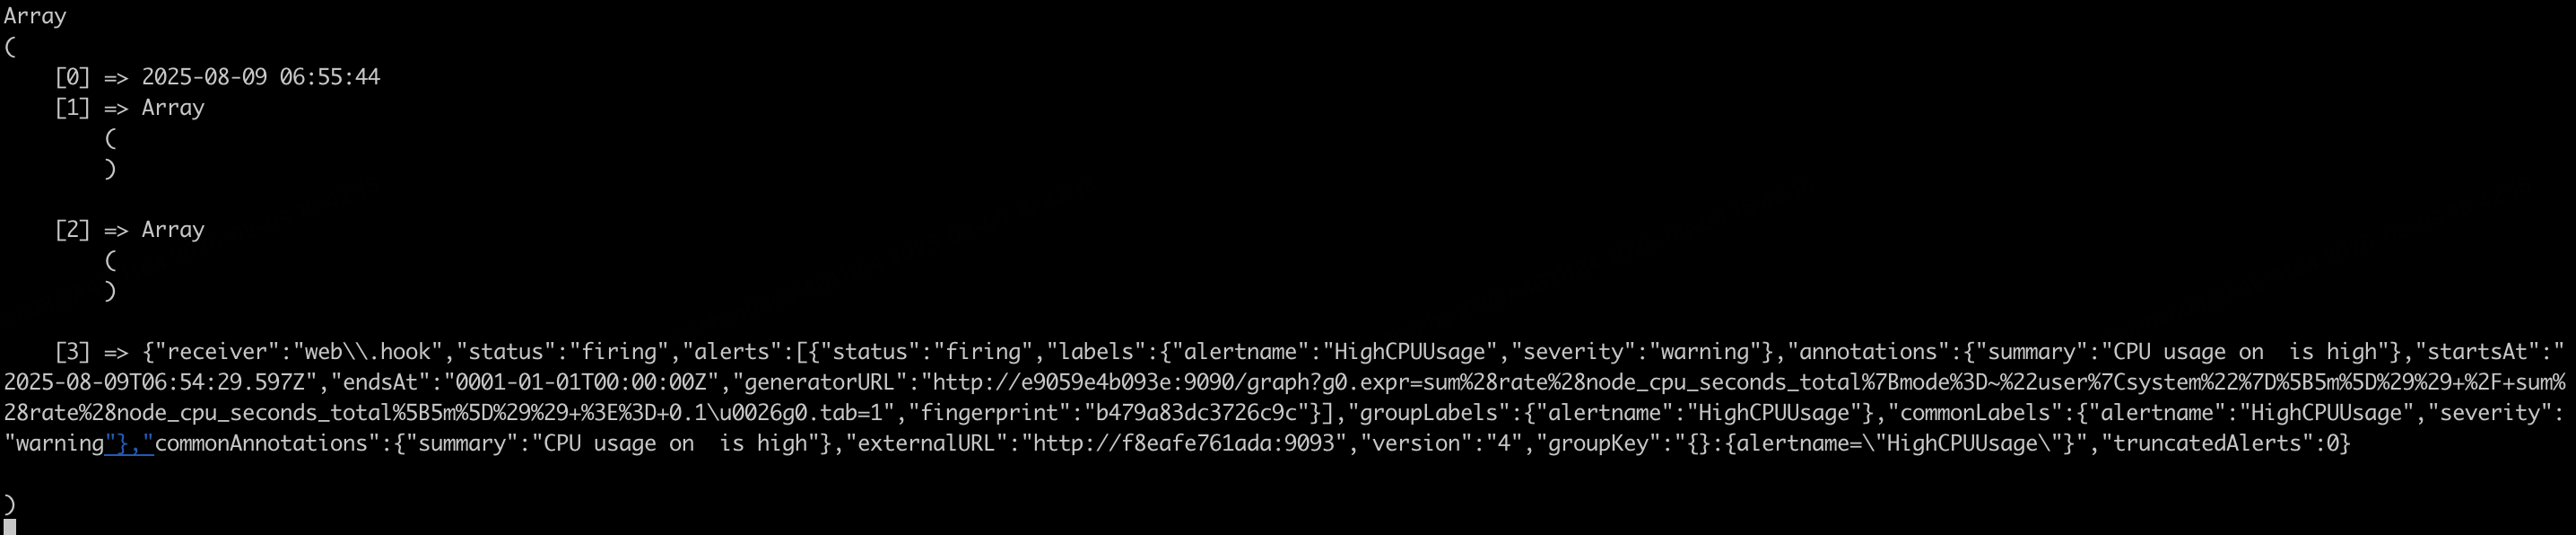
(6)在 webhook 接收端查看數據情況
cat debug.log(debug.log 由上述的 index.php 生成)
(7)其它
- 可根據接收到報文進行自定義處理(如通知到釘釘、企業微信等)
- Alertmanager 可以配置郵件告警,可參考官方文檔
)


![[Oracle] MAX()和MIN()函數](http://pic.xiahunao.cn/[Oracle] MAX()和MIN()函數)


![[激光原理與應用-203]:光學器件 - 增益晶體 - 增益晶體的使用方法](http://pic.xiahunao.cn/[激光原理與應用-203]:光學器件 - 增益晶體 - 增益晶體的使用方法)


)

——PowerShell與命令提示符)


