目錄
介紹
安裝Node Exporter
配置Prometheus
驗證配置
導入儀表盤
介紹
Prometheus是一款開源的監控和警報工具,而Node Exporter是Prometheus的一個官方插件,用于采集主機上的各種系統和硬件指標。
安裝Node Exporter
下載最新版本的Node Exporter二進制文件,可以在 Prometheus GitHub Releases 找到。
wget https://github.com/prometheus/node_exporter/releases/download/v1.7.0/node_exporter-1.7.0.linux-amd64.tar.gz解壓縮并將二進制文件移到你希望運行的位置。
tar -xzvf node_exporter-1.7.0.linux-amd64.tar.gz啟動Node Exporter:
./node_exporter或者將其作為服務運行,具體方式取決于你的操作系統。
配置Prometheus
在Prometheus的配置文件(通常為prometheus.yml)中添加Node Exporter的目標配置。
scrape_configs:------- job_name: 'node-exporter'static_configs:- targets: ['localhost:9100'] # Node Exporter的默認端口為9100重新啟動Prometheus以加載新的配置。
驗證配置
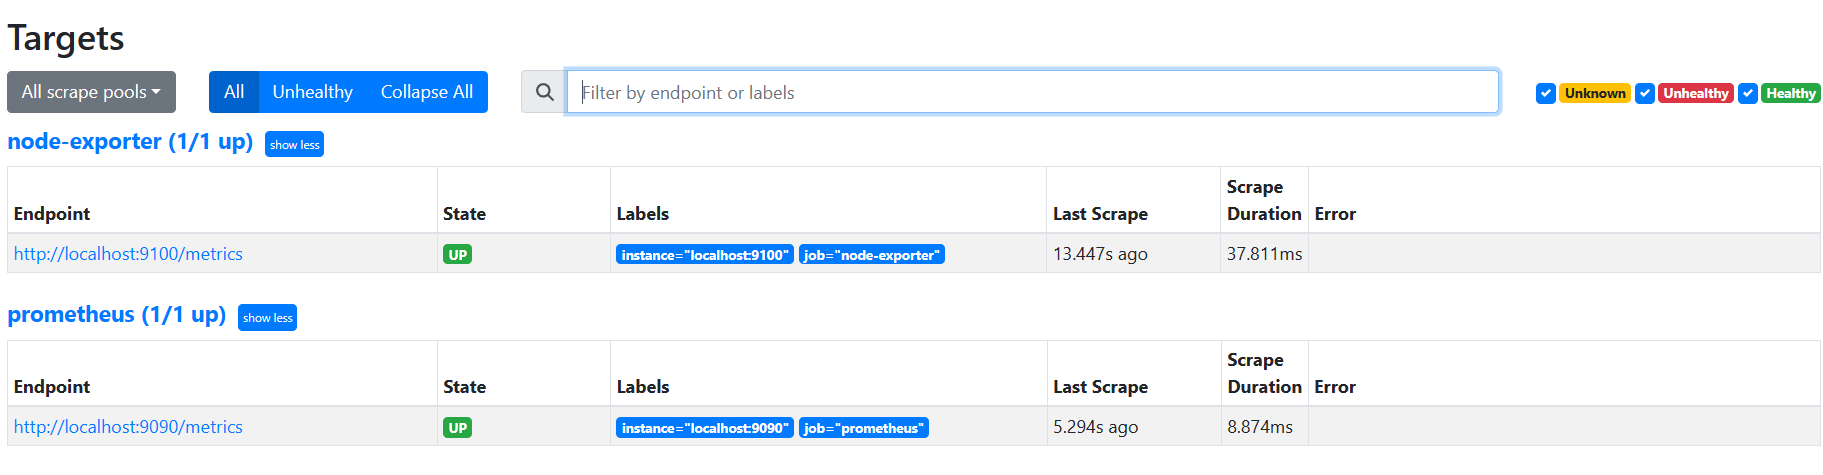
訪問Prometheus的Web界面(默認端口為9090):http://localhost:9090。
在"Targets"頁面,你應該看到一個名為"node-exporter"的目標,并且其狀態應為"UP"。
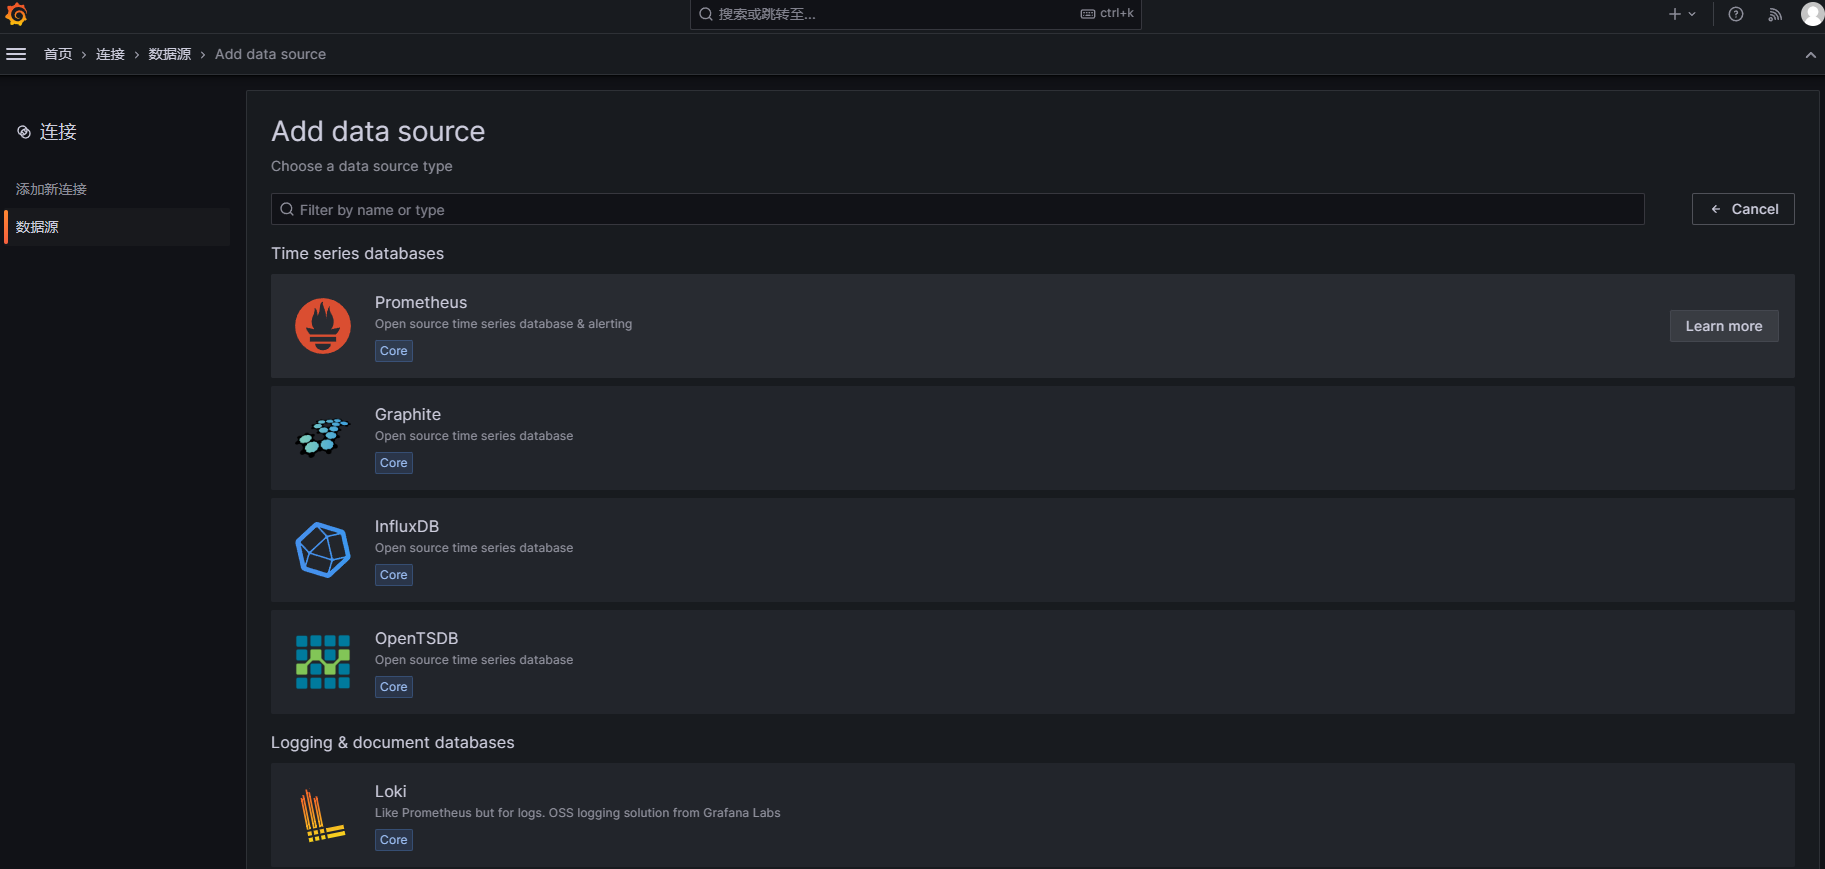
選擇 Prometheus 作為數據源類型。
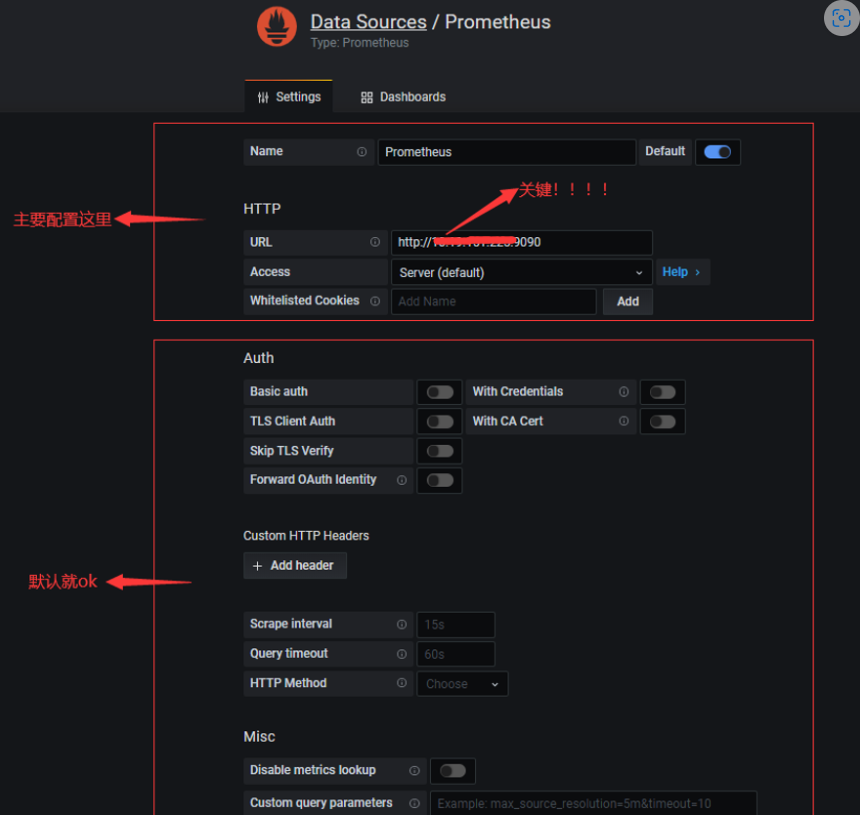
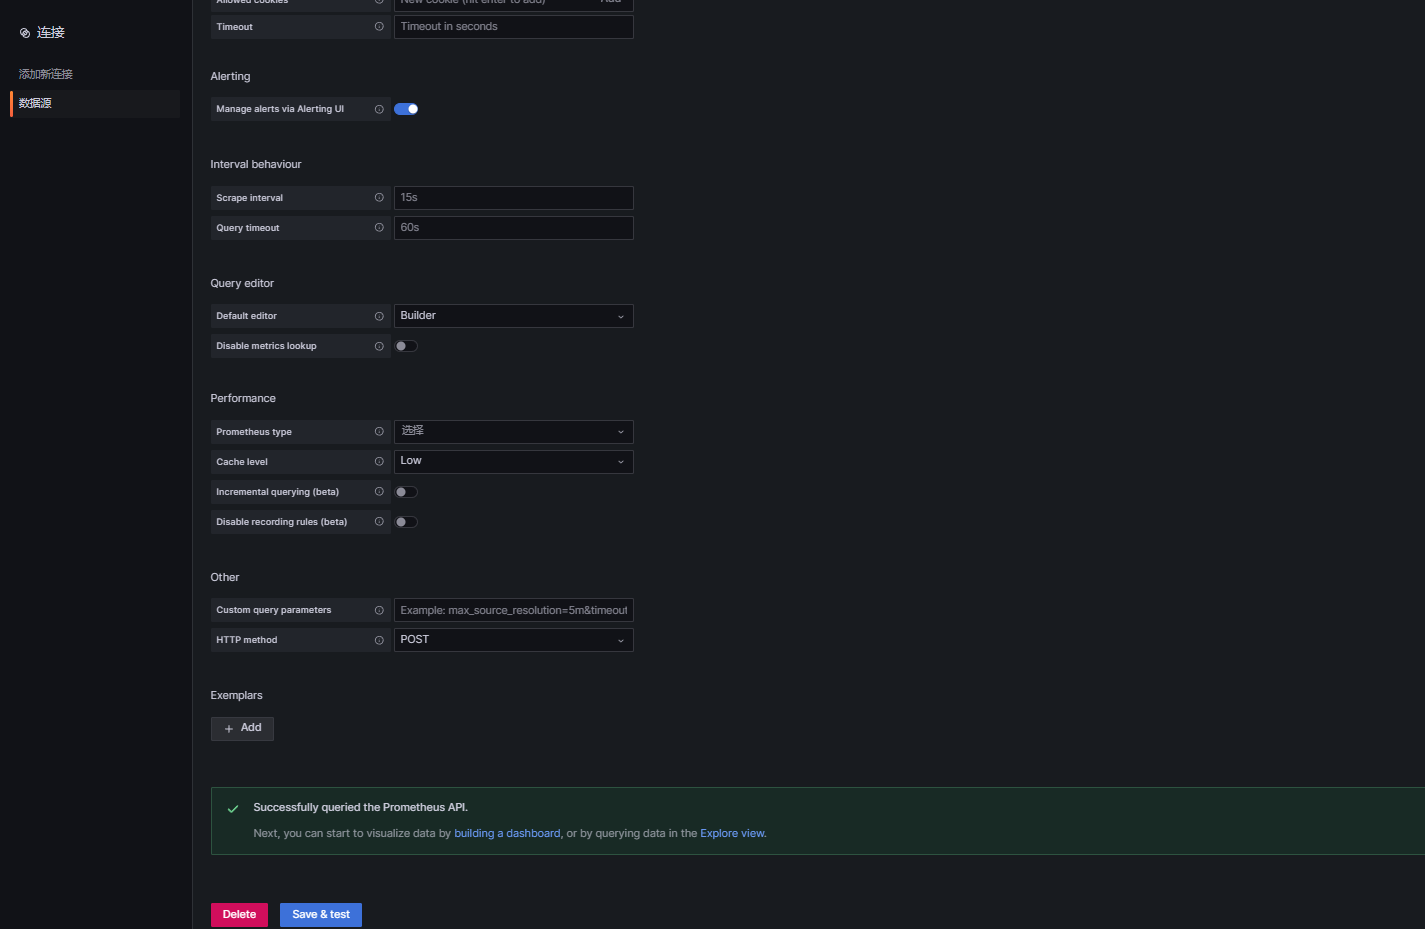
在 HTTP 部分配置 Prometheus 的地址,如:http://192.168.1.1:9090,然后點擊 "Save & Test" 驗證連接是否成功。
導入儀表盤
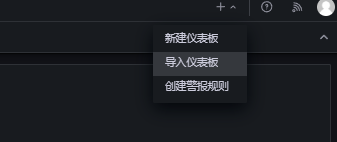
在左側菜單欄中選擇 "+",然后選擇 "導入儀表盤"。
在grafana.com/dashboards查找并導入常見應用程序的儀表板,官網(很多,不斷優化、迭代中)。
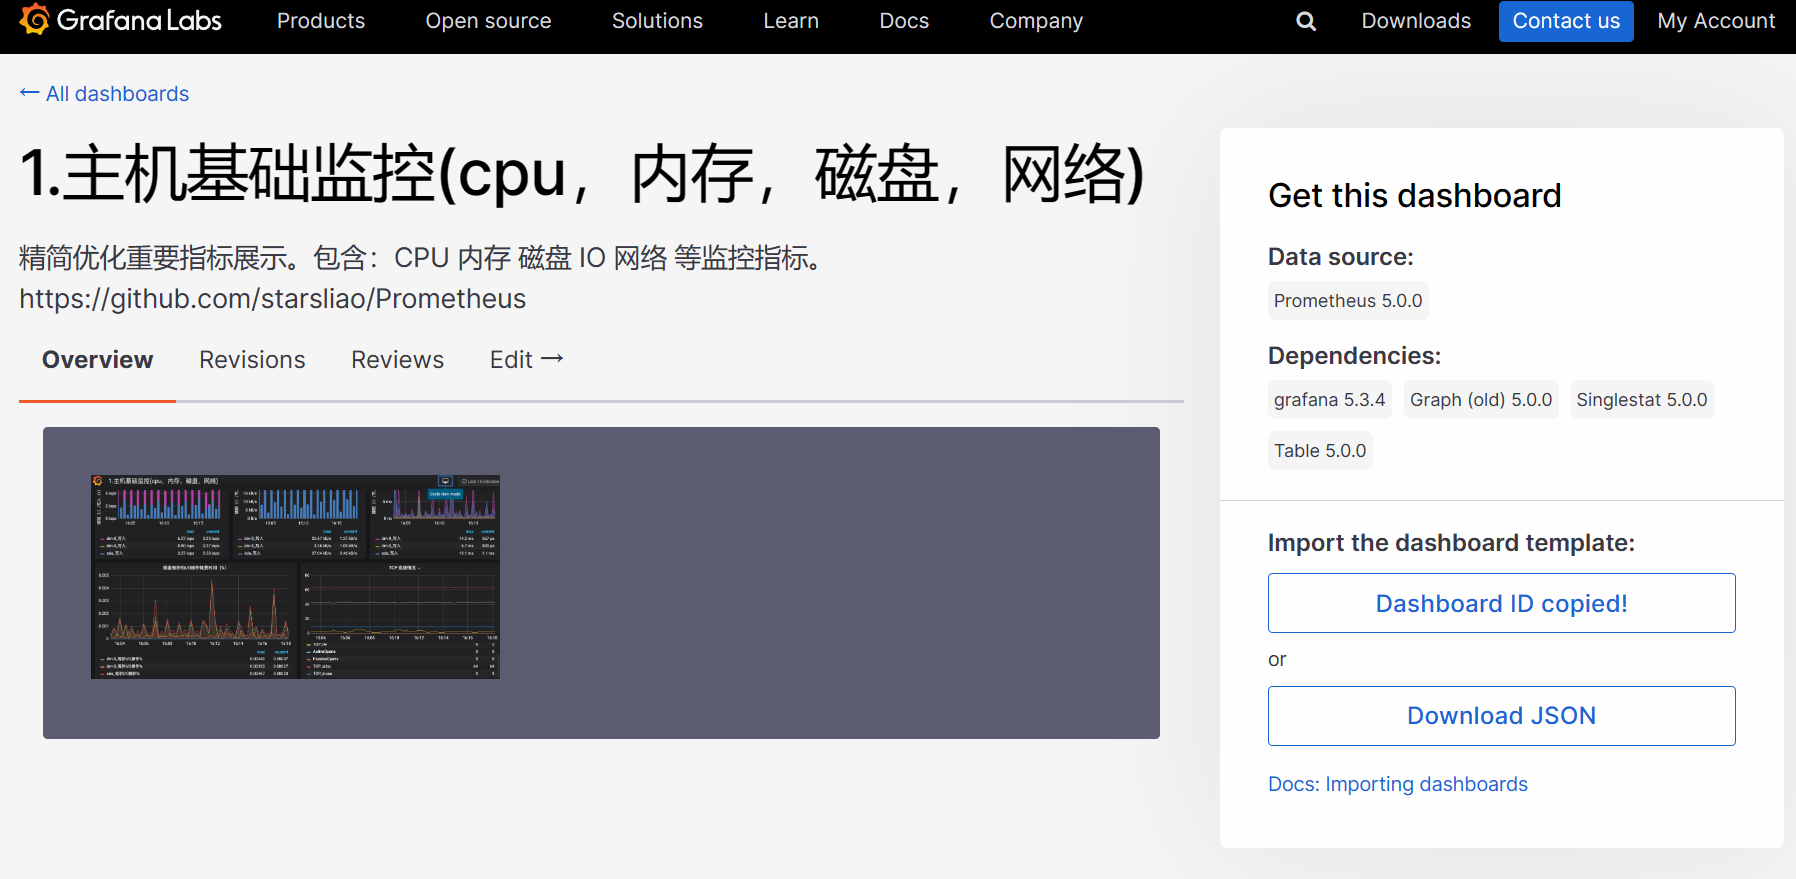
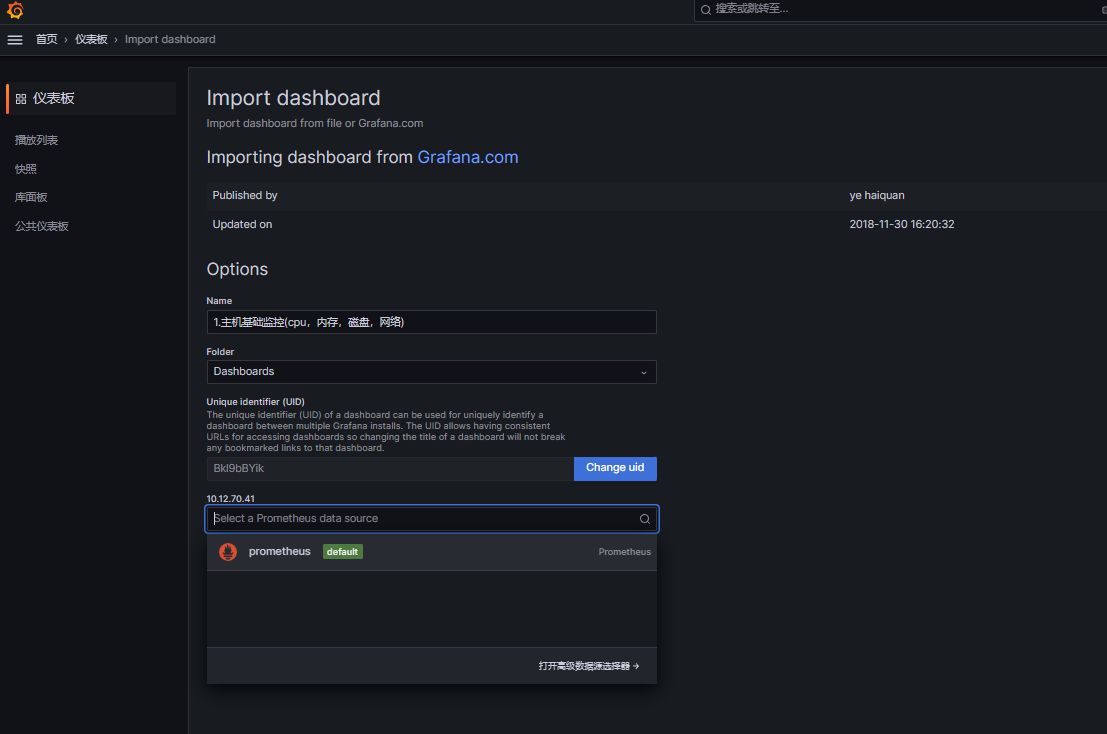
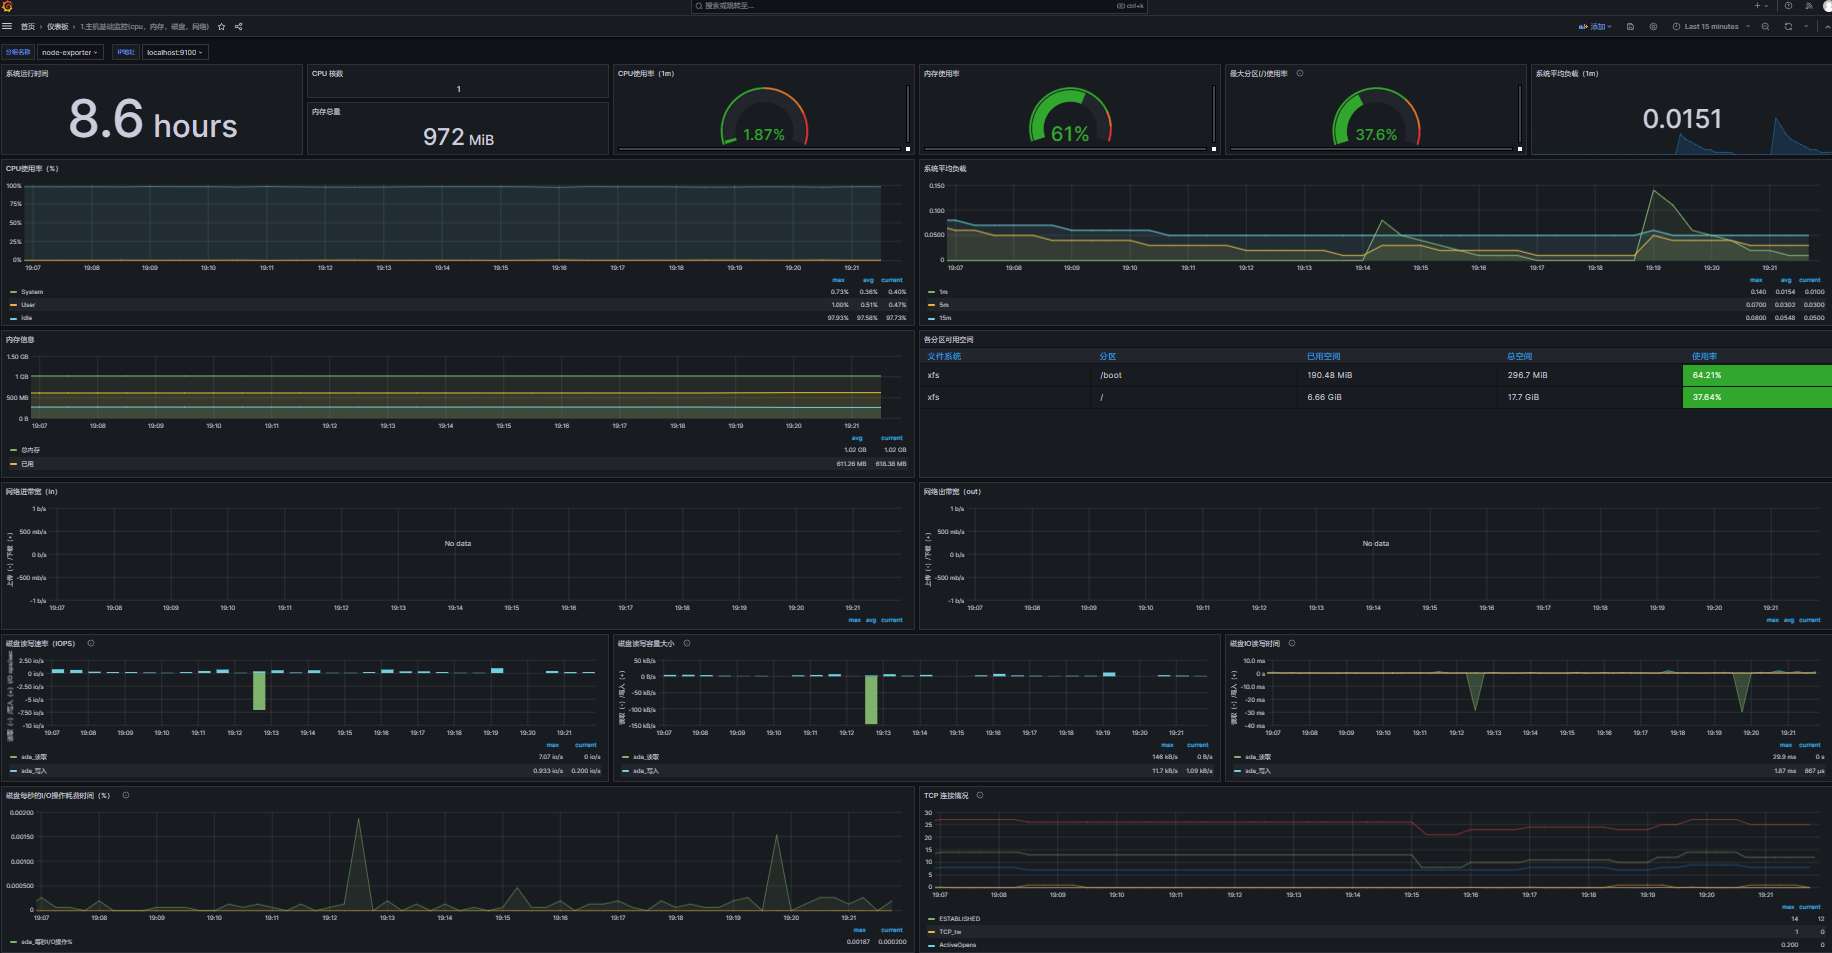
比如:主機基礎監控(cpu,內存,磁盤,網絡),導入儀表板模板:儀表板 ID 或 下載 JSON。
至此,Prometheus+Grafana 部署成功。
?

)

![P3110 [USACO14DEC] Piggy Back S](http://pic.xiahunao.cn/P3110 [USACO14DEC] Piggy Back S)


-日志)


詳解)
---string容器)


