重點關注文章第4部分
一、代碼模塊概覽
這一部分了解代碼主要實現的功能有哪些。
二、運行
這一部分關注如何跑通。
三、數據集
12個數據集(11個2D+1個3D)

對計算機而言,上述輸入、輸出維度大小是按次數定義的。

以“Vel,Fault和Style”系列為例,觀測系統設置是:
網格間距10m(Q:網格的作用是什么 A:一是建立數據和實際地球空間位置上的對應;二是方便數據處理。在實際勘探中,觀測點分布可能不均勻,對沒觀測到的地方通過插值填充,此外網格化有助于標準化地震數據處理流程,確保不同數據集之間的一致性和可比性。)
每條炮線的長度是700m,炮間距是140m——共5次放炮
每條接收線的長度是700m,由于檢波器間距是10m——共70個檢波點
總共的記錄時長是1s,每0.001s采樣一次,一共采樣1000次。
3.0數據加載
對于 Vel、Fault、Style 系列中的任何數據集,地震數據都保存為 .npy 文件,每個文件包含一批 500 個樣本。
datai.npy 指地震數據的 i-th 樣本,包含500個樣本。
注意:并不是i取值從1-500,而是每份第i個.npy文件都包含500個樣本。
import numpy as np
# load seismic data
seismic_data = np.load('data1.npy')
print(seismic_data.shape) #(500,5,1000,70)
# load velocity map
velocity_map = np.load('model1.npy')
print(velocity_map.shape) #(500,1,70,70)
Q:為什么加載的是data1.npy,地震數據的第1個樣本,注釋里print出來的卻是500個樣本?
A:歧義出現“地震數據的第1個樣本”,實際上是地震數據的第1個.npy文件,每個.npy文件都包含500個樣本。
the data is saved as .npy files, each file contains a batch of 500 samples. datai.npy refers to the i-th sample of seismic data
方式一:加載.npy文件的方法之一是可以通過.txt文件找位置。
3.1 與現有數據集特征的對比——文章第3部分
- Wenlong Wang and Jianwei Ma. Velocity model building in a crosswell acquisition geometry with image-trained artificial neural networks. Geophysics, 85(2):U31–U46, 2020.
- Bin Liu, Senlin Yang, Yuxiao Ren, Xinji Xu, Peng Jiang, and Yangkang Chen. Deep-learning seismic full-waveform inversion for realistic structural modelsdl seismic fwi. Geophysics, 86(1):R31–R44, 2021.
- Mauricio Araya-Polo, Joseph Jennings, Amir Adler, and Taylor Dahlke. Deep-learning tomography. The Leading Edge, 37(1):58–66, 2018.
- Fangshu Yang and Jianwei Ma. Deep-learning inversion: A next-generation seismic velocity model building method. Geophysics, 84(4):R583–R599, 2019.
- Yuxiao Ren, Lichao Nie, Senlin Yang, Peng Jiang, and Yangkang Chen. Building complex seismic velocity models for deep learning inversion. IEEE Access, 9:63767–63778, 2021.
- Zhicheng Geng, Zeyu Zhao, Yunzhi Shi, Xinming Wu, Sergey Fomel, and Mrinal Sen. Deep learning for velocity model building with common-image gather volumes. Geophysical Journal International, 228(2):1054–1070, 2022.
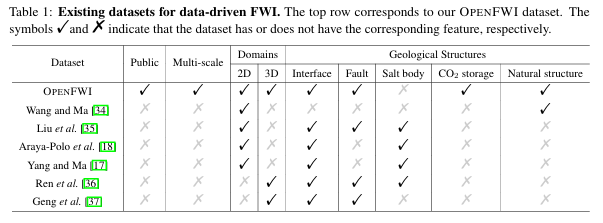
地質結構
- 界面 Mrinal K Sen. Seismic inversion. Society of Petroleum Engineers Richardson, TX, 2006.
- 斷層 Mauricio Araya-Polo, Taylor Dahlke, Charlie Frogner, Chiyuan Zhang, Tomaso Poggio, and Detlef Hohl. Automated fault detection without seismic processing. The Leading Edge, 36(3):208–214, 2017.
- 多樣性 Hui Li, Jing Lin, Baohai Wu, Jinghuai Gao, and Naihao Liu. Elastic properties estimation from prestack seismic data using ggcnns and application on tight sandstone reservoir characterization. IEEE Transactions on Geoscience and Remote Sensing, 60:1–21, 2021.
速度圖是從三個來源生成的:數學函數、自然圖像和地質儲層。
這一特性顯著增強了速度圖的多樣性和通用性。
數據生成流程:
-
生成速度圖的數學公式:

(f是用于模擬斷層的隨機線性函數) -
風格遷移的數學公式:

3.2 基準方法對比——文章第4部分
- InversionNet:
Yue Wu and Youzuo Lin. InversionNet: An efficient and accurate data-driven full waveform inversion. IEEE Transactions on Computational Imaging, 6:419–433, 2019. - VelocityGAN:
Zhongping Zhang and Youzuo Lin. Data-driven seismic waveform inversion: A study on the robustness and generalization. IEEE Transactions on Geoscience and Remote sensing,
58(10):6900–6913, 2020. - UPFWI:
Peng Jin, Xitong Zhang, Yinpeng Chen, Sharon Huang, Zicheng Liu, and Youzuo Lin. Unsurpervised learning of full-waveform inversion: Connecting CNN and partial differential equation in a loop. In Proc. Tenth International Conference on Learning Representations (ICLR), 2022. - InversionNet3D:
Qili Zeng, Shihang Feng, Brendt Wohlberg, and Youzuo Lin. InversionNet3D: Efficient and scalable learning for 3-D full-waveform inversion. IEEE Transactions on Geoscience and Remote Sensing, 60:1–16, 2022.
3.3 OpenFWI數據集(對于Vel和Fault系列)的復雜性度量——文章第5部分
- 復雜度指標1:熵
- 復雜度指標2:空間信息度
- 復雜度指標3:梯度稀疏指數
以上3個指標都是指標越大,越復雜。
四、效果展現
圖5:復雜度指標(橫軸——實際的速度圖模型復雜度)和SSIM(縱軸——反演預測出來的速度圖圖像質量)之間的關系(映射)
(為什么要把模型復雜度評價指標和圖像質量評價指標SSIM進行比較?)
觀察隨著目標反演的數據集變化,即速度圖復雜度的變化,反演輸出圖像(速度圖)質量的變化。
左圖:以復雜度指標2為橫軸,把Vel和Fault系列的8個數據集定量刻畫在橫軸上,經網絡反演后的結果分別用SSIM度量。發現隨著標簽的復雜度增大,反演預測的圖像質量也在下降。
M思考:3張圖分別從不同的方面定量刻畫標簽復雜度:發現數據集的反演效果隨熵(整體復雜度)增加變化不大,若是局部指標(像空間信息或梯度稀疏指數)變化,則對反演效果影響較大。說明描述數據集的重要屬性是梯度稀疏指數。
不論哪個指標描述標簽復雜度的變化,3張圖像都反映了SSIM下降的趨勢
因此得出結論:復雜的速度圖更難從地震數據中反演。
下一步工作:
結合代碼,加深對網絡參數的理解,完善一、二的學習內容


FFT、機械特性、閉環、慣量、剛性、抑制振動)


—— Git常用命令)

)


