文章目錄
- 前言
- CommonChart組件
- 1. 功能分析
- 2. 代碼+詳細注釋
- 3. 使用到的全局hook代碼
- 4. 使用方式
- 5. 效果展示
- 總結
前言
Echarts圖表在項目中經常用到,然而,重復編寫初始化,更新,以及清除實例等動作對于開發人員來說是一種浪費時間和精力。因此,在這篇文章中,將封裝一個 “高性能可配置Echarts組件” ,簡化開發的工作流程,提高數據可視化的效率和質量。
CommonChart組件
1. 功能分析
(1)可以渲染多種類型的圖表,包括折線圖、柱狀圖、餅圖、地圖和散點圖
(2)通過傳入的 option 屬性,配置圖表的各種參數和樣式
(4)通過傳入的 onClick 屬性,處理圖表元素的點擊事件
(5)通過傳入的 notMerge 屬性,控制是否合并圖表配置
(6)通過傳入的 lazyUpdate 屬性,控制是否懶渲染圖表
(7)通過傳入的 style 屬性,設置圖表容器的樣式
(8)通過傳入的 className 屬性,自定義圖表容器的額外類名
(9)通過監聽窗口大小變化,自動調整圖表的大小
(10)使用 usePrevious、useWindowResize 和 useEffect 等鉤子來提高組件性能并避免不必要的渲染
2. 代碼+詳細注釋
// @/components/Echarts/commom/index.tsx
import { useRef, useEffect, CSSProperties } from "react";
// 引入 Echarts 的各種圖表組件和組件配置,后續備用
import "echarts/lib/chart/line"; // 折線圖
import "echarts/lib/chart/bar"; // 柱狀圖
import "echarts/lib/chart/pie"; // 餅圖
import "echarts/lib/chart/map"; // 地圖
import "echarts/lib/chart/scatter"; // 散點圖
import "echarts/lib/component/tooltip"; // 提示框組件
import "echarts/lib/component/title"; // 標題組件
import "echarts/lib/component/legend"; // 圖例組件
import "echarts/lib/component/markLine"; // 標線組件
import "echarts/lib/component/dataZoom"; // 數據區域縮放組件
import "echarts/lib/component/brush"; // 刷選組件
// 引入 Echarts 的類型聲明
import * as echarts from "echarts";
import { ECharts, EChartOption } from "echarts";
// 引入自定義的鉤子函數和公共函數
import { useWindowResize, usePrevious } from "@/hooks";
import { isDeepEqual } from "@/utils";
/*** 公共 Echarts 業務靈巧組件,可在項目中重復使用** @param {Object} props - 組件屬性* @param {EChartOption} props.option - Echarts 配置項* @param {Function} [props.onClick] - 點擊事件處理函數* @param {boolean} [props.notMerge=false] - 是否不合并數據* @param {boolean} [props.lazyUpdate=false] - 是否懶渲染* @param {CSSProperties} [props.style] - 組件樣式* @param {string} [props.className] - 組件類名* @returns {JSX.Element} - React 組件*/
type Props = {option: EChartOption;onClick?: (param: echarts.CallbackDataParams) => void;notMerge?: boolean;lazyUpdate?: boolean;style?: CSSProperties;className?: string;
};
const CommonChart = (props: Props) => {// 解構屬性,并設置默認值const {option,onClick, // 點擊事件處理函數notMerge = false, // 是否不合并數據,默認為 falselazyUpdate = false, // 是否懶渲染,默認為 falsestyle, // 組件樣式className = "", // 組件類名,默認為空字符串} = props;// 創建 ref 來引用 div 元素,并初始化 chartInstanceRef 為 nullconst chartRef = useRef<HTMLDivElement>(null);const chartInstanceRef = useRef<ECharts | null>(null);// 使用 usePrevious 鉤子函數來記錄上一次的 option 和 onClick 值const prevOption = usePrevious(option);const prevClickEvent = usePrevious(onClick);useEffect(() => {// 定義一個變量來存儲圖表實例let chartInstance: ECharts | null = null;if (chartRef.current) {// 如果圖表實例不存在,則初始化if (!chartInstanceRef.current) {const hasRenderInstance = echarts.getInstanceByDom(chartRef.current);if (hasRenderInstance) {hasRenderInstance.dispose();}chartInstanceRef.current = echarts.init(chartRef.current);}// 暫存當前的圖表實例chartInstance = chartInstanceRef.current;// 如果 option 或 onClick 值發生變化,則重新渲染try {if (!isDeepEqual(prevOption, option, ["formatter"])) {chartInstance.setOption(option, { notMerge, lazyUpdate });}if (onClick && typeof onClick === "function" && onClick !== prevClickEvent) {chartInstance.on("click", onClick);}} catch (error) {chartInstance && chartInstance.dispose();}}}, [option, onClick, notMerge, lazyUpdate, prevOption, prevClickEvent]);// 監聽窗口大小變化,當窗口大小變化時,重新渲染圖表useWindowResize(() => {if (chartInstanceRef.current) {chartInstanceRef.current?.resize();}});return <div style={{ ...style }} className={className} ref={chartRef}></div>;
};export { CommonChart };
3. 使用到的全局hook代碼
// @/utils/index
// 深度判斷兩個對象某個屬性的值是否相等
export const isDeepEqual = (left: any, right: any, ignoredKeys?: string[]): boolean => {const equal = (a: any, b: any): boolean => {if (a === b) return trueif (a && b && typeof a === 'object' && typeof b === 'object') {if (a.constructor !== b.constructor) return falselet lengthlet iif (Array.isArray(a)) {length = a.lengthif (length !== b.length) return falsefor (i = length; i-- !== 0;) {if (!equal(a[i], b[i])) return false}return true}if (a instanceof Map && b instanceof Map) {if (a.size !== b.size) return falsefor (i of a.entries()) {if (!b.has(i[0])) return false}for (i of a.entries()) {if (!equal(i[1], b.get(i[0]))) return false}return true}if (a instanceof Set && b instanceof Set) {if (a.size !== b.size) return falsefor (i of a.entries()) if (!b.has(i[0])) return falsereturn true}if (a.constructor === RegExp) return a.source === b.source && a.flags === b.flagsif (a.valueOf !== Object.prototype.valueOf) return a.valueOf() === b.valueOf()if (a.toString !== Object.prototype.toString) return a.toString() === b.toString()const keys = Object.keys(a)length = keys.lengthif (length !== Object.keys(b).length) return falsefor (i = length; i-- !== 0;) {if (!Object.prototype.hasOwnProperty.call(b, keys[i])) return false}for (i = length; i-- !== 0;) {const key = keys[i]if (key === '_owner' && a.$$typeof) {// Reactcontinue}if (ignoredKeys && ignoredKeys.includes(key)) {continue}if (!equal(a[key], b[key])) return false}return true}// eslint-disable-next-line no-self-comparereturn a !== a && b !== b}return equal(left, right)
}
--------------------------------------------------------------------------
// @/hooks/index.ts
/*** Returns the value of the argument from the previous render* @param {T} value* @returns {T | undefined} previous value* @see https://react-hooks-library.vercel.app/core/usePrevious*/
export function usePrevious<T>(value: T): T | undefined {const ref = useRef<T>()useEffect(() => {ref.current = value}, [value])return ref.current
}export function useWindowResize(callback: (event: UIEvent) => void) {useEffect(() => {window.addEventListener('resize', callback)return () => window.removeEventListener('resize', callback)}, [callback])
}
4. 使用方式
// 引入組件和echarts
import { CommonChart } from "@/components/Echarts/common";
import echarts from "echarts/lib/echarts";
// 使用
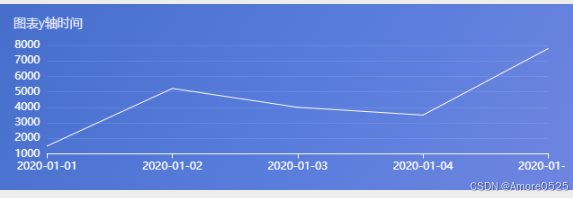
const useOption = () => {return (data: any): echarts.EChartOption => {return {color: ["#ffffff"],title: {text: "圖表y軸時間",textAlign: "left",textStyle: {color: "#ffffff",fontSize: 12,fontWeight: "lighter",fontFamily: "Lato",},},grid: {left: "2%",right: "3%",top: "15%",bottom: "2%",containLabel: true,},xAxis: [{axisLine: {lineStyle: {color: "#ffffff",width: 1,},},data: data.map((item: any) => item.xTime),axisLabel: {formatter: (value: string) => value,},boundaryGap: false,},],yAxis: [{position: "left",type: "value",scale: true,axisLine: {lineStyle: {color: "#ffffff",width: 1,},},splitLine: {lineStyle: {color: "#ffffff",width: 0.5,opacity: 0.2,},},axisLabel: {formatter: (value: string) => new BigNumber(value),},boundaryGap: ["5%", "2%"],},{position: "right",type: "value",axisLine: {lineStyle: {color: "#ffffff",width: 1,},},},],series: [{name: t("block.hash_rate"),type: "line",yAxisIndex: 0,lineStyle: {color: "#ffffff",width: 1,},symbol: "none",data: data.map((item: any) => new BigNumber(item.yValue).toNumber()),},],};};
};
const echartData = [{ xTime: "2020-01-01", yValue: "1500" },{ xTime: "2020-01-02", yValue: "5220" },{ xTime: "2020-01-03", yValue: "4000" },{ xTime: "2020-01-04", yValue: "3500" },{ xTime: "2020-01-05", yValue: "7800" },
];
const parseOption = useOption();
<CommonChartoption={parseOption(echartData, true)}notMergelazyUpdatestyle={{height: "180px",}}
></ChartBlock>
5. 效果展示
總結
下一篇講【首頁響應式搭建以及真實數據渲染】。關注本欄目,將實時更新。


關于基礎資料/單據實體的id)

、重定義(同名隱藏)的區別 (超詳解))

)

![和Bug較勁的第n天:[Error: Unable to open snapshot file: No such file or directory]](http://pic.xiahunao.cn/和Bug較勁的第n天:[Error: Unable to open snapshot file: No such file or directory])


