目錄
環境準備
? ? ? ? 下載 kube-prometheus 軟件包
? ? ? ? 下載prometheus 鏡像
master節點
master節點導入prometheus軟件包
解壓
node節點
node節點導入鏡像
解壓
從tar包中加載鏡像
部署 prometheus
修改映射端口
提交
查看pod
pod和svc正常啟動
deployment
daemonset
service
刪除影響外部訪問的pod資源
網頁訪問
環境準備
? ? ? ? 下載 kube-prometheus 軟件包
? ? ? ? 下載prometheus 鏡像
master節點
master節點導入prometheus軟件包
[root@k8s-master ~]# mkdir prometheus
[root@k8s-master ~]# cd prometheus/
[root@k8s-master prometheus]# ls
kube-prometheus-0.13.0.zip
解壓
[root@k8s-master prometheus]# unzip kube-prometheus-0.13.0.zip
Archive:  kube-prometheus-0.13.0.zip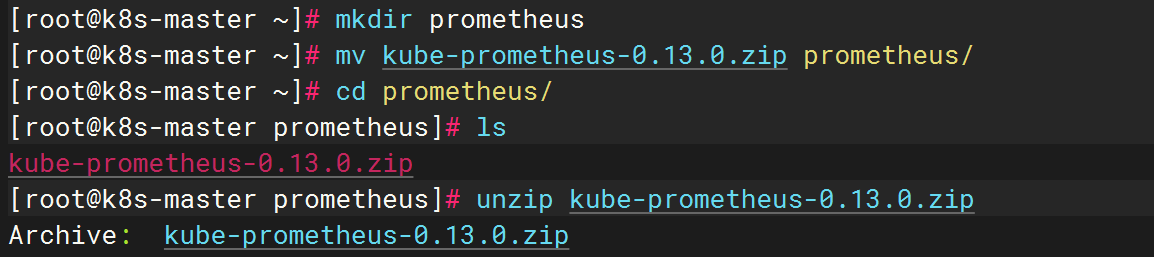
node節點
node節點導入鏡像
[root@k8s-node1 ~]# mkdir prometheus
[root@k8s-node1 ~]# cd prometheus/
[root@k8s-node1 prometheus]# rz
rz waiting to receive.**[root@k8s-node1 prometheus]# ls
prometheus.zip
解壓
[root@k8s-node1 prometheus]# unzip prometheus.zip
Archive:  prometheus.zipinflating: prometheus.tar
從tar包中加載鏡像
[root@k8s-node1 prometheus]# ls
prometheus.tar  prometheus.zip
[root@k8s-node1 prometheus]# docker load -i prometheus.tar 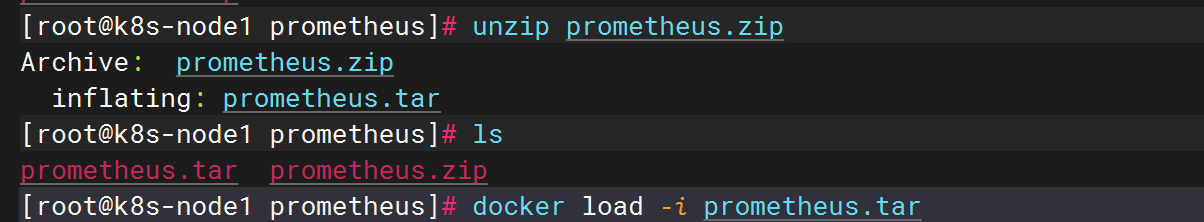
部署 prometheus
修改映射端口
[root@k8s-master manifests]# vim prometheus-service.yaml
[root@k8s-master manifests]# vim grafana-service.yaml
[root@k8s-master manifests]# vim alertmanager-service.yaml
以上配置文件分別增加如下配置:
spec:type: NodePort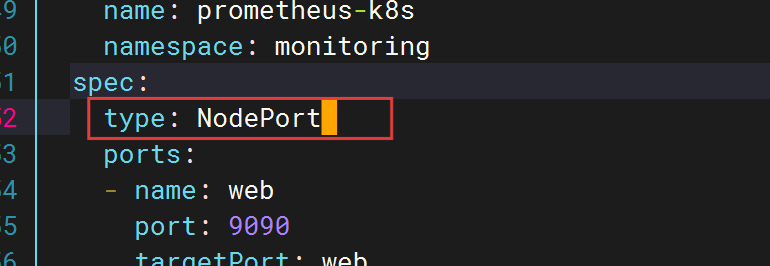
提交
kubectl create -f ./setup
kubectl create -f ./
查看pod
pod和svc正常啟動
[root@k8s-master manifests]# kubectl -n monitoring get po
NAME                                   READY   STATUS    RESTARTS   AGE
alertmanager-main-0                    2/2     Running   0          63s
alertmanager-main-1                    2/2     Running   0          63s
alertmanager-main-2                    2/2     Running   0          63s
blackbox-exporter-6cfc4bffb6-jwxzx     3/3     Running   0          66s
grafana-748964b847-5drhv               1/1     Running   0          65s
kube-state-metrics-6b4d48dcb4-9wzdr    3/3     Running   0          65s
node-exporter-2g9b5                    2/2     Running   0          65s
node-exporter-fn86k                    2/2     Running   0          65s
node-exporter-pl4xk                    2/2     Running   0          65s
prometheus-adapter-79c588b474-gfjn5    1/1     Running   0          64s
prometheus-adapter-79c588b474-ncx2m    1/1     Running   0          64s
prometheus-k8s-0                       2/2     Running   0          63s
prometheus-k8s-1                       2/2     Running   0          63s
prometheus-operator-68f6c79f9d-jmm6r   2/2     Running   0          64s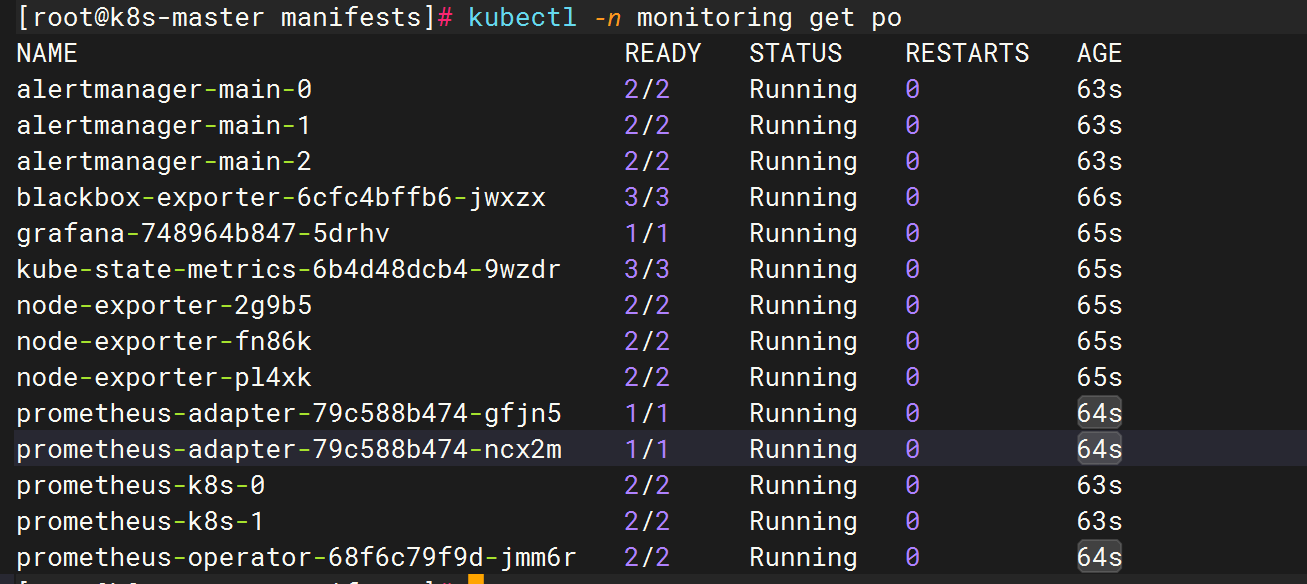
deployment
[root@k8s-master manifests]# kubectl -n monitoring get deployments.apps
NAME                  READY   UP-TO-DATE   AVAILABLE   AGE
blackbox-exporter     1/1     1            1           2m13s
grafana               1/1     1            1           2m13s
kube-state-metrics    1/1     1            1           2m12s
prometheus-adapter    2/2     2            2           2m12s
prometheus-operator   1/1     1            1           2m11s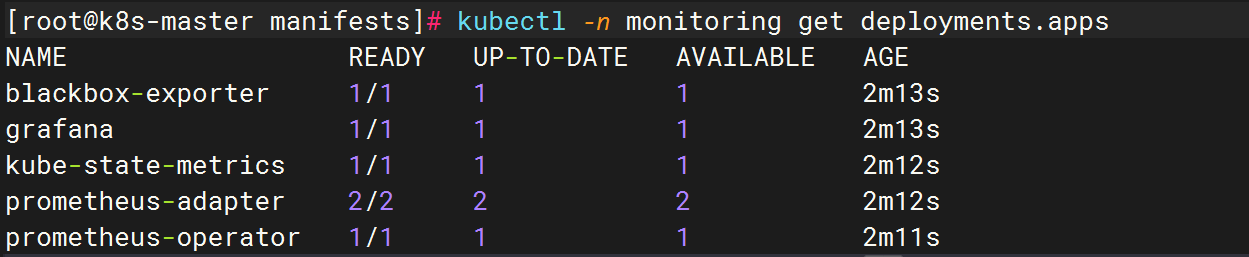
daemonset
[root@k8s-master manifests]# kubectl -n monitoring get daemonsets.apps
NAME            DESIRED   CURRENT   READY   UP-TO-DATE   AVAILABLE   NODE SELECTOR            AGE
node-exporter   3         3         3       3            3           kubernetes.io/os=linux   2m44s
service
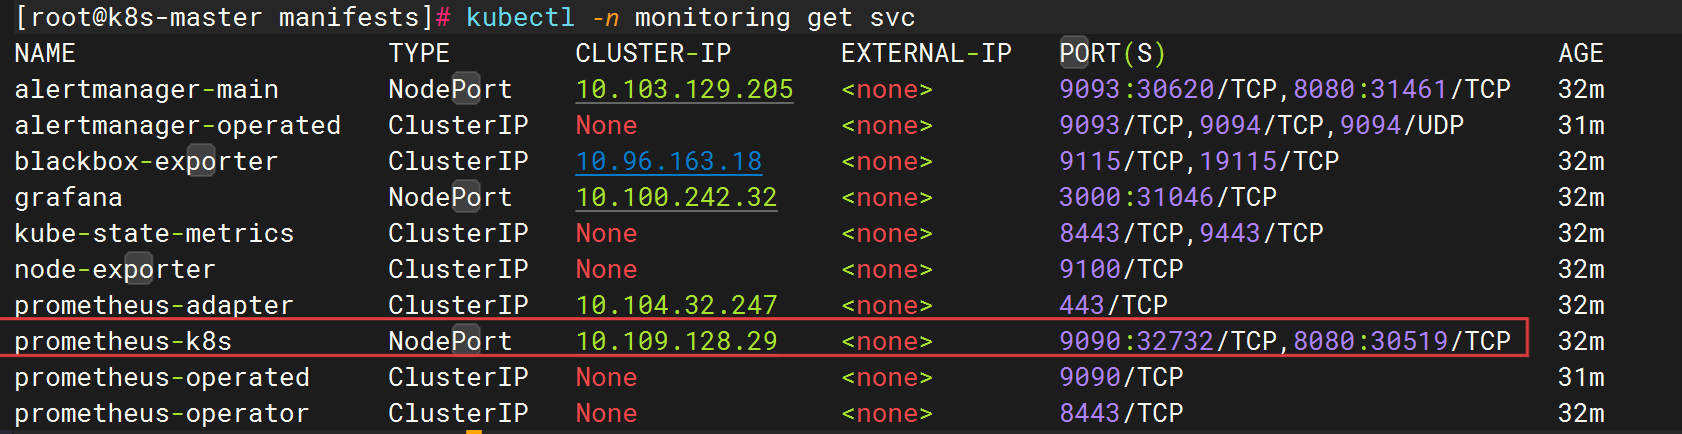
[root@k8s-master manifests]# kubectl -n monitoring get svc
NAME                    TYPE        CLUSTER-IP       EXTERNAL-IP   PORT(S)                         AGE
alertmanager-main       NodePort    10.103.129.205   <none>        9093:30620/TCP,8080:31461/TCP   2m22s
alertmanager-operated   ClusterIP   None             <none>        9093/TCP,9094/TCP,9094/UDP      2m19s
blackbox-exporter       ClusterIP   10.96.163.18     <none>        9115/TCP,19115/TCP              2m22s
grafana                 NodePort    10.100.242.32    <none>        3000:31046/TCP                  2m21s
kube-state-metrics      ClusterIP   None             <none>        8443/TCP,9443/TCP               2m21s
node-exporter           ClusterIP   None             <none>        9100/TCP                        2m21s
prometheus-adapter      ClusterIP   10.104.32.247    <none>        443/TCP                         2m21s
prometheus-k8s          NodePort    10.109.128.29    <none>        9090:32732/TCP,8080:30519/TCP   2m21s
prometheus-operated     ClusterIP   None             <none>        9090/TCP                        2m19s
prometheus-operator     ClusterIP   None             <none>        8443/TCP                        2m20s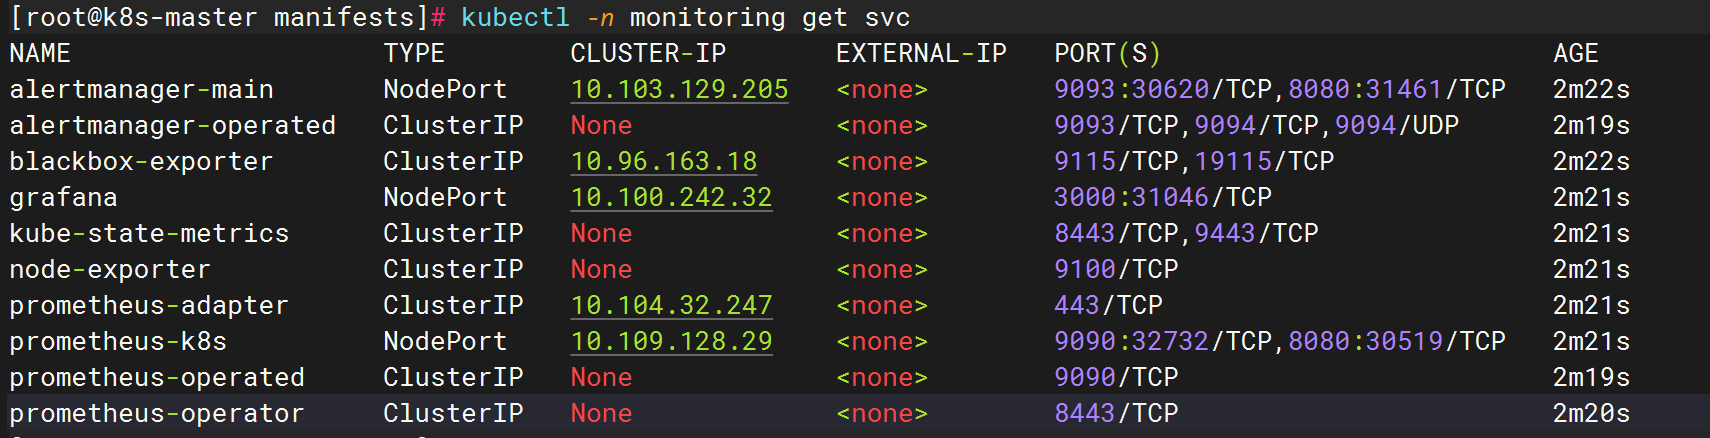
刪除影響外部訪問的pod資源
[root@k8s-master manifests]# kubectl delete -f prometheus-networkPolicy.yaml
networkpolicy.networking.k8s.io "prometheus-k8s" deleted
[root@k8s-master manifests]# kubectl delete -f grafana-networkPolicy.yaml
networkpolicy.networking.k8s.io "grafana" deleted
[root@k8s-master manifests]# kubectl delete -f alertmanager-networkPolicy.yaml
networkpolicy.networking.k8s.io "alertmanager-main" deleted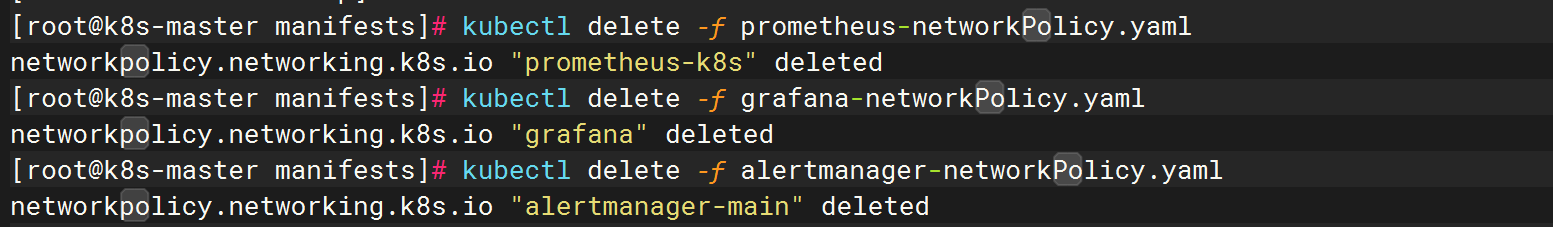
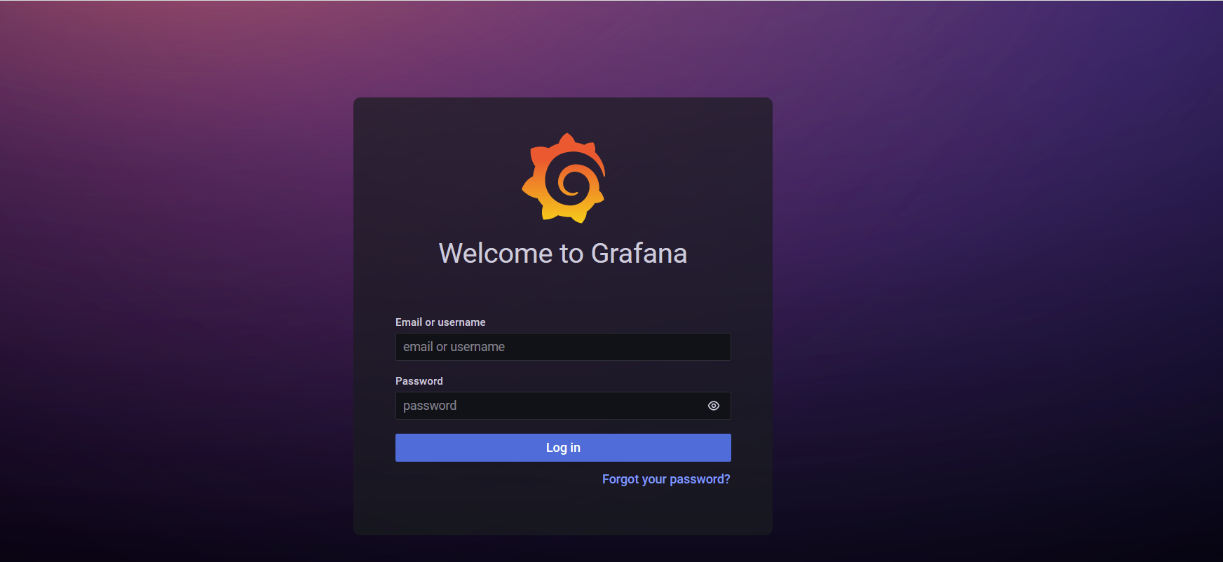
網頁訪問
a
192.168.158.33:31046
#訪問用戶和密碼
admin/admin
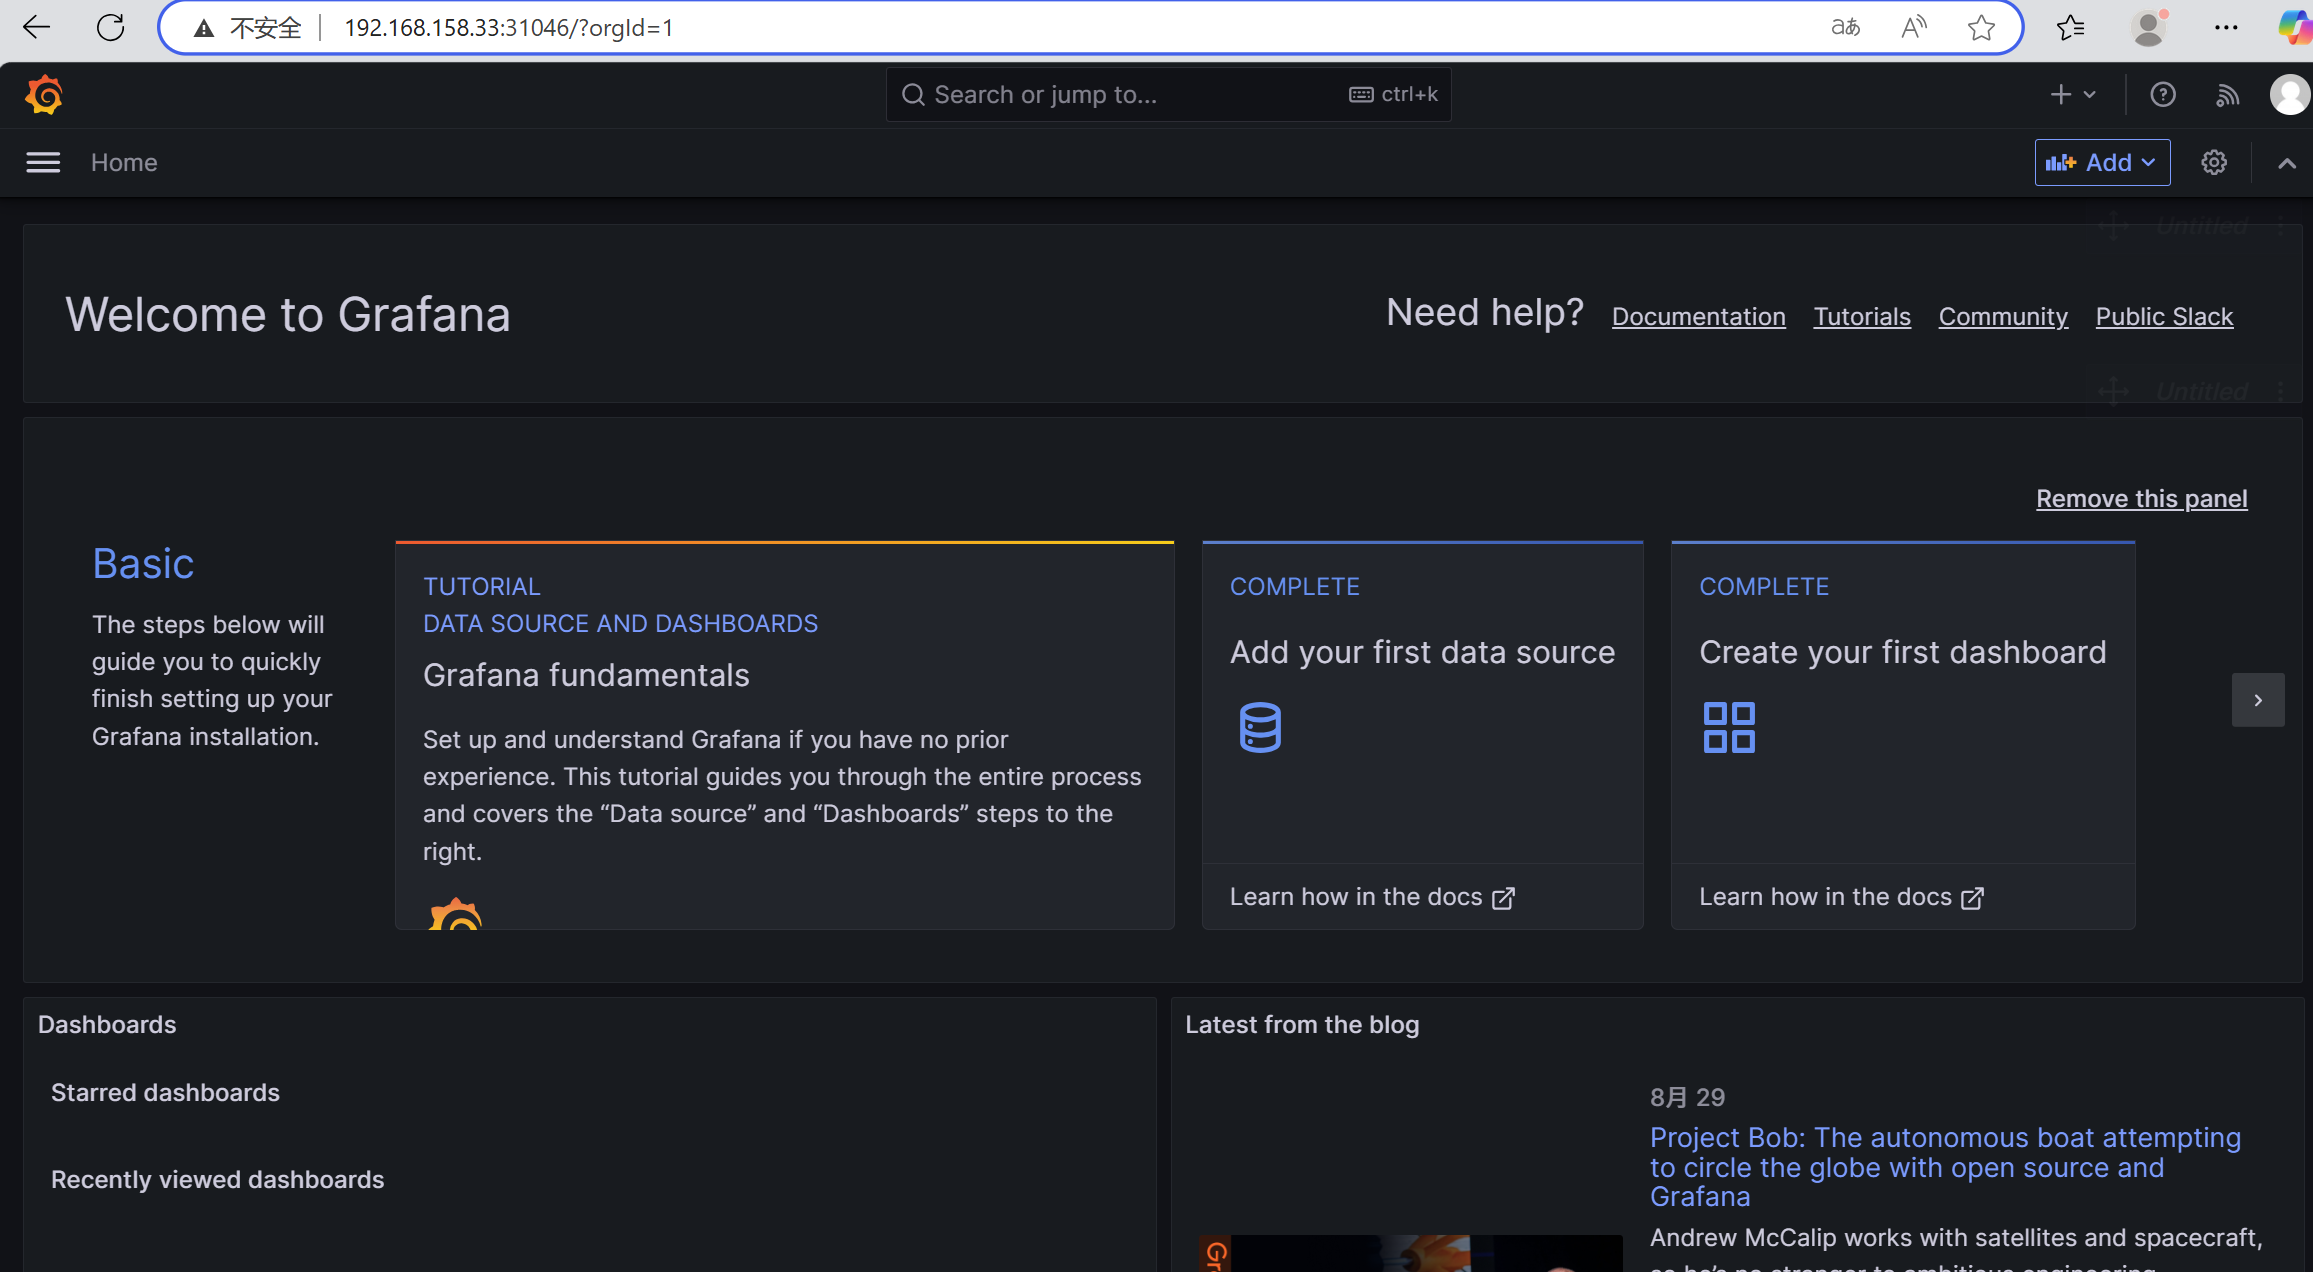
prometheus就是通過內部端口9090進行訪問的
如何設置告警信息呢?
如下操作:
進到prometheus-k8s-0? 容器里
[root@k8s-master manifests]# kubectl -n monitoring get po
NAME                                   READY   STATUS    RESTARTS   AGE
alertmanager-main-0                    2/2     Running   0          3h49m
alertmanager-main-1                    2/2     Running   0          3h49m
alertmanager-main-2                    2/2     Running   0          3h49m
blackbox-exporter-6cfc4bffb6-jwxzx     3/3     Running   0          3h49m
grafana-bc647458d-rnrcj                1/1     Running   0          3h28m
kube-state-metrics-6b4d48dcb4-9wzdr    3/3     Running   0          3h49m
node-exporter-2g9b5                    2/2     Running   0          3h49m
node-exporter-fn86k                    2/2     Running   0          3h49m
node-exporter-pl4xk                    2/2     Running   0          3h49m
prometheus-adapter-79c588b474-gfjn5    1/1     Running   0          3h49m
prometheus-adapter-79c588b474-ncx2m    1/1     Running   0          3h49m
prometheus-k8s-0                       2/2     Running   0          3h49m
prometheus-k8s-1                       2/2     Running   0          3h49m
prometheus-operator-68f6c79f9d-jmm6r   2/2     Running   0          3h49m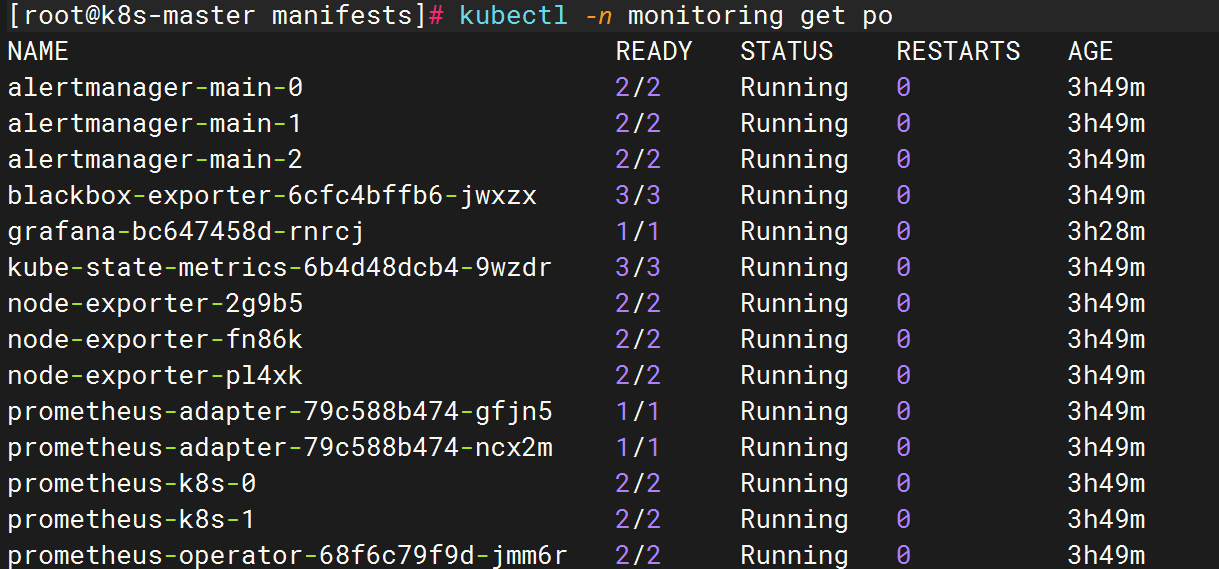
[root@k8s-master manifests]# kubectl -n monitoring exec -it prometheus-k8s-0 -- sh
/prometheus $
/prometheus $ cd 
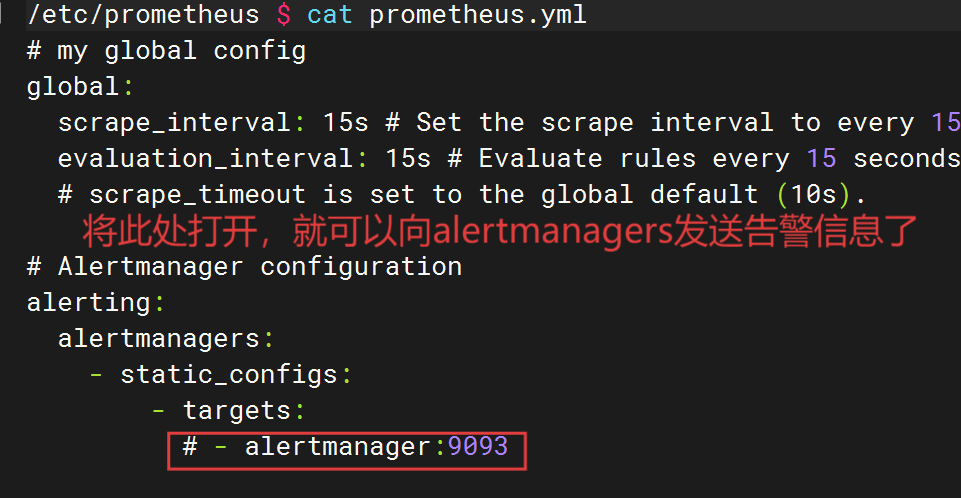
主要文件:prometheus.yml?
告警規則:rules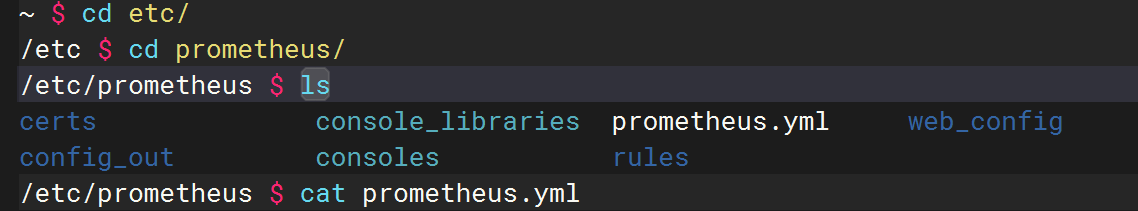
打開? ? ? ? ? # - alertmanager:9093


![【題解 | 兩種做法】洛谷 P4208 [JSOI2008] 最小生成樹計數 [矩陣樹/枚舉]](http://pic.xiahunao.cn/【題解 | 兩種做法】洛谷 P4208 [JSOI2008] 最小生成樹計數 [矩陣樹/枚舉])


+ AI:智能工業的未來趨勢全解析)


