從車道檢測項目入門open cv
前提聲明:非常感謝b站up主 嘉然今天吃帶變,感謝其視頻的幫助。同時希望各位大佬積積極提出寶貴的意見。😊😊😊(?′?`?)(●’?’●)╰(°▽°)╯
github地址:https://github.com/lizhongzheng13/openCV_Lane_Detection/tree/main
視頻地址:從車道檢測項目入門open cv
基礎知識
cv2.imread & cv2.imshow & cv2.imwrite
import cv2 as cvimg = cv.imread("img.png", cv.IMREAD_GRAYSCALE) #將圖片轉為灰度圖
但是當前會存在一些問題,圖片會閃一下,看不清楚,所以我們可以加上阻塞
cv2.waitKey()函數
#完整版
import cv2 as cvimg = cv.imread("img.png", cv.IMREAD_GRAYSCALE)
print(type(img))
print(img.shape)
cv.imshow('image', img)
k = cv.waitKey(0)  # 阻塞 #k相當于檢測你的輸入的ascii值
print(k)
# while True:
#     if cv.waitKey(0) == ord('q'):
#         cv.destroyAllWindows()
#     else:
#         img = cv.imread("img.png", cv.IMREAD_GRAYSCALE)cv.imwrite("img_gray.png", img)#生成img圖片,保存到當前目錄中~
效果展示
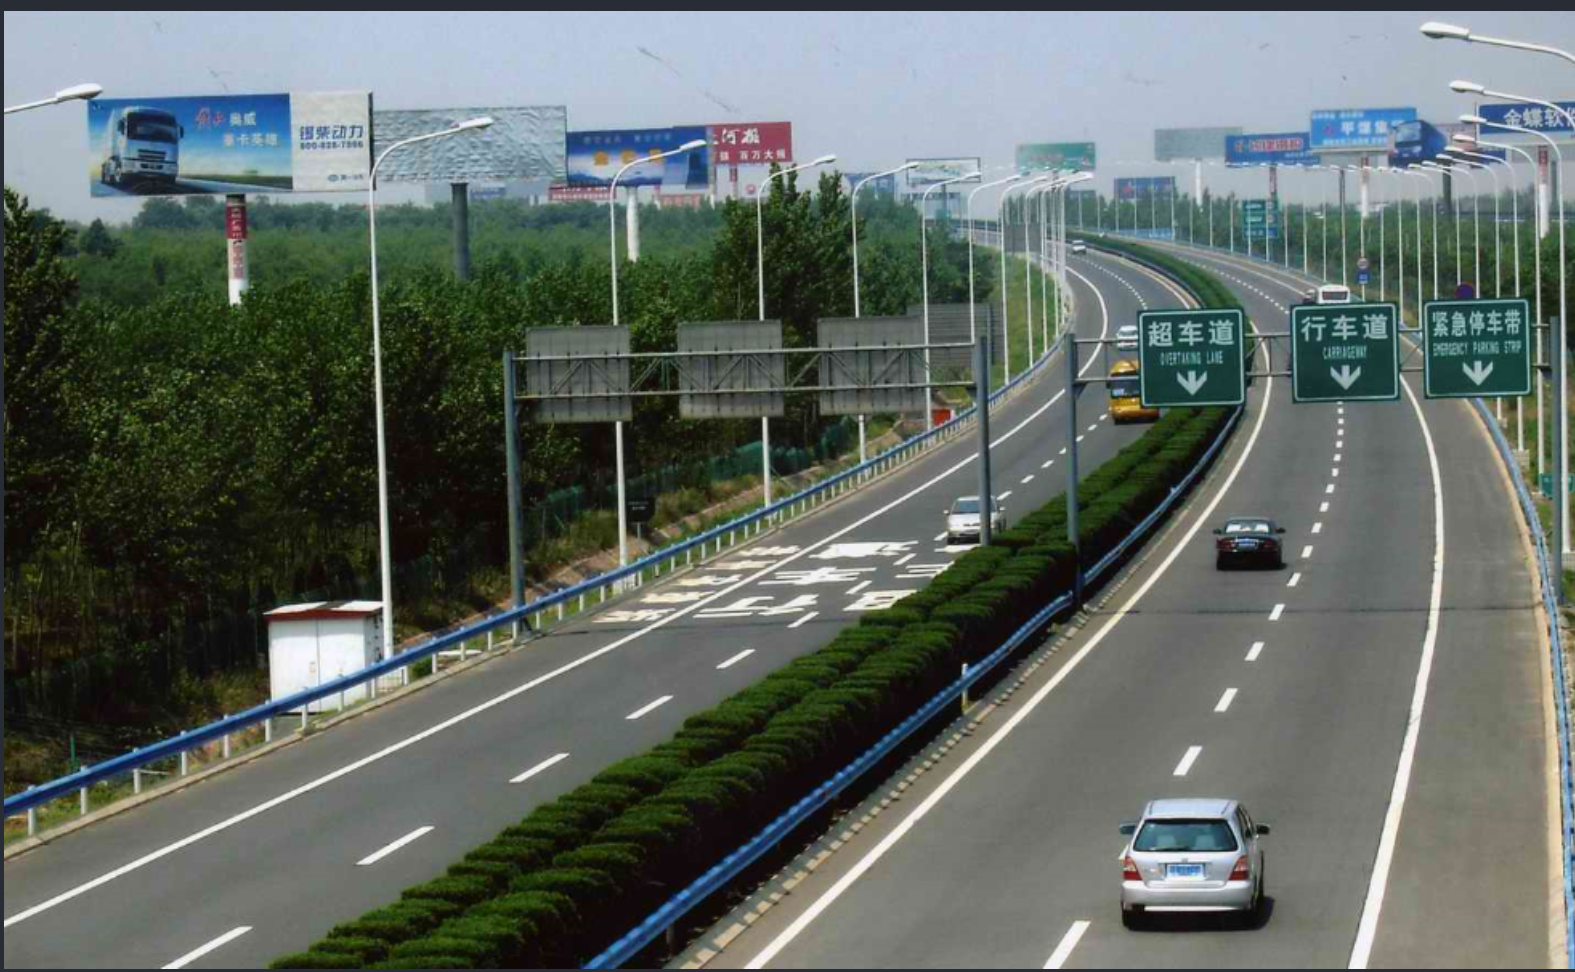
原始圖像:
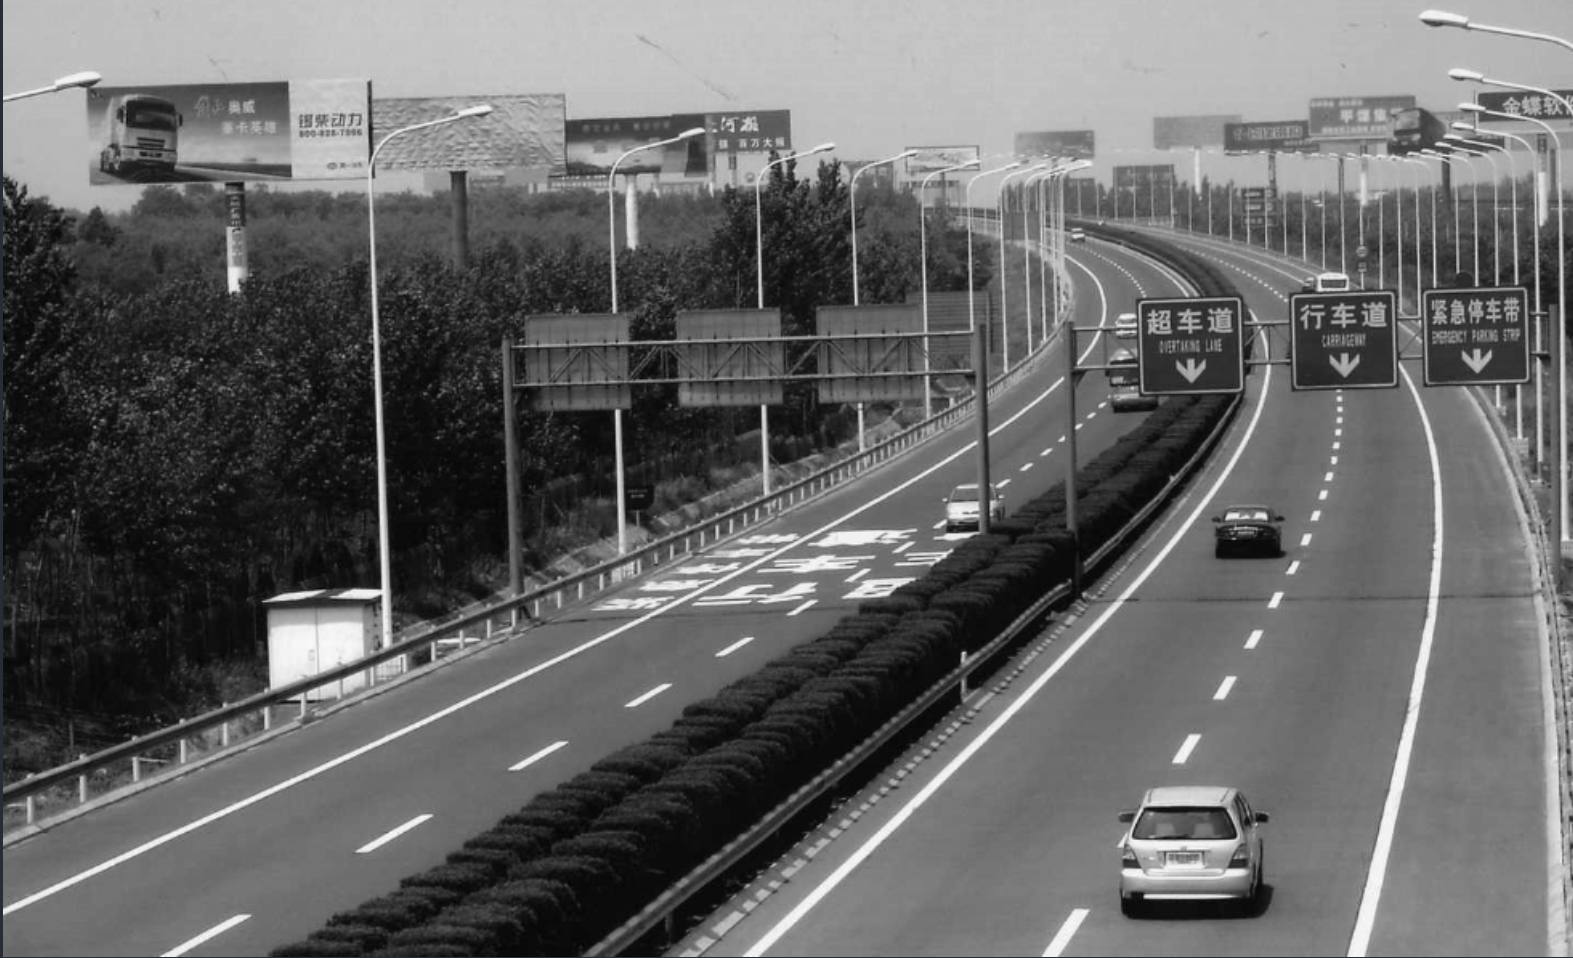
灰度圖:
Canny邊緣檢測
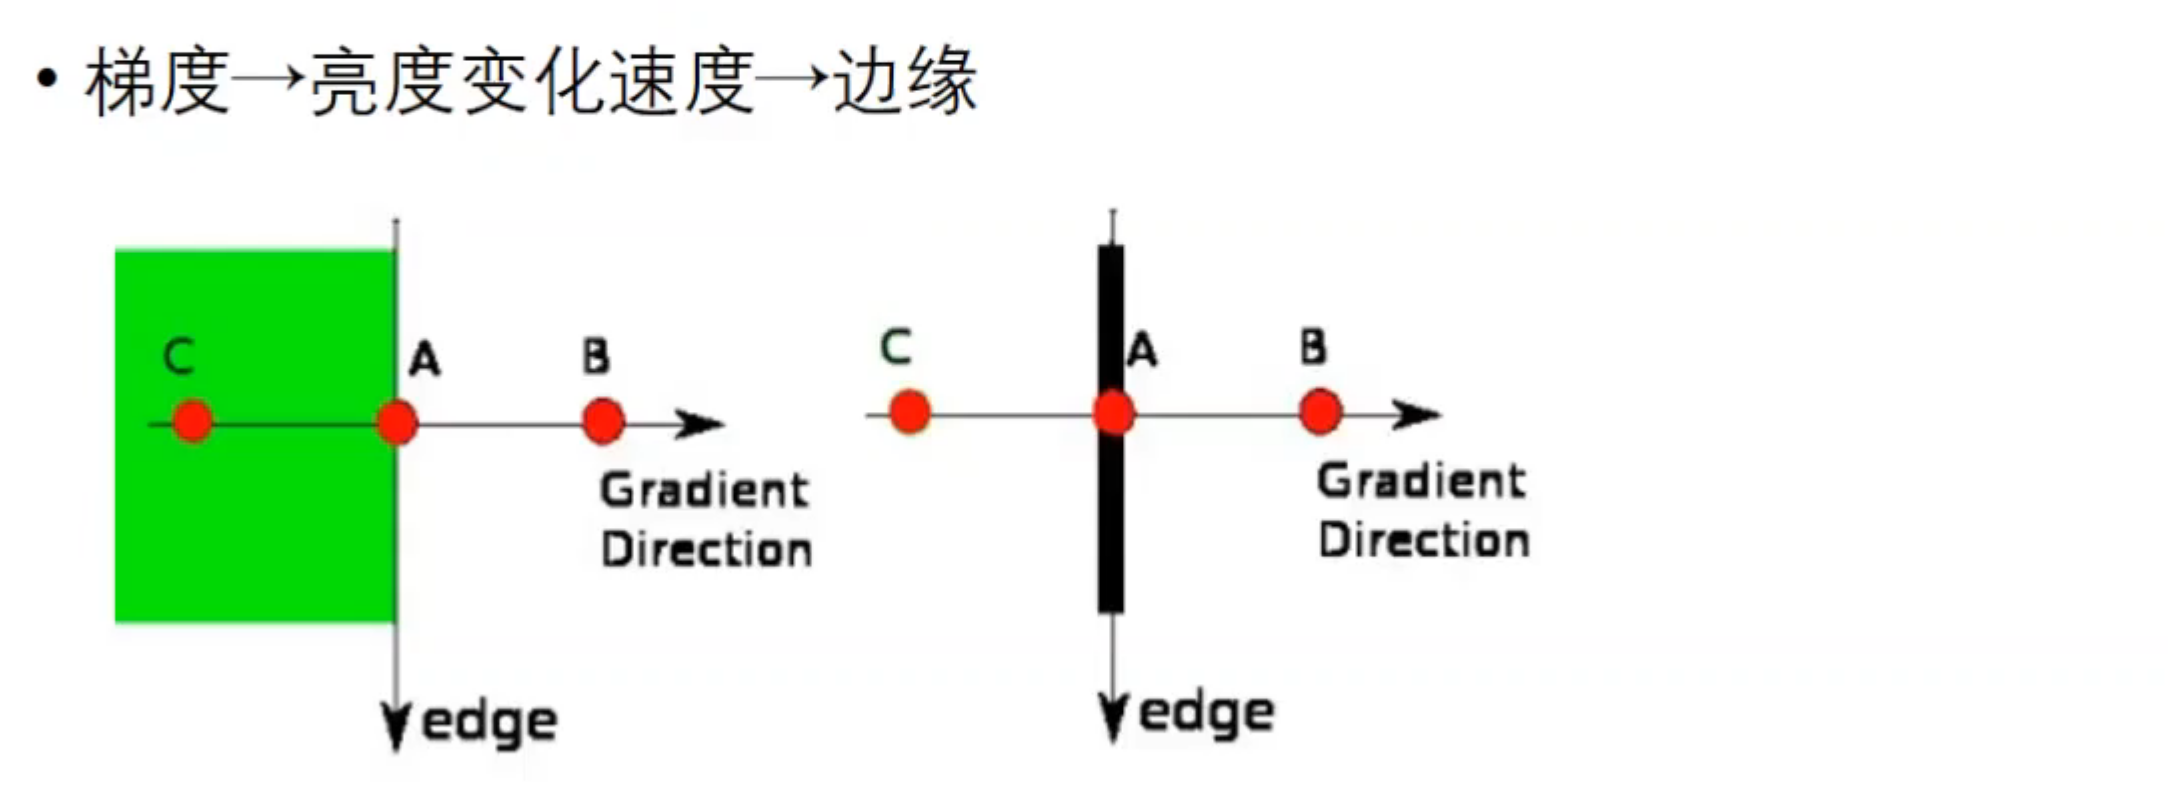
通過求取圖像上每一個像素點周邊圖像像素變化的梯度,來確定這個點是否是邊緣。
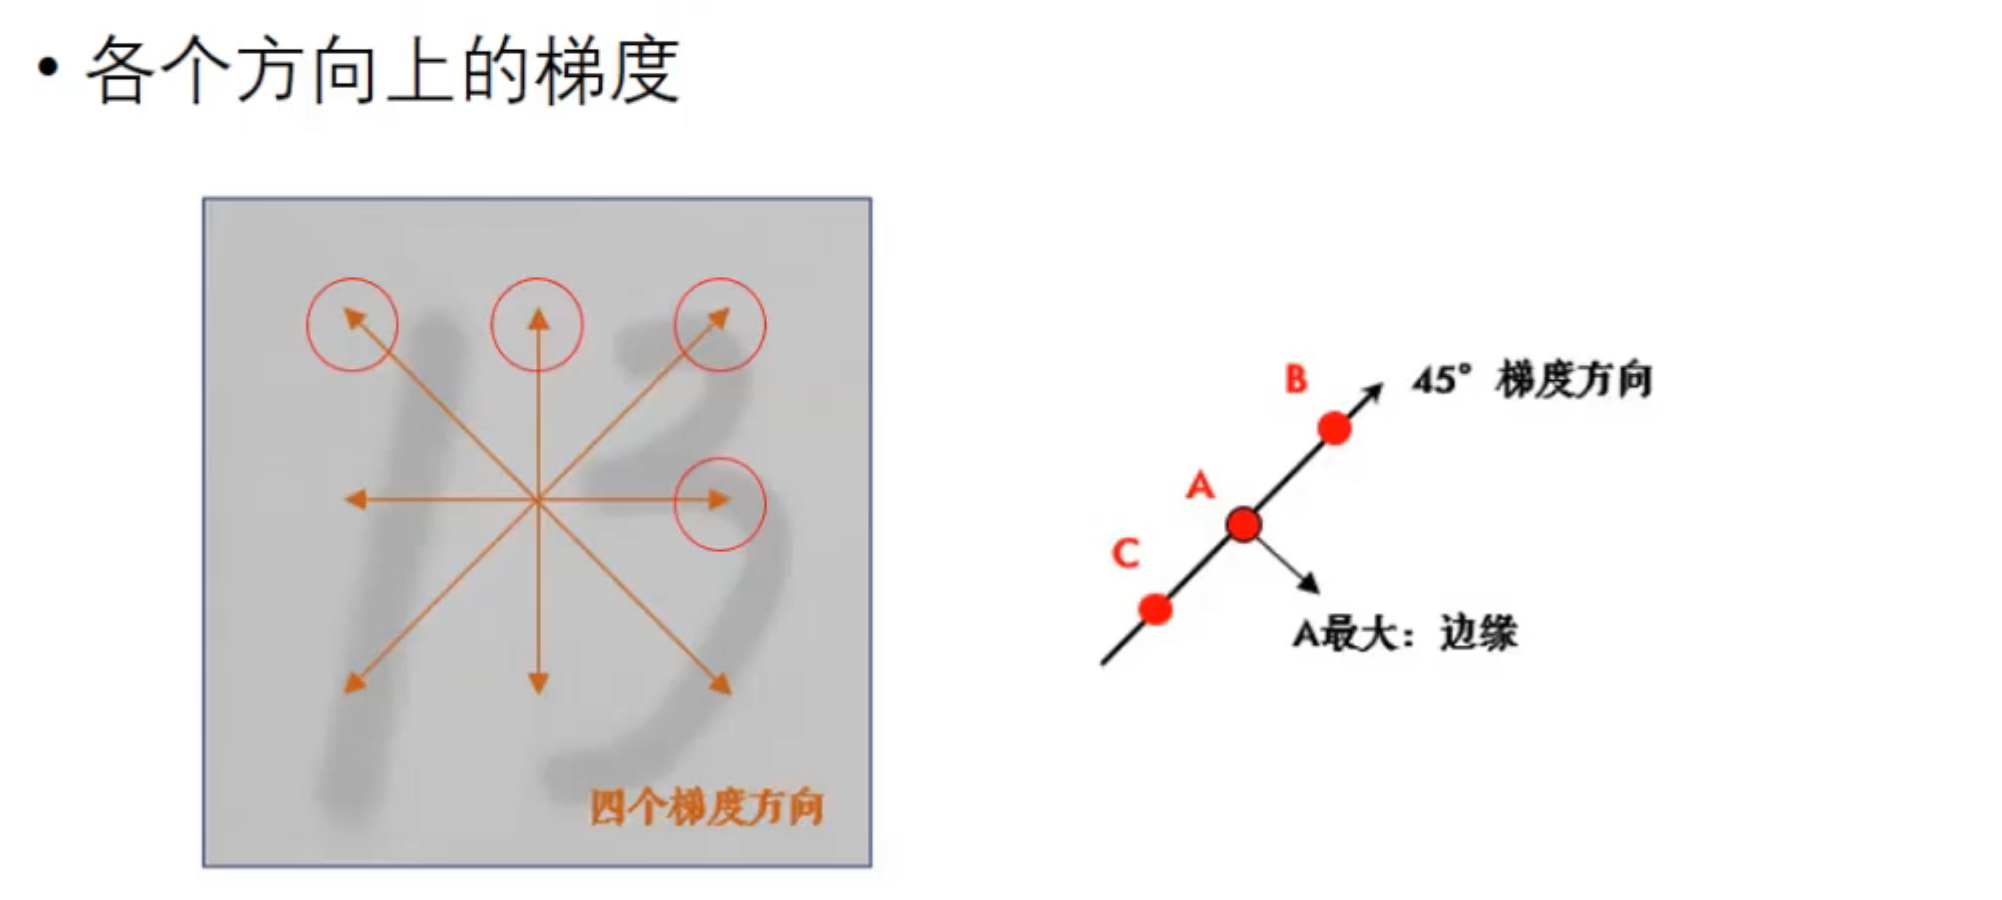
梯度的方向一般總是與邊界垂直,梯度的方向被歸為四類:垂直、水平和兩個對角線(即,0度、45度、90度和135度四個方向)。
我們現在的想法是設置一個閾值,當梯度大于閾值時,我們可以認為該點是邊緣。但是隨之而來的是,圖片會產生一些毛邊或者光線,角度等問題,導致可能會誤判。
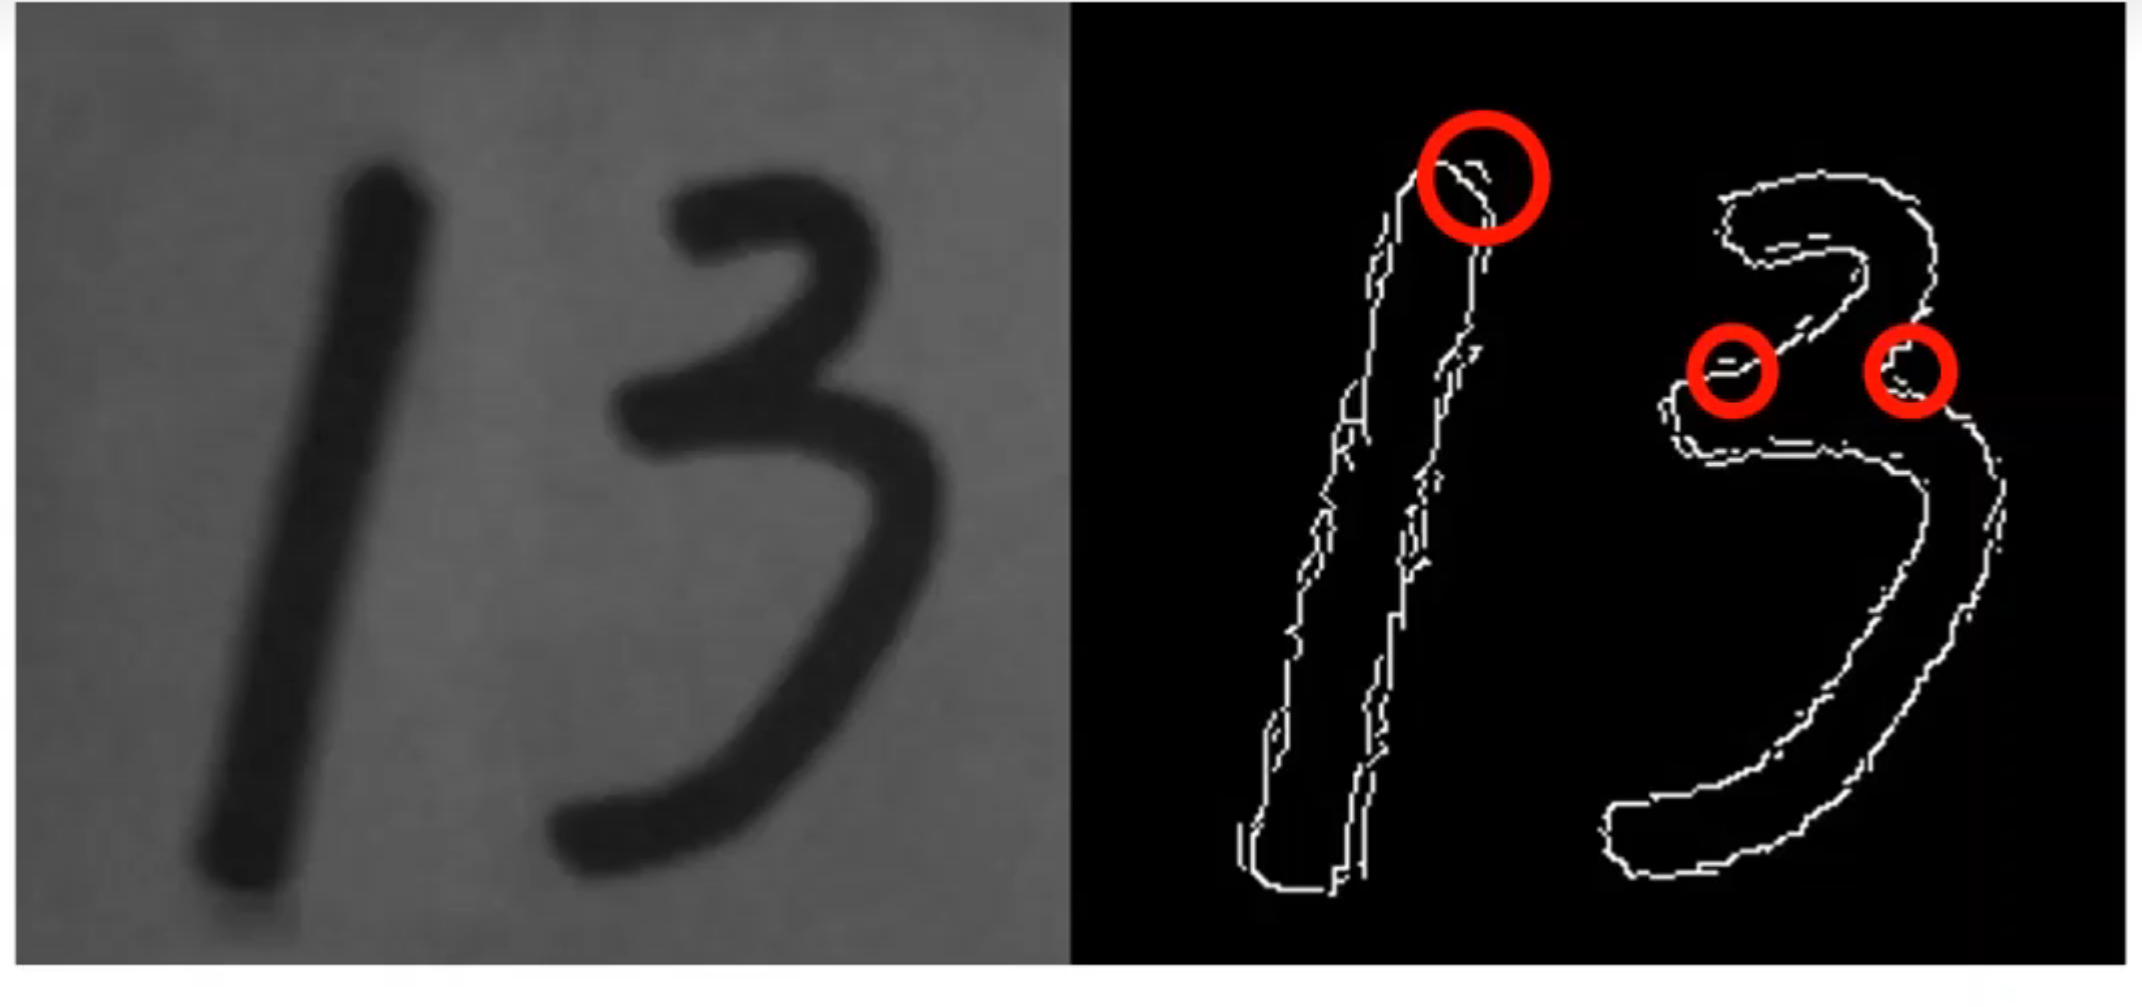
為了解決這個問題,我們采用雙閾值的方法,一個上閾值,一個下閾值。
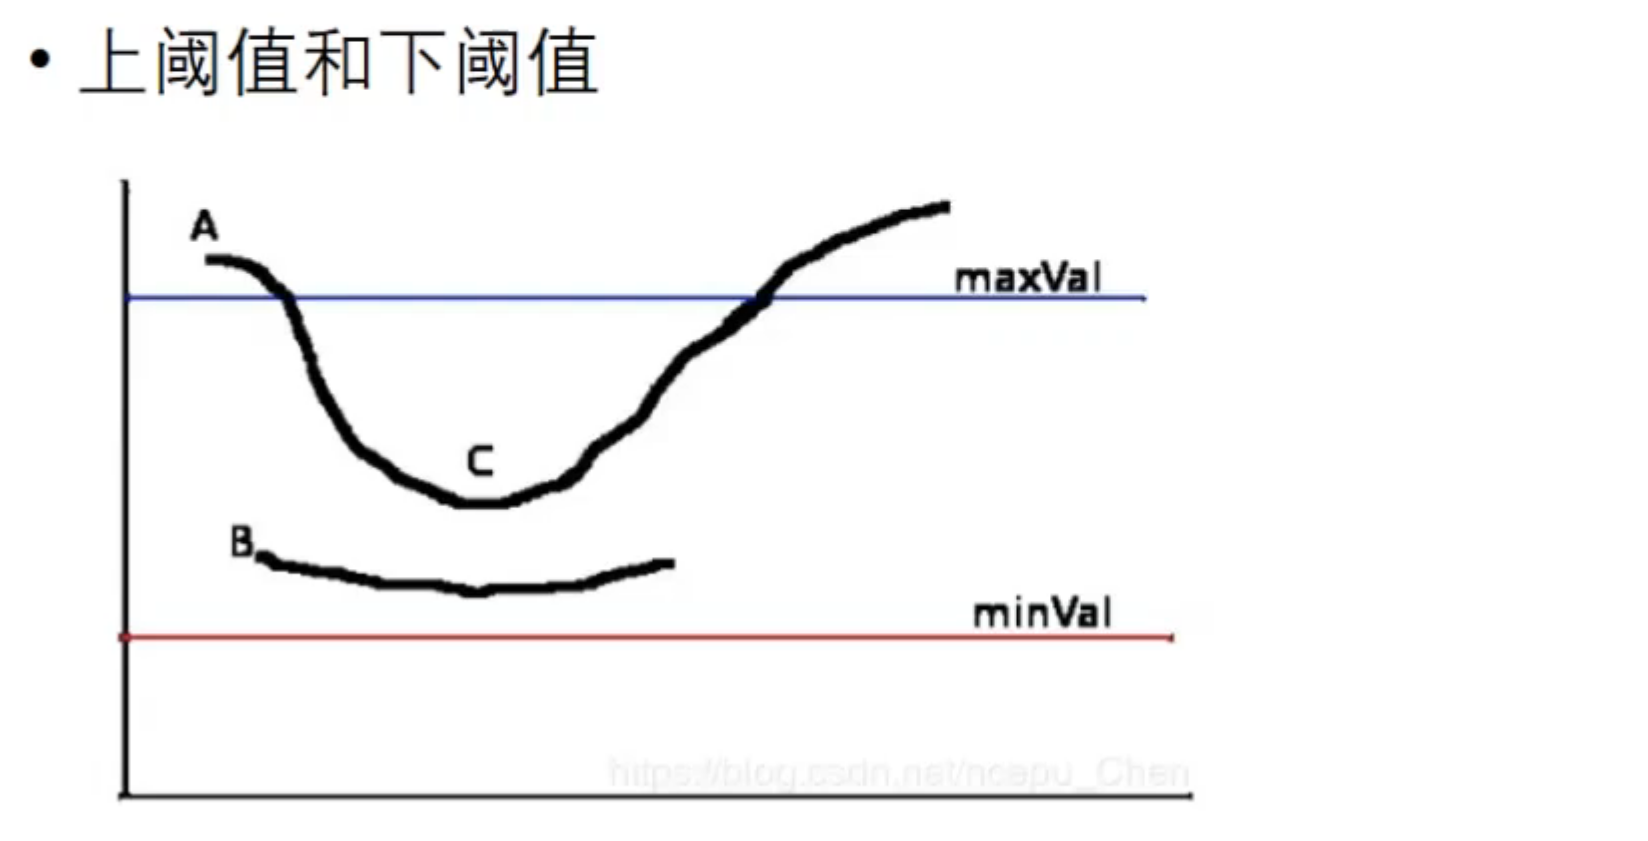
我們認為高于上閾值的點為強邊緣,在上閾值和下閾值之間的我們認為是弱邊緣。
我們認為只有弱邊緣與強邊緣相連的話,才是邊緣。B不認為是邊緣,可能是噪聲;C與A強邊緣相連,我們認為C是邊緣。
import cv2img = cv2.imread("img.png", cv2.IMREAD_GRAYSCALE)edge_img = cv2.Canny(img, 190, 350)  # 下邊緣和上邊緣的閾值設定 #需要自行更改
cv2.imshow("edge", edge_img)
cv2.waitKey(0)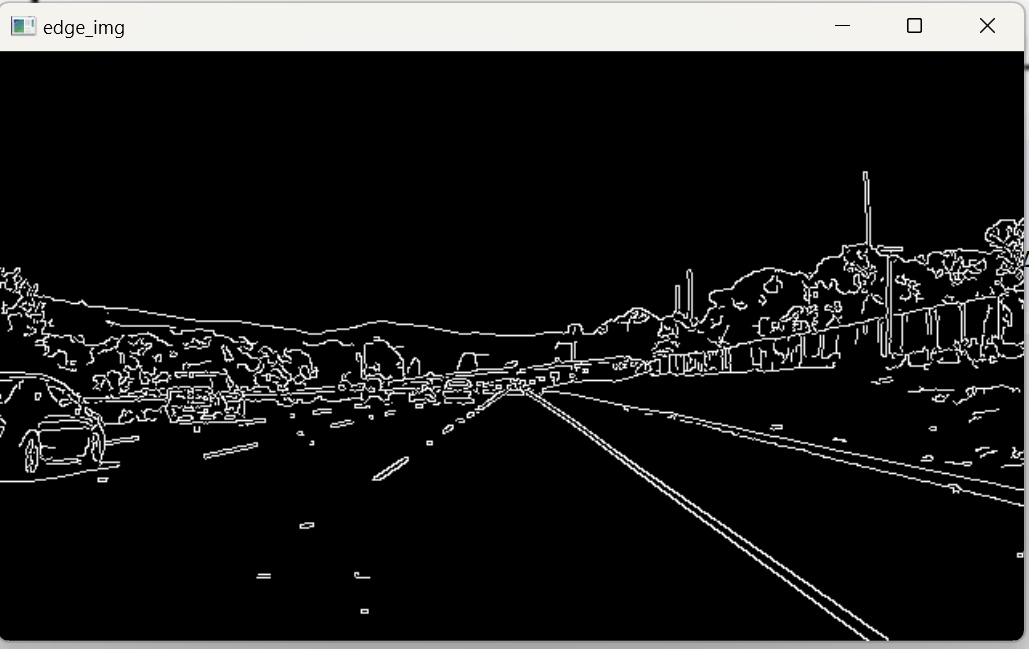
當上邊緣和下邊緣都升高時,邊緣顯示會越來越少。
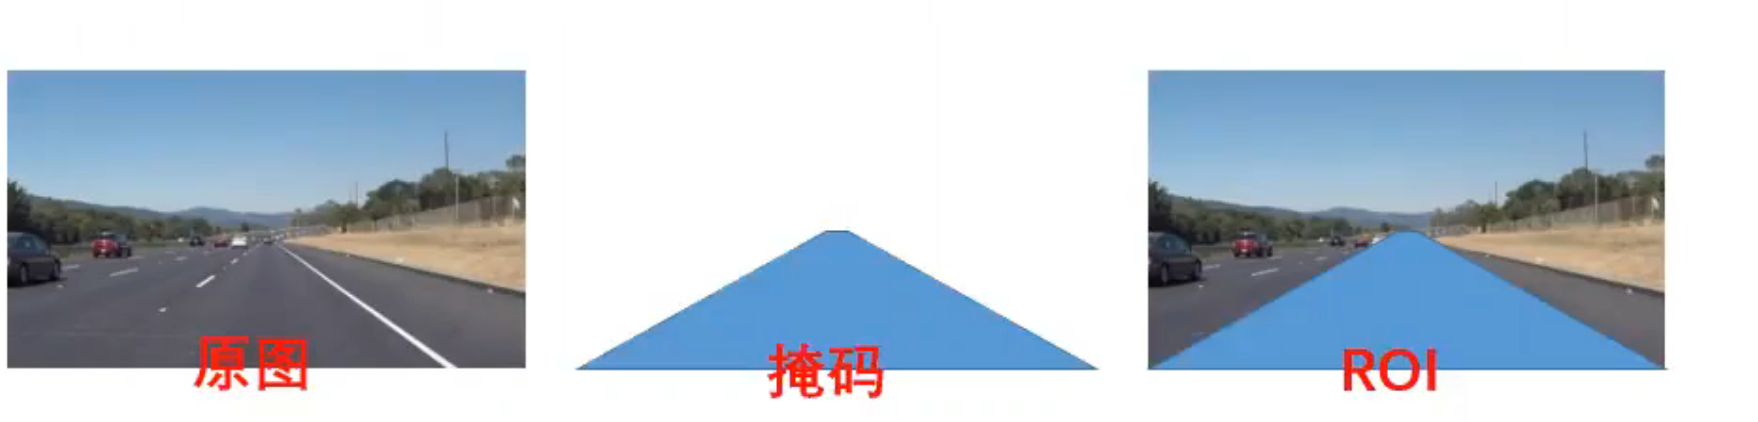
ROI mask
簡單來講就是類似于摳圖,就是剔除無關信息的邊緣。
roi : region of interest 感興趣的區域
? 數組切片
? 布爾運算(與運算)
-
cv2.fillPoly是 OpenCV 中的一個函數,用于在圖像中填充多邊形區域。它常用于繪制、遮罩或標記圖像中的特定區域。通過指定多邊形的頂點,cv2.fillPoly可以將這些區域填充為指定的顏色。 -
cv2.bitwise_and是 OpenCV 中的一個函數,用于對兩個圖像或數組進行按位與(bitwise AND)操作。按位與操作是逐像素進行的,只有當兩個圖像的對應像素都為非零值時,結果圖像的該像素才為非零值。-
圖像遮罩:
- 使用掩碼提取圖像的特定區域。例如,將一個形狀(如矩形、圓形或多邊形)作為掩碼,只保留掩碼內的圖像內容。
-
圖像合成:
- 將兩個圖像的特定部分組合在一起。
-
圖像處理:
- 在圖像處理中,按位與操作常用于對圖像進行區域選擇或區域遮擋。
-
圖像以矩陣np.array形式存儲在內存中
? np.zeros_like : np.zeros_like 是 NumPy 庫中的一個函數,用于創建一個與給定數組形狀和數據類型相同的數組,但所有元素都初始化為零。
# @Author : LiZhongzheng
# 開發時間  :2025-04-28 17:30
import cv2
import numpy as npedge_img = cv2.imread("edge_img.png", cv2.IMREAD_GRAYSCALE)
mask = np.zeros_like(edge_img)  # 獲取一個與edge_img大小相同的數組
mask = cv2.fillPoly(mask, np.array([[[0, 569], [661, 195], [914, 248], [979, 592]]]),color=255)  # array中的存放的是想要識別區域的四個頂點 #順序為左下、左上、右上、右下masked_edge_img = cv2.bitwise_and(edge_img, mask)
# cv2.imshow('mask', mask)
# cv2.waitKey(0)
cv2.imshow("edged", masked_edge_img)
cv2.waitKey(0)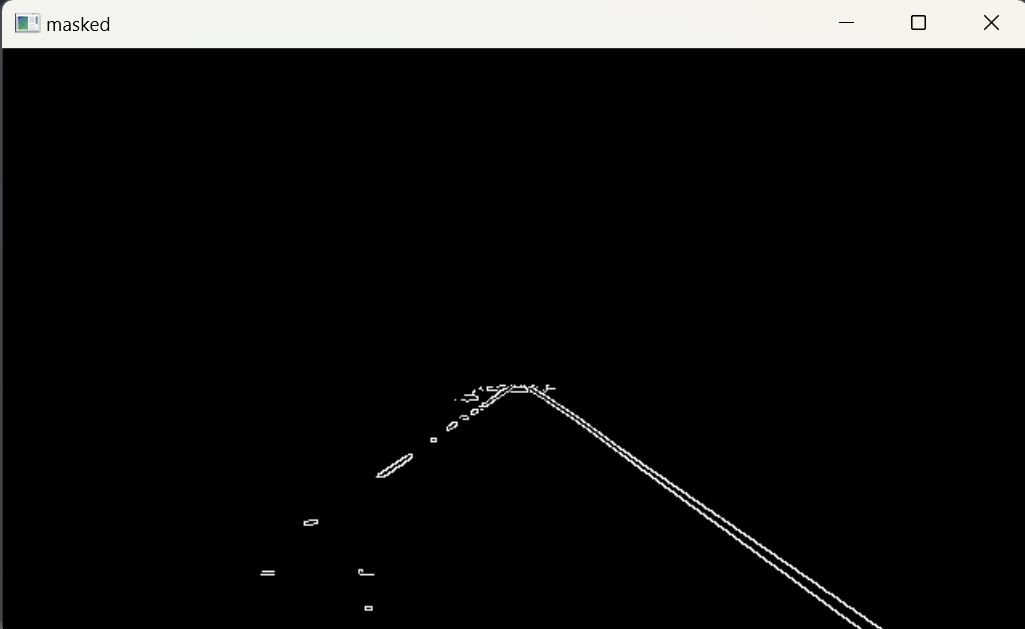
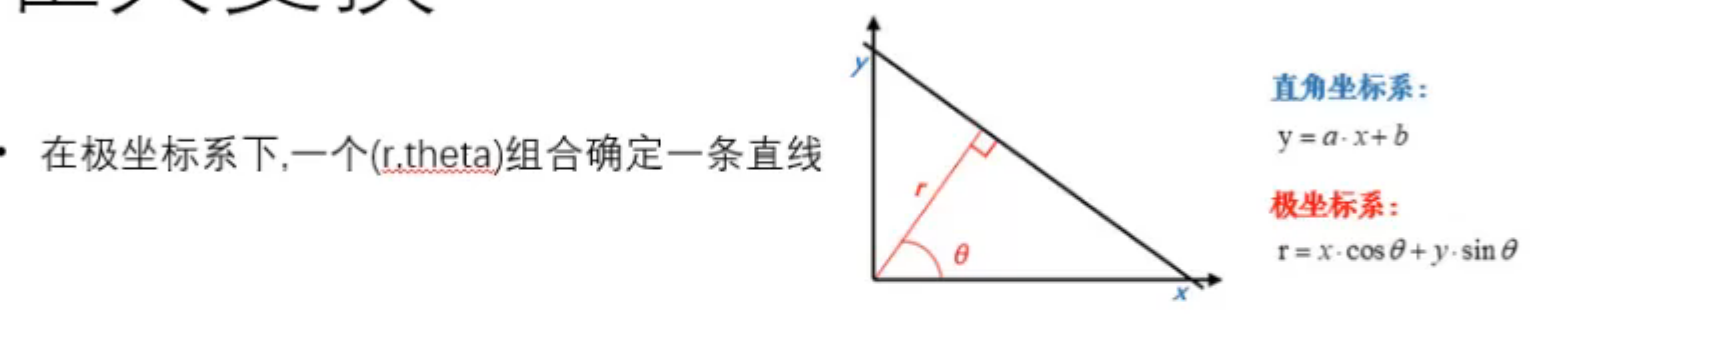
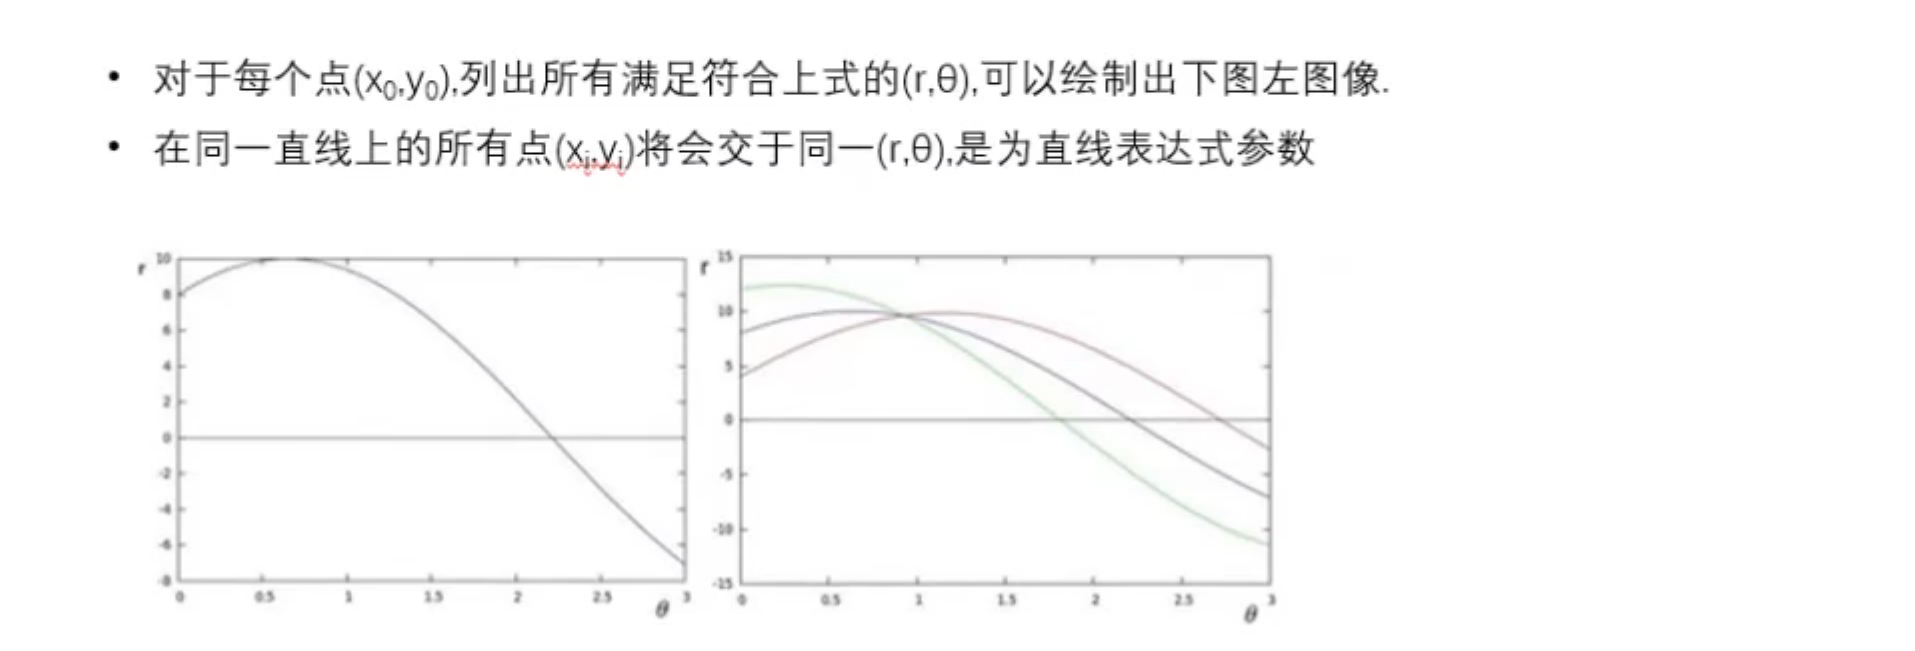
霍夫變換
提取圖片中的直線。
注意:霍夫變換是針對灰度圖的。
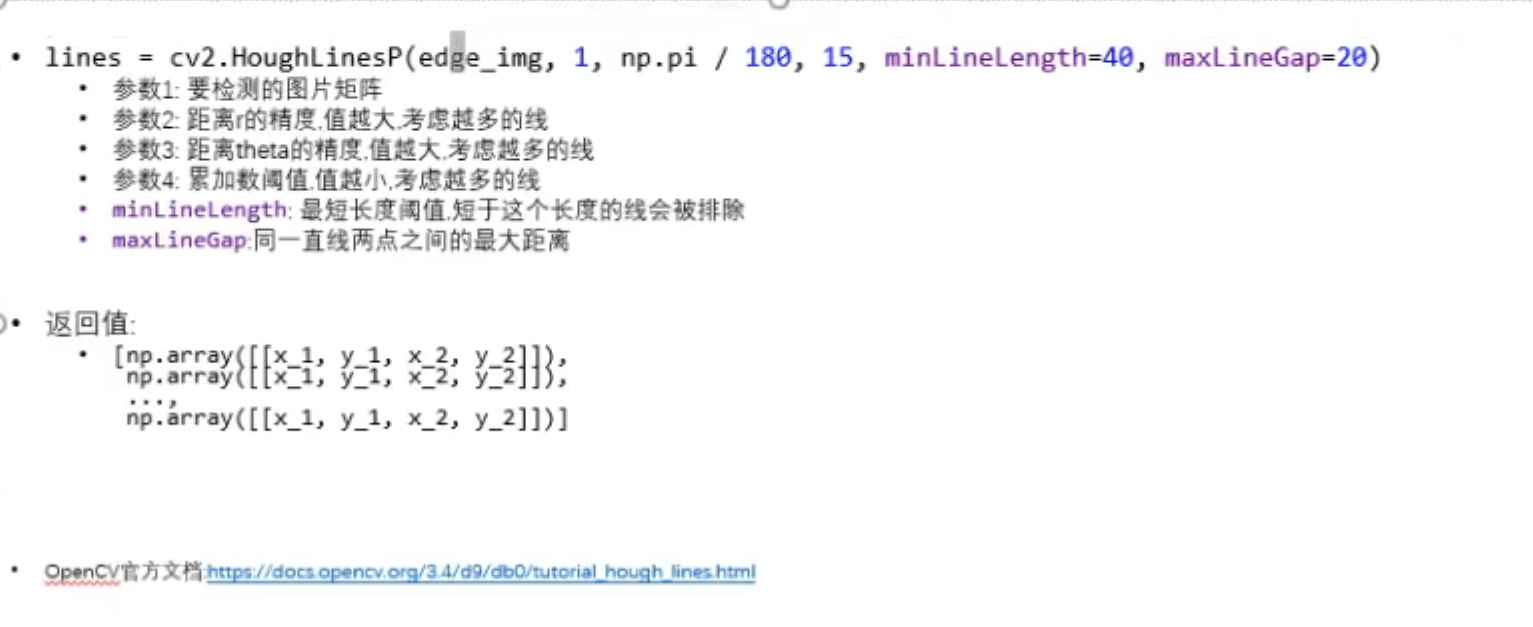
min是最短線段的長度,max是兩點之間的最大距離,超過這個距離就不認為是線段了。
-
首先經過 cv2.HoughLinesP()函數獲取到所有的線條,然后計算線條的斜率,根據斜率的正負判斷是左車道線還是右車道線。
-
# @Author : LiZhongzheng
# 開發時間  :2025-04-29 8:54
import cv2
import numpy as npdef calculate_slope(line):"""計算線段line的斜率:param line: np.array([[x_1, y_1, x_2, y_2]]):return:"""x_1, y_1, x_2, y_2 = line[0]return (y_2 - y_1) / (x_2 - x_1)edge_img = cv2.imread('masked_edge_img.jpg', cv2.IMREAD_GRAYSCALE)
# 獲取所有線段
lines = cv2.HoughLinesP(edge_img, 1, np.pi / 180, 15, minLineLength=40,maxLineGap=20)
# 按照斜率分成車道線
left_lines = [line for line in lines if calculate_slope(line) > 0]
right_lines = [line for line in lines if calculate_slope(line) < 0]print("left_lines =", len(left_lines))
print("right_lines =", len(right_lines))
-
離群值過濾
剔除出因為誤差而被識別出的直線。
如何分解出噪點和車道線那?
- 我們可以知道,車道線的斜率大致是相同的,進而可以分辨出噪點和車道線。
# @Author : LiZhongzheng
# 開發時間  :2025-04-29 9:01
import cv2
import numpy as np"""
剔除出因為誤差而被識別出的直線。
如何分解出噪點和車道線那?我們可以知道,車道線的斜率大致是相同的,進而可以分辨出噪點和車道線。
"""def calculate_slope(line):"""計算線段line的斜率:param line: np.array([[x_1, y_1, x_2, y_2]]):return:"""x_1, y_1, x_2, y_2 = line[0]return (y_2 - y_1) / (x_2 - x_1)edge_img = cv2.imread('masked_edge_img.jpg', cv2.IMREAD_GRAYSCALE)# 獲取所有線段
lines = cv2.HoughLinesP(edge_img, 1, np.pi / 180, 15, minLineLength=40, maxLineGap=20)# 按照斜率分成車道線
left_lines = [line for line in lines if calculate_slope(line) > 0]
right_lines = [line for line in lines if calculate_slope(line) < 0]def reject_abnormal_lines(lines, threshold):"""剔除斜率不一致的線段:param lines: 線段集合, [np.array([[x_1, y_1, x_2, y_2]]),np.array([[x_1, y_1, x_2, y_2]]),...,np.array([[x_1, y_1, x_2, y_2]])]"""slopes = [calculate_slope(line) for line in lines]while len(lines) > 0:mean = np.mean(slopes)  # 使用 NumPy 的 np.mean 函數計算當前所有斜率的平均值diff = [abs(s - mean) for s in slopes]  # 遍歷 slopes 列表,計算每個斜率與平均斜率的絕對差值,并將結果存儲在 diff 列表中idx = np.argmax(diff)  # 使用 NumPy 的 np.argmax 函數找到 diff 列表中最大值的索引,即斜率差異最大的線段。if diff[idx] > threshold:  # 如果最大差異大于閾值 threshold,則認為該線段是異常的,將其從 slopes 和 lines 列表中移除。slopes.pop(idx)lines.pop(idx)else:  # 如果最大差異小于或等于閾值,則認為所有線段的斜率已經足夠一致,退出循環。breakreturn lines  # 如果最大差異小于或等于閾值,則認為所有線段的斜率已經足夠一致,退出循環。print('before filter:')
print('left lines number=')
print(len(left_lines))
print('right lines number=')
print(len(right_lines))reject_abnormal_lines(left_lines, threshold=0.2)
reject_abnormal_lines(right_lines, threshold=0.2)print('after filter:')
print('left lines number=')
print(len(left_lines))
print('right lines number=')
print(len(right_lines))
最小二乘擬合
將lines的線段擬合成一條直線。
np.ravel 將高維數組拉成一維
np.polyfit 多項式擬合
np.polyval 多項式求值
-
經過上述的步驟,進而我們可以求出車道線的數量等信息,同時又剔除了噪點。然后我們就可以將在同一個區域的線段擬合一條直線
-
# @Author : LiZhongzheng
# 開發時間  :2025-04-29 15:58
import cv2
import numpy as npdef calculate_slope(line):"""計算線段line的斜率:param line: np.array([[x_1, y_1, x_2, y_2]]):return:"""x_1, y_1, x_2, y_2 = line[0]return (y_2 - y_1) / (x_2 - x_1)edge_img = cv2.imread("masked_edge_img.jpg", cv2.IMREAD_GRAYSCALE)
# 獲取所有線段
lines = cv2.HoughLinesP(edge_img, 1, np.pi / 180, 15, minLineLength=40, maxLineGap=20)# 按照斜率分成車道線
left_lines = [line for line in lines if calculate_slope(line) > 0]
right_lines = [line for line in lines if calculate_slope(line) < 0]def reject_abnormal_lines(lines, threshold):"""剔除斜率不一致的線段:param lines: 線段集合, [np.array([[x_1, y_1, x_2, y_2]]),np.array([[x_1, y_1, x_2, y_2]]),...,np.array([[x_1, y_1, x_2, y_2]])]"""slopes = [calculate_slope(line) for line in lines]while len(lines) > 0:mean = np.mean(slopes)diff = [abs(s - mean) for s in slopes]idx = np.argmax(diff)if (diff[idx] > threshold):slopes.pop(idx)lines.pop(idx)else:breakreturn linesleft_lines = reject_abnormal_lines(left_lines, threshold=0.2)
right_lines = reject_abnormal_lines(right_lines, threshold=0.2)def least_squares_fit(lines):"""將lines中的線段擬合成一條線段:param lines: 線段集合, [np.array([[x_1, y_1, x_2, y_2]]),np.array([[x_1, y_1, x_2, y_2]]),...,np.array([[x_1, y_1, x_2, y_2]])]:return: 線段上的兩點,np.array([[xmin, ymin], [xmax, ymax]])"""# 1. 取出所有坐標點"""在 OpenCV 中,線段通常用一個形狀為 (1, 4) 的 NumPy 數組表示,其中包含線段的兩個端點的坐標。具體來說,數組的格式為 [x1, y1, x2, y2],分別表示起點 (x1, y1) 和終點 (x2, y2)。"""x_coords = np.ravel([[line[0][0], line[0][2]] for line in lines])  # np.ravel 將二維列表展平為一維數組y_coords = np.ravel([[line[0][1], line[0][3]] for line in lines])# 2. 進行直線擬合.得到多項式系數poly = np.polyfit(x_coords, y_coords, deg=1)# 3. 根據多項式系數,計算兩個直線上的點,用于唯一確定這條直線point_min = (np.min(x_coords), np.polyval(poly, np.min(x_coords)))point_max = (np.max(x_coords), np.polyval(poly, np.max(x_coords)))return np.array([point_min, point_max], dtype=np.int32)print("left lane")
print(least_squares_fit(left_lines))
print("right lane")
print(least_squares_fit(right_lines))
-
直線繪制
繪制車道線 cv2.line
# @Author : LiZhongzheng
# 開發時間  :2025-04-29 16:23
import cv2
import numpy as npdef calculate_slope(line):"""計算線段line的斜率:param line: np.array([[x_1, y_1, x_2, y_2]]):return:"""x_1, y_1, x_2, y_2 = line[0]return (y_2 - y_1) / (x_2 - x_1)edge_img = cv2.imread('masked_edge_img.jpg', cv2.IMREAD_GRAYSCALE)
# 獲取所有線段
lines = cv2.HoughLinesP(edge_img, 1, np.pi / 180, 15, minLineLength=40,maxLineGap=20)
# 按照斜率分成車道線
left_lines = [line for line in lines if calculate_slope(line) > 0]
right_lines = [line for line in lines if calculate_slope(line) < 0]def reject_abnormal_lines(lines, threshold):"""剔除斜率不一致的線段:param lines: 線段集合, [np.array([[x_1, y_1, x_2, y_2]]),np.array([[x_1, y_1, x_2, y_2]]),...,np.array([[x_1, y_1, x_2, y_2]])]"""slopes = [calculate_slope(line) for line in lines]while len(lines) > 0:mean = np.mean(slopes)diff = [abs(s - mean) for s in slopes]idx = np.argmax(diff)if diff[idx] > threshold:slopes.pop(idx)lines.pop(idx)else:breakreturn linesleft_lines = reject_abnormal_lines(left_lines, threshold=0.2)
right_lines = reject_abnormal_lines(right_lines, threshold=0.2)def least_squares_fit(lines):"""將lines中的線段擬合成一條線段:param lines: 線段集合, [np.array([[x_1, y_1, x_2, y_2]]),np.array([[x_1, y_1, x_2, y_2]]),...,np.array([[x_1, y_1, x_2, y_2]])]:return: 線段上的兩點,np.array([[xmin, ymin], [xmax, ymax]])"""# 1. 取出所有坐標點x_coords = np.ravel([[line[0][0], line[0][2]] for line in lines])y_coords = np.ravel([[line[0][1], line[0][3]] for line in lines])# 2. 進行直線擬合.得到多項式系數poly = np.polyfit(x_coords, y_coords, deg=1)# 3. 根據多項式系數,計算兩個直線上的點,用于唯一確定這條直線point_min = (np.min(x_coords), np.polyval(poly, np.min(x_coords)))point_max = (np.max(x_coords), np.polyval(poly, np.max(x_coords)))return np.array([point_min, point_max], dtype=np.int32)left_line = least_squares_fit(left_lines)
right_line = least_squares_fit(right_lines)img = cv2.imread('img.jpg', cv2.IMREAD_COLOR)
cv2.line(img, tuple(left_line[0]), tuple(left_line[1]), color=(0, 255, 255), thickness=5)
cv2.line(img, tuple(right_line[0]), tuple(right_line[1]), color=(0, 255, 255), thickness=5)cv2.imshow('lane', img)
cv2.waitKey(0)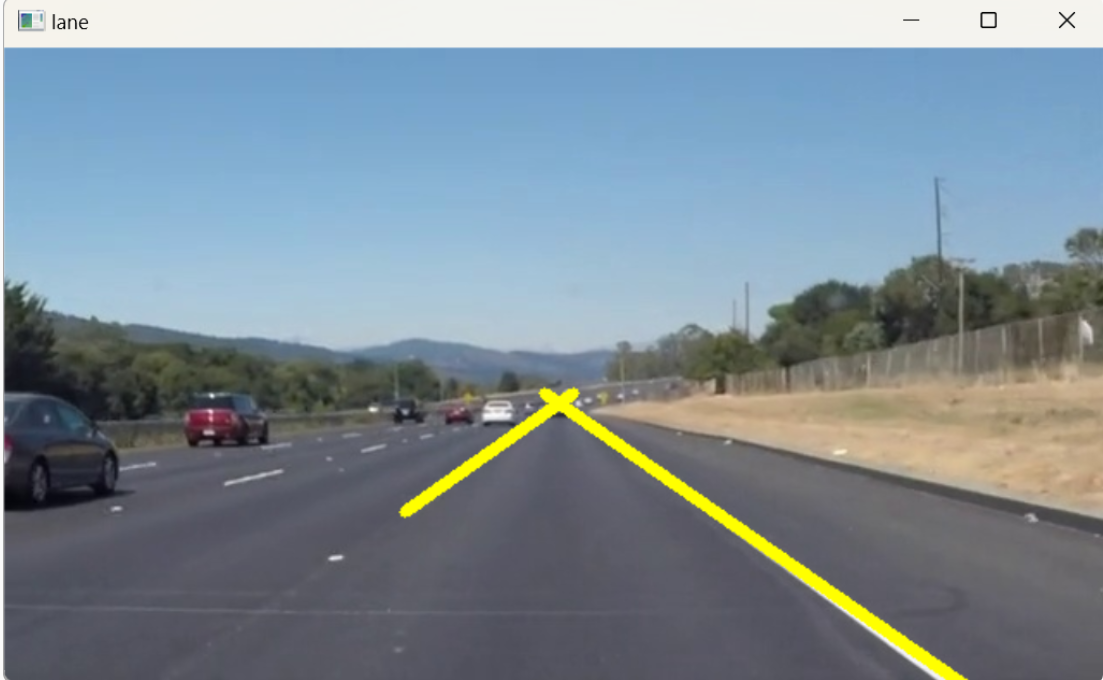
重難點講解:least_squares_fit()函數講解
該函數主要做了三個部分:提取坐標點、進行直線擬合、計算直線上的兩個點。
1. 提取所有坐標點
x_coords = np.ravel([[line[0][0], line[0][2]] for line in lines])
y_coords = np.ravel([[line[0][1], line[0][3]] for line in lines])
lines:- 輸入的線段集合,每個線段是一個形狀為
(1, 4)的 NumPy 數組,表示線段的兩個端點坐標 [x1,y1,x2,y2]。
- 輸入的線段集合,每個線段是一個形狀為
x_coords:- 提取所有線段的 x 坐標。
line[0][0]是起點的 x 坐標,line[0][2]是終點的 x 坐標。 - 使用列表推導式
[[line[0][0], line[0][2]] for line in lines]生成一個二維列表,包含所有線段的起點和終點的 x 坐標。 - 使用
np.ravel將二維列表展平為一維數組。
- 提取所有線段的 x 坐標。
y_coords:- 提取所有線段的 y 坐標。
line[0][1]是起點的 y 坐標,line[0][3]是終點的 y 坐標。 - 使用列表推導式
[[line[0][1], line[0][3]] for line in lines]生成一個二維列表,包含所有線段的起點和終點的 y 坐標。 - 使用
np.ravel將二維列表展平為一維數組。
- 提取所有線段的 y 坐標。
2. 進行直線擬合
poly = np.polyfit(x_coords, y_coords, deg=1)
np.polyfit:- 這是 NumPy 中的一個函數,用于對給定的數據點進行多項式擬合。
- 參數:
x_coords:自變量 x 的值。y_coords:因變量 y 的值。deg=1:指定擬合多項式的次數為 1,即線性擬合。
- 返回值:
- 返回擬合多項式的系數,從最高次項到常數項。對于線性擬合,返回兩個值
[slope, intercept],分別表示直線的斜率和截距。
- 返回擬合多項式的系數,從最高次項到常數項。對于線性擬合,返回兩個值
3. 計算直線上的兩個點
point_min = (np.min(x_coords), np.polyval(poly, np.min(x_coords)))
point_max = (np.max(x_coords), np.polyval(poly, np.max(x_coords)))
np.min(x_coords)和np.max(x_coords):- 分別計算 x 坐標中的最小值和最大值。
np.polyval(poly, x):- 這是 NumPy 中的一個函數,用于計算多項式在給定的 x 值處的 y 值。
- 參數:
poly:擬合多項式的系數數組。x:輸入的 x 值。
- 返回值:
- 返回多項式在 x 處的 y 值。
point_min和point_max:point_min是直線上的一個點,其 x 坐標為最小值,y 坐標通過多項式計算得到。point_max是直線上的一個點,其 x 坐標為最大值,y 坐標通過多項式計算得到。
4. 返回值
return np.array([point_min, point_max], dtype=np.int32)
- 返回一個形狀為
(2, 2)的 NumPy 數組,表示直線上的兩個點的坐標。這兩個點可以唯一確定一條直線。
視頻流讀寫
cv2.VideoCapture
? capture.read
- 基礎代碼介紹:
# @Author : LiZhongzheng
# 開發時間  :2025-04-29 17:06
import cv2capture = cv2.VideoCapture('video.mp4')
# capture = cv2.VideoCapture(0) #讀取當前設備第0個攝像頭
while True:ret, frame = capture.read()  # ret 視頻流的狀態,frame 當前幀的圖像cv2.imshow('frame', frame)cv2.waitKey(20)  # 相當于播放速率
cv2.VideoWriter
最后我們不僅可以識別圖片的車道線還可以識別視頻的車道線,原理相同,因為視頻是一幀一幀的,每一幀就是一個圖片。
# @Author : LiZhongzheng
# 開發時間  :2025-04-29 17:12
import cv2
import numpy as npdef get_edge_img(color_img, gaussian_ksize=5, gaussian_sigmax=1, canny_threshold1=50, canny_threshold2=100):"""灰度化,模糊,canny變換,提取邊緣:param color_img: 彩色圖,channels=3""""""cv2.GaussianBlur() 函數參數color_img:輸入的彩色圖像,必須是 3 通道的 BGR 圖像。gaussian_ksize(可選):高斯模糊的核大小。必須是正奇數,默認值為 5。gaussian_sigmax(可選):高斯模糊的 X 方向標準差,默認值為 1。"""gaussian = cv2.GaussianBlur(color_img, (gaussian_ksize, gaussian_ksize),gaussian_sigmax)  # 使用 cv2.GaussianBlur 對輸入圖像進行高斯模糊處理。高斯模糊可以減少圖像中的噪聲,使邊緣檢測更加穩定。gray_img = cv2.cvtColor(gaussian, cv2.COLOR_BGR2GRAY)edges_img = cv2.Canny(gray_img, canny_threshold1, canny_threshold2)return edges_imgdef roi_mask(gray_img):"""對gray_img進行掩膜:param gray_img: 灰度圖,channels=1"""poly_pts = np.array([[[0, 368], [300, 210], [340, 210], [640, 368]]])mask = np.zeros_like(gray_img)mask = cv2.fillPoly(mask, pts=poly_pts, color=255)img_mask = cv2.bitwise_and(gray_img, mask)return img_maskdef get_lines(edge_img):"""獲取edge_img中的所有線段:param edge_img: 標記邊緣的灰度圖"""def calculate_slope(line):"""計算線段line的斜率:param line: np.array([[x_1, y_1, x_2, y_2]]):return:"""x_1, y_1, x_2, y_2 = line[0]return (y_2 - y_1) / (x_2 - x_1)def reject_abnormal_lines(lines, threshold=0.2):"""剔除斜率不一致的線段:param lines: 線段集合, [np.array([[x_1, y_1, x_2, y_2]]),np.array([[x_1, y_1, x_2, y_2]]),...,np.array([[x_1, y_1, x_2, y_2]])]"""slopes = [calculate_slope(line) for line in lines]while len(lines) > 0:mean = np.mean(slopes)diff = [abs(s - mean) for s in slopes]idx = np.argmax(diff)if (diff[idx] > threshold):slopes.pop(idx)diff.pop(idx)else:breakreturn linesdef least_squares_fit(lines):"""將lines中的線段擬合成一條線段:param lines: 線段集合, [np.array([[x_1, y_1, x_2, y_2]]),np.array([[x_1, y_1, x_2, y_2]]),...,np.array([[x_1, y_1, x_2, y_2]])]:return: 線段上的兩點,np.array([[xmin, ymin], [xmax, ymax]])""""""np.polyfit 是 NumPy 庫中的一個函數,用于對給定的數據點進行多項式擬合。它通過最小二乘法找到一個多項式,使得這個多項式在給定數據點上的值與實際值之間的誤差平方和最小。"""x_coords = np.ravel([[line[0][0], line[0][2]] for line in lines])y_coords = np.ravel([[line[0][1], line[0][3]] for line in lines])poly = np.polyfit(x_coords, y_coords, deg=1)point_min = (np.min(x_coords), np.polyval(poly, np.min(x_coords)))  # 這行代碼的作用是計算擬合直線(或多項式曲線)上的一個特定點的坐標。具體來說,它計算的是當 x 取最小值時,對應的 y 值,并將這個點的坐標存儲為一個元組 (x_min, y_min)。point_max = (np.max(x_coords), np.polyval(poly, np.max(x_coords)))return np.array([point_min, point_max], dtype=np.int32)# 獲取所有線段lines = cv2.HoughLinesP(edge_img, 1, np.pi / 180, 15, minLineLength=40,maxLineGap=20)# 按照斜率分成車道線left_lines = [line for line in lines if calculate_slope(line) > 0]right_lines = [line for line in lines if calculate_slope(line) < 0]# 剔除離群線段left_lines = reject_abnormal_lines(left_lines)right_lines = reject_abnormal_lines(right_lines)return least_squares_fit(left_lines), least_squares_fit(right_lines)def draw_lines(img, lines):"""在img上繪制lines:param img::param lines: 兩條線段: [np.array([[xmin1, ymin1], [xmax1, ymax1]]), np.array([[xmin2, ymin2], [xmax2, ymax2]])]:return:"""left_line, right_line = linescv2.line(img, tuple(left_line[0]), tuple(left_line[1]), color=(0, 255, 255),thickness=5)cv2.line(img, tuple(right_line[0]), tuple(right_line[1]),color=(0, 255, 255), thickness=5)def show_lane(color_img):  # 封裝"""在color_img上畫出車道線:param color_img: 彩色圖,channels=3:return:"""edge_img = get_edge_img(color_img)mask_gray_img = roi_mask(edge_img)lines = get_lines(mask_gray_img)draw_lines(color_img, lines)return color_imgif __name__ == '__main__':capture = cv2.VideoCapture('video.mp4')while True:ret, frame = capture.read()frame = show_lane(frame)cv2.imshow('frame', frame)cv2.waitKey(10)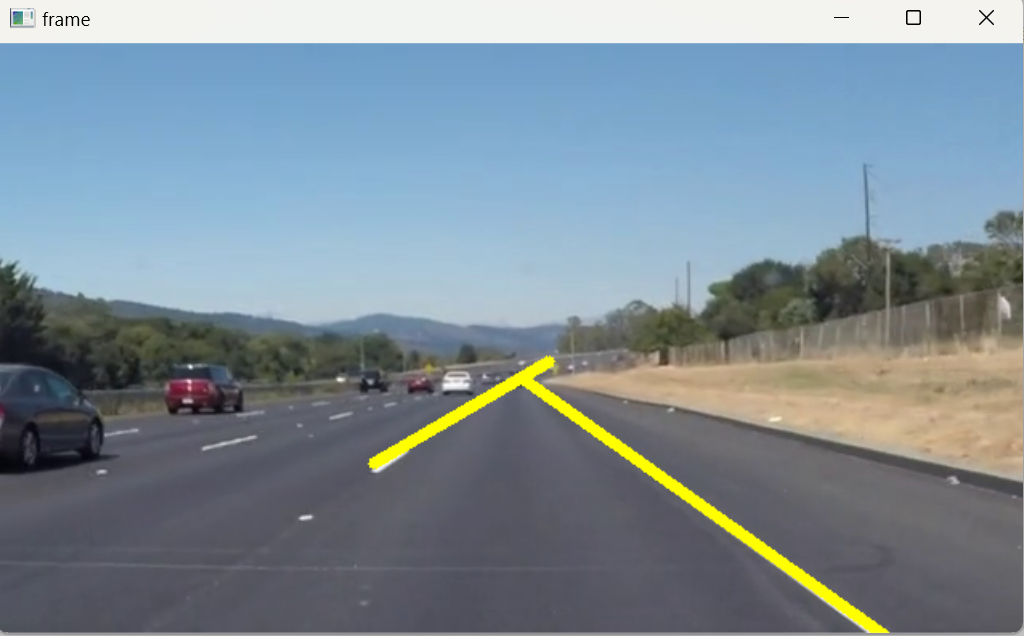
以上就是我對這個項目的總結。
同時再次說明我已經將項目上傳到github項目中,歡迎大家多多支持,你們的支持是我最大的前進動力~~~
再次感謝b站up主 嘉然今天吃帶變,以及各位大佬的寶貴意見。
祝好~


)

)


)

)


)
