基于計算機視覺的試卷答題區表格識別與提取技術
摘要
本文介紹了一種基于計算機視覺技術的試卷答題區表格識別與提取算法。該算法能夠自動從試卷圖像中定位答題區表格,執行圖像方向矯正,精確識別表格網格線,并提取每個答案單元格。本技術可廣泛應用于教育測評、考試管理系統等場景,極大提高答卷處理效率。
關鍵技術
- 表格區域提取與分割
- 圖像二值化預處理
- 多尺度形態學操作
- 水平線與豎線精確檢測
- 單元格定位與提取
1. 系統架構
我們設計的試卷答題區表格處理工具由以下主要模塊組成:
- 答題區定位:從整張試卷圖像中提取右上角的答題區表格
- 圖像預處理:進行二值化、去噪等操作以增強表格線條
- 表格網格識別:精確檢測水平線和豎線位置
- 單元格提取:根據網格線交點切割并保存各個答案單元格
處理流程:
輸入圖像 -> 答題區定位 -> 方向矯正 -> 圖像預處理 ->
網格線檢測 -> 單元格提取 -> 輸出結果
2. 核心功能實現
2.1 答題區表格定位
我們假設答題區通常位于試卷右上角,首先提取該區域并應用輪廓檢測算法:
# 提取右上角區域(答題區域通常在試卷右上角)
x_start = int(width * 0.6)
y_start = 0
w = width - x_start
h = int(height * 0.5)# 提取區域
region = img[y_start:y_start + h, x_start:x_start + w]
接著使用形態學操作提取線條并查找表格輪廓:
# 轉為灰度圖并二值化
gray = cv2.cvtColor(region, cv2.COLOR_BGR2GRAY)
binary = cv2.adaptiveThreshold(gray, 255, cv2.ADAPTIVE_THRESH_GAUSSIAN_C,cv2.THRESH_BINARY_INV, 11, 2)# 使用形態學操作檢測線條
horizontal_lines = cv2.morphologyEx(binary, cv2.MORPH_OPEN, kernel_h, iterations=2)
vertical_lines = cv2.morphologyEx(binary, cv2.MORPH_OPEN, kernel_v, iterations=2)
2.2 圖像預處理
為了增強表格線條特征,我們執行以下預處理步驟:
# 高斯平滑去噪
blurred = cv2.GaussianBlur(gray, (5, 5), 0)# 自適應閾值二值化
binary = cv2.adaptiveThreshold(blurred, 255, cv2.ADAPTIVE_THRESH_GAUSSIAN_C, cv2.THRESH_BINARY_INV, 21, 5)# 形態學操作填充小空隙
kernel = np.ones((3, 3), np.uint8)
binary = cv2.morphologyEx(binary, cv2.MORPH_CLOSE, kernel)
2.3 表格網格線識別
這是本算法的核心部分,我們分別檢測水平線和豎線:
2.3.1 水平線檢測
使用形態學開運算提取水平線,然后計算投影找到線條位置:
horizontal_kernel = cv2.getStructuringElement(cv2.MORPH_RECT, (horizontal_size, 1))
horizontal_lines = cv2.morphologyEx(binary_image, cv2.MORPH_OPEN, horizontal_kernel, iterations=2)# 提取水平線坐標 - 基于行投影
h_coords = []
h_projection = np.sum(horizontal_lines, axis=1)
for i in range(1, len(h_projection) - 1):if h_projection[i] > h_projection[i - 1] and h_projection[i] > h_projection[i + 1] and h_projection[i] > width // 5:h_coords.append(i)
2.3.2 豎線檢測
豎線檢測采用多尺度策略,使用不同大小的結構元素,提高檢測的魯棒性:
# 使用不同大小的結構元素進行豎線檢測
vertical_kernels = [cv2.getStructuringElement(cv2.MORPH_RECT, (1, (table_bottom - table_top) // 12)),  # 細線cv2.getStructuringElement(cv2.MORPH_RECT, (1, (table_bottom - table_top) // 8)),  # 中等cv2.getStructuringElement(cv2.MORPH_RECT, (1, (table_bottom - table_top) // 4))  # 粗線
]# 合并不同尺度的檢測結果
vertical_lines = np.zeros_like(binary_image)
for kernel in vertical_kernels:v_lines = cv2.morphologyEx(binary_image, cv2.MORPH_OPEN, kernel, iterations=1)vertical_lines = cv2.bitwise_or(vertical_lines, v_lines)
2.4 表格豎線位置精確校正
由于豎線檢測可能存在偏左問題,我們實現了復雜的位置校正算法:
# 豎線位置修正:解決偏左問題 - 檢測實際線條中心位置
v_coords_corrected = []
for idx, v_coord in enumerate(v_coords_detected):# 第2-11根豎線特殊處理if 1 <= idx <= 10:  # 第2-11根豎線search_range_left = 2  # 左側搜索范圍更小search_range_right = 12  # 右側搜索范圍大幅增大else:search_range_left = 5search_range_right = 5# 在搜索范圍內找到峰值中心位置# 對于特定豎線,使用加權平均來偏向右側if 1 <= idx <= 10:window = col_sum[left_bound:right_bound+1]weights = np.linspace(0.3, 2.0, len(window))  # 更強的右側權重weighted_window = window * weightsmax_pos = left_bound + np.argmax(weighted_window)# 強制向右偏移max_pos += 3else:max_pos = left_bound + np.argmax(col_sum[left_bound:right_bound+1])
2.4.1 不等間距網格處理
我們根據實際表格特點,處理了第一列寬度與其他列不同的情況:
# 設置第一列的寬度為其他列的1.3倍
first_column_width_ratio = 1.3# 計算除第一列外每列的寬度
remaining_width = right_bound - left_bound
regular_column_width = remaining_width / (expected_vlines - 1 + (first_column_width_ratio - 1))
2.5 單元格提取與保存
根據檢測到的網格線,我們提取出每個單元格:
# 提取單元格的過程
cell_img = image[y1_m:y2_m, x1_m:x2_m].copy()# 保存單元格圖片
cell_filename = f'cell_0{q_num:02d}.png'
cell_path = os.path.join(output_dir, cell_filename)
cv2.imwrite(cell_path, cell_img)
3. 技術創新點
- 多尺度形態學操作:使用不同尺寸的結構元素檢測豎線,提高了檢測的魯棒性
- 表格線位置動態校正:針對不同位置的豎線采用不同的校正策略,解決了豎線偏左問題
- 不等間距網格處理:通過特殊計算處理第一列寬度不同的情況,更好地適應實際試卷樣式
- 加權峰值搜索:使用加權策略進行峰值搜索,提高了線條中心位置的準確性
4. 使用示例
4.1 基本用法
from image_processing import process_image# 處理單張圖像
input_image = "./images/1.jpg"
output_dir = "./output"
image_paths = process_image(input_image, output_dir)print(f"處理成功: 共生成{len(image_paths)}個單元格圖片")
4.2 批量處理
我們還提供了批量處理多張試卷圖像的功能:
# 批量處理目錄中的所有圖像
for img_file in image_files:img_path = os.path.join(images_dir, img_file)output_dir = os.path.join(output_base_dir, f"result_{img_name}")image_paths = process_image(img_path, output_dir)
4.3 完整代碼
"""
試卷答題區表格處理工具
1. 從試卷提取答題區表格
2. 對表格進行方向矯正
3. 切割表格單元格并保存所有25道題的答案單元格
"""
import os
import cv2
import numpy as np
import argparse
import sys
import time
import shutilclass AnswerSheetProcessor:"""試卷答題區表格處理工具類"""def __init__(self):"""初始化處理器"""passdef process(self, input_image_path, output_dir):"""處理試卷答題區,提取表格并保存單元格Args:input_image_path: 輸入圖像路徑output_dir: 輸出單元格圖像的目錄Returns:處理后的圖片路徑列表,失敗時返回空列表"""os.makedirs(output_dir, exist_ok=True)temp_dir = os.path.join(os.path.dirname(output_dir), f"temp_{time.strftime('%Y%m%d_%H%M%S')}")os.makedirs(temp_dir, exist_ok=True)try:# 1. 提取答題區表格table_img, _ = self._extract_answer_table(input_image_path, temp_dir)if table_img is None:print("無法提取答題區表格")return []# 保存提取的原始表格圖像# original_table_path = os.path.join(output_dir, "original_table.png")# cv2.imwrite(original_table_path, table_img)# 2. 矯正表格方向corrected_table = self._correct_table_orientation(table_img)# cv2.imwrite(os.path.join(output_dir, "corrected_table.png"), corrected_table)# 3. 提取表格單元格image_paths = self._process_and_save_cells(corrected_table, temp_dir, output_dir)# 4. 清理臨時目錄shutil.rmtree(temp_dir, ignore_errors=True)return image_pathsexcept Exception as e:print(f"處理失敗: {str(e)}")shutil.rmtree(temp_dir, ignore_errors=True)return []def _extract_answer_table(self, image, output_dir):"""提取試卷答題區表格"""# 讀取圖像if isinstance(image, str):img = cv2.imread(image)if img is None:return None, Noneelse:img = image# 調整圖像大小以提高處理速度max_width = 1500if img.shape[1] > max_width:scale = max_width / img.shape[1]img = cv2.resize(img, None, fx=scale, fy=scale)# 獲取圖像尺寸height, width = img.shape[:2]# 提取右上角區域(答題區域通常在試卷右上角)x_start = int(width * 0.6)y_start = 0w = width - x_starth = int(height * 0.5)# 提取區域region = img[y_start:y_start + h, x_start:x_start + w]# 轉為灰度圖并二值化gray = cv2.cvtColor(region, cv2.COLOR_BGR2GRAY)binary = cv2.adaptiveThreshold(gray, 255, cv2.ADAPTIVE_THRESH_GAUSSIAN_C,cv2.THRESH_BINARY_INV, 11, 2)# 檢測表格線kernel_h = cv2.getStructuringElement(cv2.MORPH_RECT, (max(25, w // 20), 1))kernel_v = cv2.getStructuringElement(cv2.MORPH_RECT, (1, max(25, h // 20)))horizontal_lines = cv2.morphologyEx(binary, cv2.MORPH_OPEN, kernel_h, iterations=2)vertical_lines = cv2.morphologyEx(binary, cv2.MORPH_OPEN, kernel_v, iterations=2)# 合并線條grid_lines = cv2.add(horizontal_lines, vertical_lines)# 膨脹線條kernel = np.ones((3, 3), np.uint8)dilated_lines = cv2.dilate(grid_lines, kernel, iterations=1)# 查找輪廓contours, _ = cv2.findContours(dilated_lines, cv2.RETR_EXTERNAL, cv2.CHAIN_APPROX_SIMPLE)# 篩選可能的表格輪廓valid_contours = []for contour in contours:x, y, w, h = cv2.boundingRect(contour)area = cv2.contourArea(contour)if area < 1000:continueaspect_ratio = float(w) / h if h > 0 else 0if 0.1 <= aspect_ratio <= 3.0:valid_contours.append((x, y, w, h, area))if valid_contours:# 選擇面積最大的輪廓valid_contours.sort(key=lambda c: c[4], reverse=True)x, y, w, h, _ = valid_contours[0]# 調整回原圖坐標x_abs = x_start + xy_abs = y_start + y# 提取表格區域并加一些padding確保完整padding = 10x_abs = max(0, x_abs - padding)y_abs = max(0, y_abs - padding)w_padded = min(width - x_abs, w + 2 * padding)h_padded = min(height - y_abs, h + 2 * padding)table_region = img[y_abs:y_abs + h_padded, x_abs:x_abs + w_padded]return table_region, (x_abs, y_abs, w_padded, h_padded)# 如果未找到有效輪廓,返回預估區域x_start = int(width * 0.75)y_start = int(height * 0.15)w = int(width * 0.2)h = int(height * 0.4)x_start = max(0, min(x_start, width - 1))y_start = max(0, min(y_start, height - 1))w = min(width - x_start, w)h = min(height - y_start, h)return img[y_start:y_start + h, x_start:x_start + w], (x_start, y_start, w, h)def _correct_table_orientation(self, table_img):"""矯正表格方向(逆時針旋轉90度)"""if table_img is None:return Nonetry:return cv2.rotate(table_img, cv2.ROTATE_90_COUNTERCLOCKWISE)except Exception as e:print(f"表格方向矯正失敗: {str(e)}")return table_imgdef _process_and_save_cells(self, table_img, temp_dir, output_dir):"""處理表格并保存單元格"""try:# 預處理圖像binary = self._preprocess_image(table_img)# cv2.imwrite(os.path.join(output_dir, "binary_table.png"), binary)# 檢測表格網格h_lines, v_lines = self._detect_table_cells(binary, table_img.shape, output_dir)# 如果未檢測到足夠的網格線if len(h_lines) < 2 or len(v_lines) < 2:print("未檢測到足夠的表格線")return []# 可視化并保存表格網格self._visualize_grid(table_img, h_lines, v_lines, output_dir)# 提取并直接保存單元格image_paths = self._extract_and_save_cells(table_img, h_lines, v_lines, output_dir)return image_pathsexcept Exception as e:print(f"表格處理錯誤: {str(e)}")return []def _preprocess_image(self, image):"""表格圖像預處理"""if image is None:return None# 轉為灰度圖if len(image.shape) == 3:gray = cv2.cvtColor(image, cv2.COLOR_BGR2GRAY)else:gray = image.copy()# 高斯平滑blurred = cv2.GaussianBlur(gray, (5, 5), 0)# 自適應閾值二值化binary = cv2.adaptiveThreshold(blurred, 255, cv2.ADAPTIVE_THRESH_GAUSSIAN_C, cv2.THRESH_BINARY_INV, 21, 5)# 進行形態學操作,填充小空隙kernel = np.ones((3, 3), np.uint8)binary = cv2.morphologyEx(binary, cv2.MORPH_CLOSE, kernel)return binarydef _detect_table_cells(self, binary_image, image_shape, output_dir):"""檢測表格網格,基于圖像真實表格線精確定位"""height, width = image_shape[:2]# 1. 先檢測水平線horizontal_size = width // 10horizontal_kernel = cv2.getStructuringElement(cv2.MORPH_RECT, (horizontal_size, 1))horizontal_lines = cv2.morphologyEx(binary_image, cv2.MORPH_OPEN, horizontal_kernel, iterations=2)# 提取水平線坐標h_coords = []h_projection = np.sum(horizontal_lines, axis=1)for i in range(1, len(h_projection) - 1):if h_projection[i] > h_projection[i - 1] and h_projection[i] > h_projection[i + 1] and h_projection[i] > width // 5:h_coords.append(i)# 使用聚類合并相近的水平線h_coords = self._cluster_coordinates(h_coords, eps=height // 30)# 2. 確保我們至少有足夠的水平線定義表格區域if len(h_coords) < 2:print("警告: 水平線檢測不足,無法確定表格范圍")h_lines = [(0, int(y), width, int(y)) for y in h_coords]v_lines = []return h_lines, v_lines# 獲取表格垂直范圍h_coords.sort()table_top = int(h_coords[0])table_bottom = int(h_coords[-1])# 3. 增強豎線檢測 - 使用多尺度檢測策略# 使用不同大小的結構元素進行豎線檢測vertical_kernels = [cv2.getStructuringElement(cv2.MORPH_RECT, (1, (table_bottom - table_top) // 12)),  # 細線cv2.getStructuringElement(cv2.MORPH_RECT, (1, (table_bottom - table_top) // 8)),  # 中等cv2.getStructuringElement(cv2.MORPH_RECT, (1, (table_bottom - table_top) // 4))  # 粗線]# 合并不同尺度的檢測結果vertical_lines = np.zeros_like(binary_image)for kernel in vertical_kernels:v_lines = cv2.morphologyEx(binary_image, cv2.MORPH_OPEN, kernel, iterations=1)vertical_lines = cv2.bitwise_or(vertical_lines, v_lines)# 只關注表格區域內的豎線table_region_v = vertical_lines[table_top:table_bottom, :]# 計算列投影col_sum = np.sum(table_region_v, axis=0)# 4. 更精準地尋找豎線位置# 使用自適應閾值計算local_max_width = width // 25  # 更精細的局部最大值搜索窗口threshold_ratio = 0.15  # 降低閾值以捕獲更多可能的豎線# 自適應閾值計算threshold = np.max(col_sum) * threshold_ratio# 掃描所有列查找峰值v_coords_raw = []i = 0while i < len(col_sum):# 查找局部范圍內的峰值local_end = min(i + local_max_width, len(col_sum))local_peak = i# 找到局部最大值for j in range(i, local_end):if col_sum[j] > col_sum[local_peak]:local_peak = j# 如果局部最大值大于閾值,認為是豎線if col_sum[local_peak] > threshold:v_coords_raw.append(local_peak)# 跳過已處理的區域i = local_peak + local_max_width // 2else:i += 1# 5. 去除過于接近的豎線(可能是同一條線被重復檢測)v_coords_detected = self._cluster_coordinates(v_coords_raw, eps=width // 50)  # 使用更小的合并閾值# 6. 檢查找到的豎線數量expected_vlines = 15  # 預期應有15條豎線print(f"初步檢測到豎線數量: {len(v_coords_detected)}")# 7. 處理識別結果if len(v_coords_detected) > 0:# 7.1 獲取表格的左右邊界v_coords_detected.sort()  # 確保按位置排序# 豎線位置修正:解決偏左問題 - 檢測實際線條中心位置v_coords_corrected = []for idx, v_coord in enumerate(v_coords_detected):# 在豎線坐標附近尋找準確的線條中心# 對于第2-11根豎線,使用更大的搜索范圍向右偏移if 1 <= idx <= 10:  # 第2-11根豎線search_range_left = 2  # 左側搜索范圍更小search_range_right = 12  # 右側搜索范圍大幅增大else:search_range_left = 5search_range_right = 5left_bound = max(0, v_coord - search_range_left)right_bound = min(width - 1, v_coord + search_range_right)if left_bound < right_bound and left_bound < len(col_sum) and right_bound < len(col_sum):# 在搜索范圍內找到峰值中心位置# 對于第2-11根豎線,使用加權平均來偏向右側if 1 <= idx <= 10:# 計算加權平均,右側權重更大window = col_sum[left_bound:right_bound+1]weights = np.linspace(0.3, 2.0, len(window))  # 更強的右側權重weighted_window = window * weightsmax_pos = left_bound + np.argmax(weighted_window)# 強制向右偏移2-3像素max_pos += 3max_pos = min(right_bound, max_pos)else:max_pos = left_bound + np.argmax(col_sum[left_bound:right_bound+1])v_coords_corrected.append(max_pos)else:v_coords_corrected.append(v_coord)# 使用修正后的坐標v_coords_detected = v_coords_correctedleft_bound = v_coords_detected[0]  # 最左邊的豎線right_bound = v_coords_detected[-1]  # 最右邊的豎線# 7.2 計算理想的等距離豎線位置,但使第一列寬度比其他列寬ideal_vlines = []# 設置第一列的寬度為其他列的1.5倍first_column_width_ratio = 1.3# 計算除第一列外每列的寬度remaining_width = right_bound - left_boundregular_column_width = remaining_width / (expected_vlines - 1 + (first_column_width_ratio - 1))# 設置第一列ideal_vlines.append(int(left_bound))# 設置第二列位置ideal_vlines.append(int(left_bound + regular_column_width * first_column_width_ratio))# 設置剩余列for i in range(2, expected_vlines):ideal_vlines.append(int(left_bound + regular_column_width * (i + (first_column_width_ratio - 1))))# 7.3 使用修正后的列位置v_coords = ideal_vlines# 進一步向右偏移第2-11根豎線(總共15根)for i in range(1, 11):if i < len(v_coords):v_coords[i] += 3  # 向右偏移3像素else:# 如果沒有檢測到豎線,使用預估等距離print("未檢測到任何豎線,使用預估等距離")left_bound = width // 10right_bound = width * 9 // 10# 計算除第一列外每列的寬度first_column_width_ratio = 1.5remaining_width = right_bound - left_boundregular_column_width = remaining_width / (expected_vlines - 1 + (first_column_width_ratio - 1))# 設置列位置v_coords = []v_coords.append(int(left_bound))v_coords.append(int(left_bound + regular_column_width * first_column_width_ratio))for i in range(2, expected_vlines):v_coords.append(int(left_bound + regular_column_width * (i + (first_column_width_ratio - 1))))# 8. 檢驗最終的豎線位置是否合理if len(v_coords) == expected_vlines:# 計算相鄰豎線間距spacings = [v_coords[i + 1] - v_coords[i] for i in range(len(v_coords) - 1)]avg_spacing = sum(spacings[1:]) / len(spacings[1:])  # 不計入第一列的寬度# 檢查是否有間距異常的豎線(除第一列外)for i in range(1, len(spacings)):if abs(spacings[i] - avg_spacing) > avg_spacing * 0.2:  # 如果間距偏差超過20%print(f"警告: 第{i + 1}和第{i + 2}豎線之間間距異常, 實際:{spacings[i]}, 平均:{avg_spacing}")# 如果是最后一個間距異常,可能是最后一條豎線位置不準if i == len(spacings) - 1:v_coords[-1] = v_coords[-2] + int(avg_spacing)print(f"修正最后一條豎線位置: {v_coords[-1]}")# 9. 轉換為線段表示h_lines = [(0, int(y), width, int(y)) for y in h_coords]v_lines = [(int(x), int(table_top), int(x), int(table_bottom)) for x in v_coords]# 10. 強制補充缺失的水平線 - 期望有5條水平線(4行表格)if len(h_lines) < 5 and len(h_lines) >= 2:h_lines.sort(key=lambda x: x[1])top_y = int(h_lines[0][1])bottom_y = int(h_lines[-1][1])height_range = bottom_y - top_y# 計算應有的4等分位置expected_y_positions = [top_y + int(height_range * i / 4) for i in range(1, 4)]# 添加缺失的水平線new_h_lines = list(h_lines)for y_pos in expected_y_positions:# 檢查是否已存在接近該位置的線exist = Falsefor line in h_lines:if abs(line[1] - y_pos) < height // 20:exist = Truebreakif not exist:new_h_lines.append((0, int(y_pos), width, int(y_pos)))h_lines = new_h_lines# 11. 最終排序h_lines = sorted(h_lines, key=lambda x: x[1])v_lines = sorted(v_lines, key=lambda x: x[0])print(f"最終水平線數量: {len(h_lines)}")print(f"最終豎線數量: {len(v_lines)}")# 12. 計算并打印豎線間距,用于檢驗均勻性if len(v_lines) > 1:spacings = []for i in range(len(v_lines) - 1):spacing = v_lines[i + 1][0] - v_lines[i][0]spacings.append(spacing)avg_spacing = sum(spacings[1:]) / len(spacings[1:])  # 不計入第一列的寬度print(f"豎線平均間距: {avg_spacing:.2f}像素")print(f"豎線間距: {spacings}")return h_lines, v_linesdef _cluster_coordinates(self, coords, eps=10):"""合并相近的坐標"""if not coords:return []coords = sorted(coords)clusters = []current_cluster = [coords[0]]for i in range(1, len(coords)):if coords[i] - coords[i - 1] <= eps:current_cluster.append(coords[i])else:clusters.append(int(sum(current_cluster) / len(current_cluster)))current_cluster = [coords[i]]if current_cluster:clusters.append(int(sum(current_cluster) / len(current_cluster)))return clustersdef _visualize_grid(self, image, h_lines, v_lines, output_dir):"""可視化檢測到的網格線并保存結果圖像"""# 復制原圖用于繪制result = image.copy()if len(result.shape) == 2:result = cv2.cvtColor(result, cv2.COLOR_GRAY2BGR)# 繪制水平線for line in h_lines:x1, y1, x2, y2 = linecv2.line(result, (int(x1), int(y1)), (int(x2), int(y2)), (0, 0, 255), 2)# 繪制垂直線for line in v_lines:x1, y1, x2, y2 = linecv2.line(result, (int(x1), int(y1)), (int(x2), int(y2)), (255, 0, 0), 2)# 繪制交點for h_line in h_lines:for v_line in v_lines:y = h_line[1]x = v_line[0]cv2.circle(result, (int(x), int(y)), 3, (0, 255, 0), -1)# 只保存grid_on_image.pngif output_dir:cv2.imwrite(os.path.join(output_dir, "grid_on_image.png"), result)def _extract_and_save_cells(self, image, h_lines, v_lines, output_dir, margin=3):"""提取單元格并保存到輸出目錄"""height, width = image.shape[:2]# 確保線條按坐標排序h_lines = sorted(h_lines, key=lambda x: x[1])v_lines = sorted(v_lines, key=lambda x: x[0])# 保存圖片路徑image_paths = []# 檢查線條數量是否足夠if len(h_lines) < 4 or len(v_lines) < 10:print(f"警告: 線條數量不足(水平線={len(h_lines)}, 垂直線={len(v_lines)})")if len(h_lines) < 2 or len(v_lines) < 2:print("錯誤: 線條數量太少,無法提取任何單元格")return image_paths# 記錄表格結構print(f"表格結構: {len(h_lines)}行, {len(v_lines) - 1}列")# 創建題號到行列索引的映射question_mapping = {}# 第2行是1-13題(列索引從1開始,0列是題號列)for i in range(1, 14):if i < len(v_lines):question_mapping[i] = (1, i)# 第4行是14-25題(列索引從1開始,0列是題號列)for i in range(14, 26):col_idx = i - 13  # 14題對應第1列,15題對應第2列,...if col_idx < len(v_lines) and 3 < len(h_lines):question_mapping[i] = (3, col_idx)# 提取每道題的單元格saved_questions = []for q_num in range(1, 26):if q_num not in question_mapping:print(f"題號 {q_num} 沒有對應的行列索引映射")continuerow_idx, col_idx = question_mapping[q_num]if row_idx >= len(h_lines) - 1 or col_idx >= len(v_lines) - 1:print(f"題號 {q_num} 的行列索引 ({row_idx}, {col_idx}) 超出表格范圍")continuetry:# 獲取單元格邊界x1 = int(v_lines[col_idx][0])y1 = int(h_lines[row_idx][1])x2 = int(v_lines[col_idx + 1][0])y2 = int(h_lines[row_idx + 1][1])# 打印單元格信息用于調試if q_num in [1, 4, 13, 14, 25]:  # 打印關鍵單元格的位置信息print(f"題號 {q_num} 單元格: x1={x1}, y1={y1}, x2={x2}, y2={y2}, 寬={x2 - x1}, 高={y2 - y1}")# 添加邊距,避免包含邊框線x1_m = min(width - 1, max(0, x1 + margin))y1_m = min(height - 1, max(0, y1 + margin))x2_m = max(0, min(width, x2 - margin))y2_m = max(0, min(height, y2 - margin))# 檢查單元格尺寸if x2_m <= x1_m or y2_m <= y1_m or (x2_m - x1_m) < 5 or (y2_m - y1_m) < 5:print(f"跳過無效單元格: 題號 {q_num}, 尺寸過小")continue# 提取單元格cell_img = image[y1_m:y2_m, x1_m:x2_m].copy()# 檢查單元格是否為空圖像if cell_img.size == 0 or cell_img.shape[0] == 0 or cell_img.shape[1] == 0:print(f"跳過空單元格: 題號 {q_num}")continue# 保存單元格圖片cell_filename = f'cell_0{q_num:02d}.png'cell_path = os.path.join(output_dir, cell_filename)cv2.imwrite(cell_path, cell_img)# 添加到路徑列表和已保存題號列表image_paths.append(cell_path)saved_questions.append(q_num)except Exception as e:print(f"提取題號 {q_num} 時出錯: {str(e)}")print(f"已保存 {len(saved_questions)} 個單元格,題號: {sorted(saved_questions)}")return image_pathsdef process_image(input_image_path, output_dir):"""處理試卷答題區,提取表格并保存單元格"""processor = AnswerSheetProcessor()return processor.process(input_image_path, output_dir)def main():"""主函數:解析命令行參數并執行處理流程"""# 解析命令行參數parser = argparse.ArgumentParser(description='試卷答題區表格處理工具')parser.add_argument('--image', type=str, default="./images/12.jpg", help='輸入圖像路徑')parser.add_argument('--output', type=str, default="./output", help='輸出目錄')args = parser.parse_args()# 檢查圖像是否存在if not os.path.exists(args.image):print(f"圖像文件不存在: {args.image}")return 1# 確保輸出目錄存在os.makedirs(args.output, exist_ok=True)print(f"開始處理圖像: {args.image}")print(f"輸出目錄: {args.output}")# 處理圖像try:image_paths = process_image(args.image, args.output)if image_paths:print(f"處理成功: 共生成{len(image_paths)}個單元格圖片")print(f"所有結果已保存到: {args.output}")return 0else:print("處理失敗")return 1except Exception as e:print(f"處理過程中發生錯誤: {str(e)}")return 1if __name__ == "__main__":sys.exit(main())
5. 應用場景
- 考試批閱系統:大規模考試的答題卡批閱
- 教育測評平臺:智能化教育測評系統
- 試卷數字化處理:將紙質試卷轉換為電子數據
- 教學檢測系統:快速評估學生答題情況
6. 算法效果展示
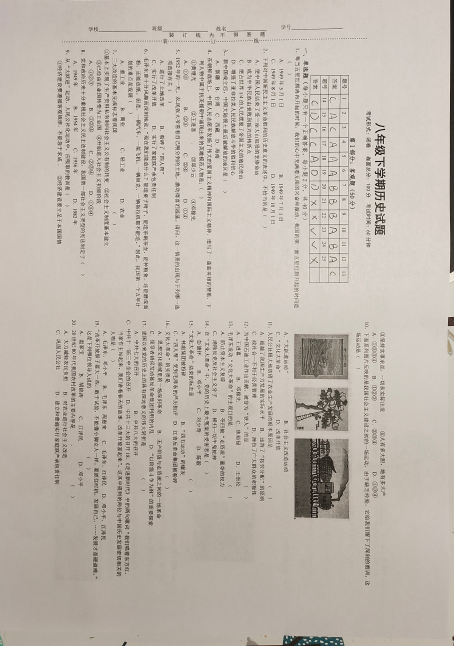
上圖是測試的試卷圖片,要求提取出填寫的答題區。
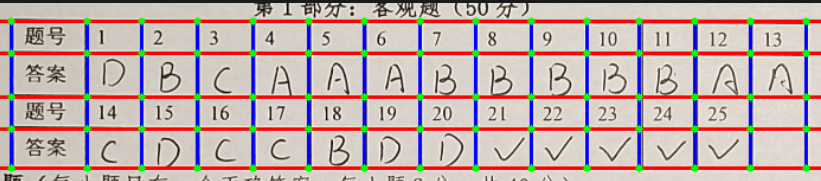
上圖展示了表格網格識別的效果,藍色線條表示豎線,紅色線條表示水平線,綠色點表示線條交點。
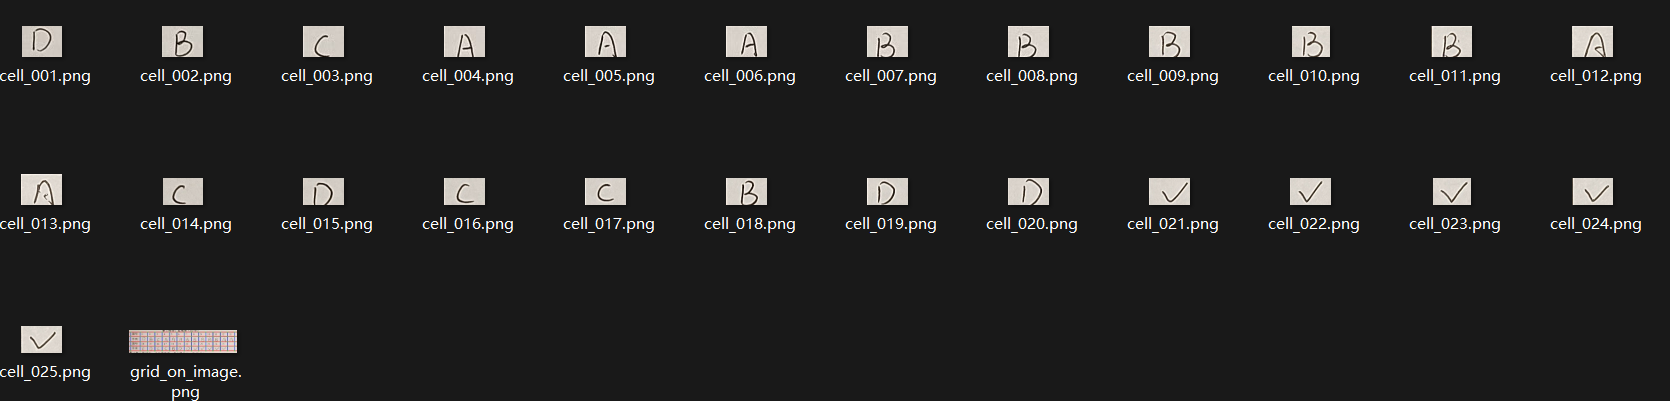
上圖是從試卷中提取出的答案單元格。
7. 總結與展望
本文介紹的試卷答題區表格識別技術,通過計算機視覺算法實現了高效準確的表格定位和單元格提取。該技術有以下優勢:
- 高精度:采用多尺度策略和位置校正算法,提高了表格線識別的精度
- 高適應性:能夠處理不同樣式的試卷答題區
- 高效率:自動化處理流程大幅提高了試卷處理效率
未來我們將繼續優化算法,提高對更復雜表格的識別能力,并結合OCR技術實現答案內容的自動識別。
參考資料
- OpenCV官方文檔: https://docs.opencv.org/
- 數字圖像處理 - 岡薩雷斯
- 計算機視覺:算法與應用 - Richard Szeliski
)

)
)


PyTorch版)
)


![[python] 函數基礎](http://pic.xiahunao.cn/[python] 函數基礎)