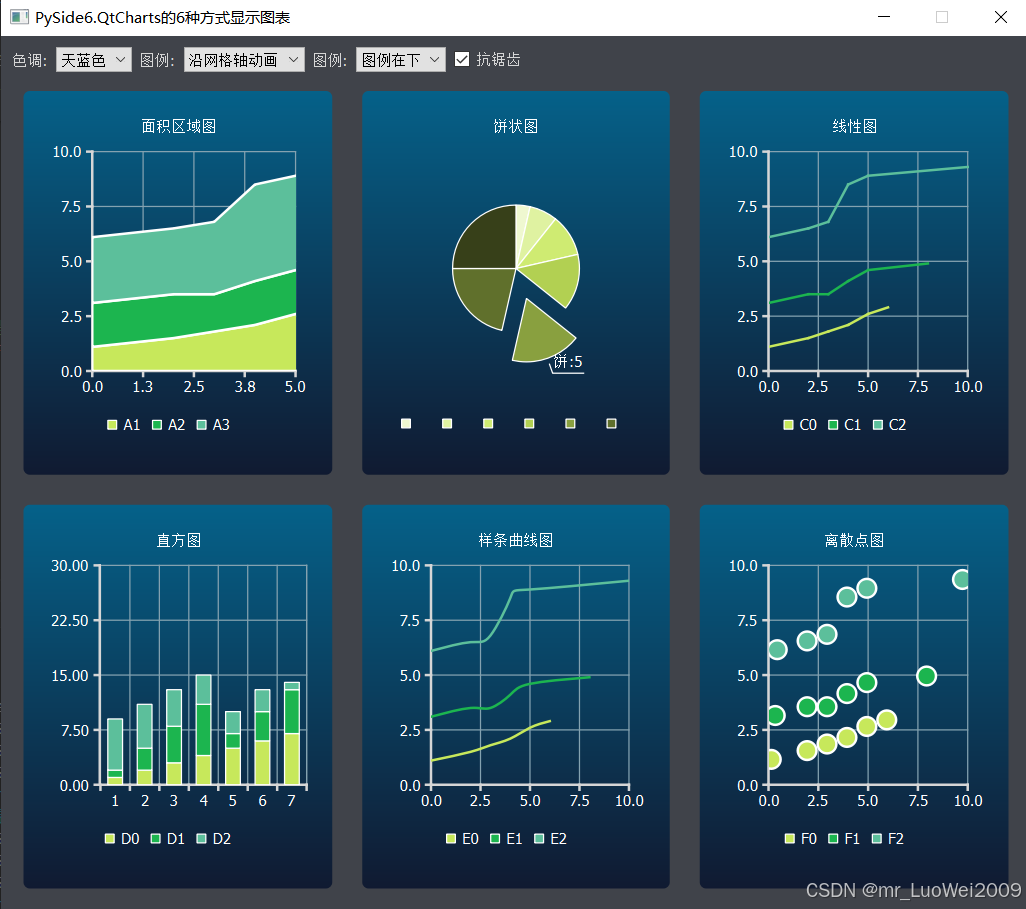
PySide6的QtCharts類支持繪制各種型狀的圖表,如面積區域圖、餅狀圖、折線圖、直方圖、線條曲線圖、離散點圖等,下面的代碼是采用示例數據繪制這6種圖表的示例代碼,并可實現動畫顯示效果,實際使用時參照代碼中示例數據的格式將實際數據替換即可實現圖表格式的顯示
本代碼是將PySide6官方示例代碼增加中文注釋,同時將代碼中隨機產生的數據改為更直觀的示例列表數據值,以更直觀的了解數據同圖表顯示的關系。
 對應python代碼如下:
# PySide6.QtCharts的6種方式顯示圖表的示例程序
from __future__ import annotations
?
import sys
from PySide6.QtCore import QPointF, Qt
from PySide6.QtGui import QColor, QPainter, QPalette
from PySide6.QtWidgets import (QApplication, QMainWindow, QSizePolicy,
? ? ? ? ? ? ? ? ? ? ? ? ? ? ? ?QWidget)
from PySide6.QtCharts import (QAreaSeries, QBarSet, QChart, QChartView,
? ? ? ? ? ? ? ? ? ? ? ? ? ? ? QLineSeries, QPieSeries, QScatterSeries,
? ? ? ? ? ? ? ? ? ? ? ? ? ? ? QSplineSeries, QStackedBarSeries)
?
from ui_themewidget import Ui_ThemeWidgetForm as ui ? ?
?
from random import random, uniform
?
#示例主窗口
class ThemeWidget(QWidget):
? ? def __init__(self, parent):
? ? ? ? QWidget.__init__(self, parent)
?
? ? ? ? self.charts = [] ? #定義本示例要用的圖表:共下面6種類型
?
? ? ? ? self.ui = ui() ? ?#為ui設置器設計的窗體實例化一對象,要調用此模塊中的控件對象或繼續初始化窗體布局
? ? ? ?
? ? ? ? self.ui.setupUi(self) ? ? ? ?#初始化主窗口自身界面(使用設計器編制的窗口themewidget.ui編繹成窗口模塊文件ui_themewidget.py.在終端命令行中輸入: ?PySide6-uic 'themewidget.ui' ?-o 'ui_themewidget.py' )
? ? ? ? self.populate_themebox() ? ? #初始化顯示顏色組合框
? ? ? ? self.populate_animationbox() #初始化動畫選項組合框
? ? ? ? self.populate_legendbox() ? ?#初始化圖標位置組合框
? ? ? ?
? ? ? ? # 面積區域圖表顯示視圖
? ? ? ? chart_view = QChartView(self.create_areachart())
? ? ? ? self.ui.gridLayout.addWidget(chart_view, 1, 0) ? #繼續完成UI設計器中沒有完成的界面初始化工作:網格布局依次加入6個view
? ? ? ? self.charts.append(chart_view)
?
? ? ? ? #餅狀圖顯示視圖
? ? ? ? chart_view = QChartView(self.create_pie_chart())
? ? ? ? chart_view.setSizePolicy(QSizePolicy.Ignored, QSizePolicy.Ignored)
? ? ? ? self.ui.gridLayout.addWidget(chart_view, 1, 1)
? ? ? ? self.charts.append(chart_view)
?
? ? ? ? #折線圖顯示視圖
? ? ? ? chart_view = QChartView(self.create_line_chart())
? ? ? ? self.ui.gridLayout.addWidget(chart_view, 1, 2)
? ? ? ? self.charts.append(chart_view)
?
? ? ? ? #直方圖顯示視圖
? ? ? ? chart_view = QChartView(self.create_bar_chart())
? ? ? ? self.ui.gridLayout.addWidget(chart_view, 2, 0)
? ? ? ? self.charts.append(chart_view)
?
? ? ? ? #樣條直線圖顯示視圖
? ? ? ? chart_view = QChartView(self.create_spline_chart())
? ? ? ? self.ui.gridLayout.addWidget(chart_view, 2, 1)
? ? ? ? self.charts.append(chart_view)
?
? ? ? ? #離散點圖顯示視圖
? ? ? ? chart_view = QChartView(self.create_scatterchart())
? ? ? ? self.ui.gridLayout.addWidget(chart_view, 2, 2)
? ? ? ? self.charts.append(chart_view)
?
? ? ? ? #設置默認支持抗鋸齒
? ? ? ? self.ui.antialiasCheckBox.setChecked(True)
?
? ? ? ? #設置默認顯示顏色
? ? ? ? pal = qApp.palette()
? ? ? ? pal.setColor(QPalette.Window, QColor(0xf0f0f0))
? ? ? ? pal.setColor(QPalette.WindowText, QColor(0x404044))
? ? ? ? qApp.setPalette(pal)
?
? ? ? ? self.update_ui() ? #刷新一次顯示
? ?
? ? #初始化顏色類型選項組合框
? ? def populate_themebox(self):
? ? ? ? theme = self.ui.themeComboBox
? ? ? ? theme.addItem("亮白", QChart.ChartThemeLight)
? ? ? ? theme.addItem("天藍色", QChart.ChartThemeBlueCerulean)
? ? ? ? theme.addItem("暗色調", QChart.ChartThemeDark)
? ? ? ? theme.addItem("棕沙色", QChart.ChartThemeBrownSand)
? ? ? ? theme.addItem("藍NCS", QChart.ChartThemeBlueNcs)
? ? ? ? theme.addItem("高對比", QChart.ChartThemeHighContrast)
? ? ? ? theme.addItem("藍Icy", QChart.ChartThemeBlueIcy)
? ? ? ? theme.addItem("Qt", QChart.ChartThemeQt)
? ? #初始化動畫類型選項組合框
? ? def populate_animationbox(self):
? ? ? ? animated = self.ui.animatedComboBox
? ? ? ? animated.addItem("無動畫", QChart.NoAnimation)
? ? ? ? animated.addItem("沿網格軸動畫", QChart.GridAxisAnimations)
? ? ? ? animated.addItem("連續動畫", QChart.SeriesAnimations)
? ? ? ? animated.addItem("所有動畫", QChart.AllAnimations)
? ? #初始化圖例顯示位置選項組合框
? ? def populate_legendbox(self):
? ? ? ? legend = self.ui.legendComboBox
? ? ? ? legend.addItem("無圖例", 0)
? ? ? ? legend.addItem("圖例在上", Qt.AlignTop)
? ? ? ? legend.addItem("圖例在下", Qt.AlignBottom)
? ? ? ? legend.addItem("圖例在左", Qt.AlignLeft)
? ? ? ? legend.addItem("圖例在右", Qt.AlignRight)
?
? ? #1.創建面積區域類型圖表
? ? def create_areachart(self):
? ? ? ? chart = QChart()
? ? ? ? chart.setTitle("面積區域圖")
? ? ? ? #下面定義面積區域的三條線上的點坐標示例數據
? ? ? ? lstDatas1=[[0.0,1.1],[2.0,1.5],[3.0,1.8],[4.0,2.1],[5.0,2.6],[6.0,2.9]]
? ? ? ? lstDatas2=[[0.0,3.1],[2.0,3.5],[3.0,3.5],[4.0,4.1],[5.0,4.6],[6.0,4.9]]
? ? ? ? lstDatas3=[[0.0,6.1],[2.0,6.5],[3.0,6.8],[4.0,8.5],[5.0,8.9],[6.0,9.3]]
? ? ? ? lstDatas=[]
? ? ? ? lstDatas.append(lstDatas1)
? ? ? ? lstDatas.append(lstDatas2)
? ? ? ? lstDatas.append(lstDatas3)
? ? ? ? count=len(lstDatas1)
? ? ? ? #底層線位置
? ? ? ? lower_series = None
? ? ? ? name = "A" ? ?#設置圖標名前綴
? ? ? ? id=0
? ? ? ? for oneDatas in lstDatas:
? ? ? ? ? ? upper_series = QLineSeries(chart) ? ? ? ?#上層線位置
? ? ? ? ? ? for onePoint in oneDatas:
? ? ? ? ? ? ? ? x=onePoint[0]
? ? ? ? ? ? ? ? y=onePoint[1]
? ? ? ? ? ? ? ? upper_series.append(QPointF(x,y))
? ? ? ? ? ? id+=1
? ? ? ? ? ? area = QAreaSeries(upper_series, lower_series) ?
? ? ? ? ? ? area.setName(f"{name}{id}")
? ? ? ? ? ? chart.addSeries(area)
? ? ? ? ? ? lower_series = upper_series ? ? ? ? ? ? ? ? ? ? ? ? ? #下一個區的的上層線變成下一個區域的底層線
? ? ? ?
? ? ? ? chart.createDefaultAxes()
? ? ? ? axis_x = chart.axes(Qt.Orientation.Horizontal)[0]
? ? ? ? axis_x.setRange(0, count-1) ? ?#設置X軸標區間
? ? ? ? axis_y = chart.axes(Qt.Vertical)[0]
? ? ? ? axis_y.setRange(0,10) ? ? ? ? ?#設置X軸標區間
?
? ? ? ? #增加軸標在軸線外側
? ? ? ? axis_y.setLabelFormat("%.1f ?")
?
? ? ? ? return chart
? ?
? ? #2.創建餅狀圖圖表
? ? def create_pie_chart(self):
? ? ? ? chart = QChart()
? ? ? ? chart.setTitle("餅狀圖")
? ? ? ? series = QPieSeries(chart)
? ? ? ? #下面餅狀圖中各區域的示例值
? ? ? ? lstDatas=[1.0,2.0,3.0,4.0,5.0,6.0,7.0]
? ? ? ? count=len(lstDatas)
? ? ? ? id=0
? ? ? ? for oneBarValue in ?lstDatas:
? ? ? ? ? ? barStr=f'餅:{id+1}'
? ? ? ? ? ? slc=series.append(barStr,oneBarValue)
? ? ? ? ? ? if(id==4): ? #如當前為id=4號的餅數據時,將此餅狀區域(序號4+1)單獨提出來分離開顯示
? ? ? ? ? ? ? ? slc.setLabelVisible()
? ? ? ? ? ? ? ? slc.setExploded()
? ? ? ? ? ? ? ? slc.setExplodeDistanceFactor(0.5)
? ? ? ? ? ? id+=1
?
? ? ? ? series.setPieSize(0.5) ? ?#設置餅顯示尺寸相對視中的占比
? ? ? ? chart.addSeries(series)
?
? ? ? ? return chart
? ?
? ? ?#3.創建折線圖圖表
? ? def create_line_chart(self):
? ? ? ? chart = QChart()
? ? ? ? chart.setTitle("線性圖")
? ? ? ? #下面定義三組每條折線上的點坐標示例數據
? ? ? ? lstDatas1=[[0.0,1.1],[2.0,1.5],[3.0,1.8],[4.0,2.1],[5.0,2.6],[6.0,2.9]]
? ? ? ? lstDatas2=[[0.0,3.1],[2.0,3.5],[3.0,3.5],[4.0,4.1],[5.0,4.6],[8.0,4.9]]
? ? ? ? lstDatas3=[[0.0,6.1],[2.0,6.5],[3.0,6.8],[4.0,8.5],[5.0,8.9],[10.0,9.3]]
? ? ? ? lstDatas=[]
? ? ? ? lstDatas.append(lstDatas1)
? ? ? ? lstDatas.append(lstDatas2)
? ? ? ? lstDatas.append(lstDatas3)
? ? ? ? name = "C" ? #設置圖標名前綴
?
? ? ? ? id=0
? ? ? ? for oneDatas in lstDatas:
? ? ? ? ? ? series = QLineSeries(chart)
? ? ? ? ? ? for onePoint in oneDatas:
? ? ? ? ? ? ? ? series.append(QPointF(onePoint[0],onePoint[1])) ? ? ? ? ? ?#得到數據中的點值要轉換為QPointF
? ? ? ? ? ? series.setName(f"{name}{id}") ? ? ? ? ? ? ? ? ? ? ? ? ? ? ? ? ?#為每條線(共3條)設置圖標名稱
? ? ? ? ? ? chart.addSeries(series)
? ? ? ? ? ? id+=1
?
? ? ? ? chart.createDefaultAxes()
? ? ? ? axis_x = chart.axes(Qt.Orientation.Horizontal)[0]
? ? ? ? axis_x.setRange(0, 10) ? ? ? ? ? ? ? ? #設置X軸標區間
? ? ? ? axis_y = chart.axes(Qt.Vertical)[0]
? ? ? ? axis_y.setRange(0, 10) ? ? ? ? ? ? ? ? #設置y軸標區間
? ? ? ? #增加軸標在軸線外側
? ? ? ? axis_y.setLabelFormat("%.1f ?")
?
? ? ? ? return chart
? ?
? ? #4.創建直方圖類型圖表
? ? def create_bar_chart(self):
? ? ? ? chart = QChart()
? ? ? ? chart.setTitle("直方圖")
? ? ? ? #下面定義三組數據在每個矩形上的高度示例數據
? ? ? ? lstDatas1=[1.0,2.0,3.0,4.0,5.0,6.0,7.0]
? ? ? ? lstDatas2=[1.0,3.0,5.0,7.0,2.0,4.0,6.0]
? ? ? ? lstDatas3=[7.0,6.0,5.0,4.0,3.0,3.0,1.0]
? ? ? ? lstDatas=[]
? ? ? ? lstDatas.append(lstDatas1)
? ? ? ? lstDatas.append(lstDatas2)
? ? ? ? lstDatas.append(lstDatas3)
?
? ? ? ? series = QStackedBarSeries(chart)
? ? ? ? id=0
? ? ? ? for oneDatas in lstDatas: ? ? ? ? ? ? ? ? ? #得到3組數據中的每一組數據
? ? ? ? ? ? barset = QBarSet(f"D{id}") ? ? ? ? ? ? ?#為每組數據設置對象及對應圖標名
? ? ? ? ? ? for oneRectY in oneDatas: ? ? ? ? ? ? ? #得到每組數據中的Y值
? ? ? ? ? ? ? ? barset.append(oneRectY)
? ? ? ? ? ? series.append(barset) ? ? ? ? ? ? ? ? ? #共創建7項直方圖(X向),每組直方圖有3個矩形區,如X軸第1列矩形的高分別為:lstDatas1[0],中間為lstDatas2[0],上部矩形為lstDatas3[0]
? ? ? ? ? ? id+=1
? ? ? ? chart.addSeries(series)
? ? ? ? chart.createDefaultAxes()
? ? ? ? axis_y = chart.axes(Qt.Vertical)[0]
? ? ? ? axis_y.setRange(0, 30) ? ? ? ? ? ? ? ? ?#設置Y軸網格最大高度,不用此句時,為三組數據最大值合
? ? ? ? axis_y.setLabelFormat("%.2f ?") ? ? ? ? #Y軸標顯示格式
? ? ? ? return chart
? ?
? ? #5.創建樣條曲線類型圖表
? ? def create_spline_chart(self):
? ? ? ? chart = QChart()
? ? ? ? chart.setTitle("樣條曲線圖")
? ? ? ? name = "E" ? ?#設置圖標名前綴
? ? ? ? #下面定義三組每條樣條曲線上的點坐標示例數據
? ? ? ? lstDatas1=[[0.0,1.1],[2.0,1.5],[3.0,1.8],[4.0,2.1],[5.0,2.6],[6.0,2.9]]
? ? ? ? lstDatas2=[[0.0,3.1],[2.0,3.5],[3.0,3.5],[4.0,4.1],[5.0,4.6],[8.0,4.9]]
? ? ? ? lstDatas3=[[0.0,6.1],[2.0,6.5],[3.0,6.8],[4.0,8.5],[5.0,8.9],[10.0,9.3]]
? ? ? ? lstDatas=[]
? ? ? ? lstDatas.append(lstDatas1)
? ? ? ? lstDatas.append(lstDatas2)
? ? ? ? lstDatas.append(lstDatas3)
? ? ? ? id=0
? ? ? ? for oneDatas in lstDatas:
? ? ? ? ? ? series = QSplineSeries(chart)
? ? ? ? ? ? for onePoint in oneDatas:
? ? ? ? ? ? ? ? series.append(QPointF(onePoint[0],onePoint[1])) ? ? ? ? ? ?#得到數據中的點值要轉換為QPointF
? ? ? ? ? ? series.setName(f"{name}{id}") ? ? ? ? ? ? ? ? ? ? ? ? ? ? ? ? ?#為每條線(共3條)設置圖標名稱
? ? ? ? ? ? chart.addSeries(series)
? ? ? ? ? ? id+=1
?
? ? ? ? chart.createDefaultAxes()
? ? ? ? axis_x = chart.axes(Qt.Orientation.Horizontal)[0]
? ? ? ? axis_x.setRange(0,10) ? ? ? ? ? ? ? ? ? ?#設置X軸標區間
? ? ? ? axis_y = chart.axes(Qt.Vertical)[0]
? ? ? ? axis_y.setRange(0, 10) ? ? ? ? ? ? ? ? ? #設置X軸標區間
? ? ? ? axis_y.setLabelFormat("%.1f ?")
? ? ? ? return chart
? ?
? ? #6.創建離散點類型圖表
? ? def create_scatterchart(self):
? ? ? ? chart = QChart()
? ? ? ? chart.setTitle("離散點圖")
? ? ? ? name = "F"
? ? ? ? #下面定義三組離散點坐標示例數據:共21個點
? ? ? ? lstDatas1=[[0.2,1.1],[2.0,1.5],[3.0,1.8],[4.0,2.1],[5.0,2.6],[6.0,2.9]]
? ? ? ? lstDatas2=[[0.4,3.1],[2.0,3.5],[3.0,3.5],[4.0,4.1],[5.0,4.6],[8.0,4.9]]
? ? ? ? lstDatas3=[[0.5,6.1],[2.0,6.5],[3.0,6.8],[4.0,8.5],[5.0,8.9],[9.8,9.3]]
? ? ? ? lstDatas=[]
? ? ? ? lstDatas.append(lstDatas1)
? ? ? ? lstDatas.append(lstDatas2)
? ? ? ? lstDatas.append(lstDatas3)
? ? ? ? id=0
? ? ? ? for oneDatas in lstDatas:
? ? ? ? ? ? series = QScatterSeries(chart)
? ? ? ? ? ? for onePoint in oneDatas:
? ? ? ? ? ? ? ? series.append(QPointF(onePoint[0],onePoint[1])) ? ? ? ? ? ?#得到數據中的點值要轉換為QPointF
? ? ? ? ? ? series.setName(f"{name}{id}") ? ? ? ? ? ? ? ? ? ? ? ? ? ? ? ? ?#為每條線(共3條)設置圖標名稱
? ? ? ? ? ? chart.addSeries(series)
? ? ? ? ? ? id+=1
?
? ? ? ? chart.createDefaultAxes()
? ? ? ? axis_x = chart.axes(Qt.Orientation.Horizontal)[0]
? ? ? ? axis_x.setRange(0,10) ? ? ? ? ?#設置X軸標區間(最大值為數據中的X最大值)
? ? ? ? axis_y = chart.axes(Qt.Vertical)[0]
? ? ? ? axis_y.setRange(0, 10) ? ? ? ? #設置y軸標區間 (最大值為數據中的y最大值)
? ? ? ? axis_y.setLabelFormat("%.1f ?")
?
? ? ? ? return chart
? ?
? ? #按當前的設置選項更新顯示視圖:組合框選項發生變化時均會自動調用此函數,本例無需定義對應的信號槽函數?
? ? def update_ui(self):
? ? ? ? def set_colors(window_color, text_color):
? ? ? ? ? ? pal = self.window().palette()
? ? ? ? ? ? pal.setColor(QPalette.Window, window_color)
? ? ? ? ? ? pal.setColor(QPalette.WindowText, text_color)
? ? ? ? ? ? self.window().setPalette(pal)
?
? ? ? ? idx = self.ui.themeComboBox.currentIndex()
? ? ? ? theme = self.ui.themeComboBox.itemData(idx)
?
? ? ? ? if len(self.charts):
? ? ? ? ? ? chart_theme = self.charts[0].chart().theme()
? ? ? ? ? ? if chart_theme != theme:
? ? ? ? ? ? ? ? for chart_view in self.charts:
? ? ? ? ? ? ? ? ? ? chart_view.chart().setTheme(theme)
?
? ? ? ? ? ? ? ? #根據選擇的類型更新顏色面板
? ? ? ? ? ? ? ? if theme == QChart.ChartThemeLight:
? ? ? ? ? ? ? ? ? ? set_colors(QColor(0xf0f0f0), QColor(0x404044))
? ? ? ? ? ? ? ? elif theme == QChart.ChartThemeDark:
? ? ? ? ? ? ? ? ? ? set_colors(QColor(0x121218), QColor(0xd6d6d6))
? ? ? ? ? ? ? ? elif theme == QChart.ChartThemeBlueCerulean:
? ? ? ? ? ? ? ? ? ? set_colors(QColor(0x40434a), QColor(0xd6d6d6))
? ? ? ? ? ? ? ? elif theme == QChart.ChartThemeBrownSand:
? ? ? ? ? ? ? ? ? ? set_colors(QColor(0x9e8965), QColor(0x404044))
? ? ? ? ? ? ? ? elif theme == QChart.ChartThemeBlueNcs:
? ? ? ? ? ? ? ? ? ? set_colors(QColor(0x018bba), QColor(0x404044))
? ? ? ? ? ? ? ? elif theme == QChart.ChartThemeHighContrast:
? ? ? ? ? ? ? ? ? ? set_colors(QColor(0xffab03), QColor(0x181818))
? ? ? ? ? ? ? ? elif theme == QChart.ChartThemeBlueIcy:
? ? ? ? ? ? ? ? ? ? set_colors(QColor(0xcee7f0), QColor(0x404044))
? ? ? ? ? ? ? ? else:
? ? ? ? ? ? ? ? ? ? set_colors(QColor(0xf0f0f0), QColor(0x404044))
?
? ? ? ? # 更新抗鋸齒顯示
? ? ? ? checked = self.ui.antialiasCheckBox.isChecked()
? ? ? ? for chart in self.charts:
? ? ? ? ? ? chart.setRenderHint(QPainter.RenderHint.Antialiasing, checked)
?
? ? ? ? #更新動畫顯示
? ? ? ? idx = self.ui.animatedComboBox.currentIndex()
? ? ? ? options = self.ui.animatedComboBox.itemData(idx)
?
? ? ? ? if len(self.charts):
? ? ? ? ? ? animation_options = self.charts[0].chart().animationOptions()
? ? ? ? ? ? if animation_options != options:
? ? ? ? ? ? ? ? for chart_view in self.charts:
? ? ? ? ? ? ? ? ? ? chart_view.chart().setAnimationOptions(options)
?
? ? ? ? # 更新圖例顯示位置
? ? ? ? idx = self.ui.legendComboBox.currentIndex()
? ? ? ? alignment = self.ui.legendComboBox.itemData(idx)
?
? ? ? ? if not alignment:
? ? ? ? ? ? for chart_view in self.charts:
? ? ? ? ? ? ? ? chart_view.chart().legend().hide()
? ? ? ? else:
? ? ? ? ? ? for chart_view in self.charts:
? ? ? ? ? ? ? ? alignment_name = Qt.AlignTop
? ? ? ? ? ? ? ? if alignment == 32:
? ? ? ? ? ? ? ? ? ? alignment_name = Qt.AlignTop
? ? ? ? ? ? ? ? elif alignment == 64:
? ? ? ? ? ? ? ? ? ? alignment_name = Qt.AlignBottom
? ? ? ? ? ? ? ? elif alignment == 1:
? ? ? ? ? ? ? ? ? ? alignment_name = Qt.AlignLeft
? ? ? ? ? ? ? ? elif alignment == 2:
? ? ? ? ? ? ? ? ? ? alignment_name = Qt.AlignRight
? ? ? ? ? ? ? ? chart_view.chart().legend().setAlignment(alignment_name)
? ? ? ? ? ? ? ? chart_view.chart().legend().show()
?
#程序入口
if __name__ == "__main__":
? ? app = QApplication(sys.argv)
? ? window = QMainWindow()
? ? widget = ThemeWidget(None)
? ? window.setCentralWidget(widget)
? ? available_geometry = window.screen().availableGeometry()
? ? size = available_geometry.height() * 1.0
? ? window.setFixedSize(size, size *0.85)
? ? window.show()
? ? window.setWindowTitle('PySide6.QtCharts的6種方式顯示圖表')
? ?
? ? sys.exit(app.exec())
下面是UI設計器的界面編繹后的ui_themewidget.py模塊代碼,此代碼文件同上面主模塊文件放在一個目錄即可
# -*- coding: utf-8 -*-################################################################################
## Form generated from reading UI file 'themewidget.ui'
##
## Created by: Qt User Interface Compiler version 6.8.0
##
## WARNING! All changes made in this file will be lost when recompiling UI file!
################################################################################from PySide6.QtCore import (QCoreApplication, QDate, QDateTime, QLocale,QMetaObject, QObject, QPoint, QRect,QSize, QTime, QUrl, Qt)
from PySide6.QtGui import (QBrush, QColor, QConicalGradient, QCursor,QFont, QFontDatabase, QGradient, QIcon,QImage, QKeySequence, QLinearGradient, QPainter,QPalette, QPixmap, QRadialGradient, QTransform)
from PySide6.QtWidgets import (QApplication, QCheckBox, QComboBox, QGridLayout,QHBoxLayout, QLabel, QSizePolicy, QSpacerItem,QWidget)class Ui_ThemeWidgetForm(object):def setupUi(self, ThemeWidgetForm):if not ThemeWidgetForm.objectName():ThemeWidgetForm.setObjectName(u"ThemeWidgetForm")ThemeWidgetForm.setWindowModality(Qt.WindowModality.WindowModal)ThemeWidgetForm.resize(1200, 900)self.gridLayout = QGridLayout(ThemeWidgetForm)self.gridLayout.setObjectName(u"gridLayout")self.horizontalLayout = QHBoxLayout()self.horizontalLayout.setObjectName(u"horizontalLayout")self.themeLabel = QLabel(ThemeWidgetForm)self.themeLabel.setObjectName(u"themeLabel")self.horizontalLayout.addWidget(self.themeLabel)self.themeComboBox = QComboBox(ThemeWidgetForm)self.themeComboBox.setObjectName(u"themeComboBox")self.horizontalLayout.addWidget(self.themeComboBox)self.animatedLabel = QLabel(ThemeWidgetForm)self.animatedLabel.setObjectName(u"animatedLabel")self.horizontalLayout.addWidget(self.animatedLabel)self.animatedComboBox = QComboBox(ThemeWidgetForm)self.animatedComboBox.setObjectName(u"animatedComboBox")self.horizontalLayout.addWidget(self.animatedComboBox)self.legendLabel = QLabel(ThemeWidgetForm)self.legendLabel.setObjectName(u"legendLabel")self.horizontalLayout.addWidget(self.legendLabel)self.legendComboBox = QComboBox(ThemeWidgetForm)self.legendComboBox.setObjectName(u"legendComboBox")self.horizontalLayout.addWidget(self.legendComboBox)self.antialiasCheckBox = QCheckBox(ThemeWidgetForm)self.antialiasCheckBox.setObjectName(u"antialiasCheckBox")self.antialiasCheckBox.setChecked(False)self.horizontalLayout.addWidget(self.antialiasCheckBox)self.horizontalSpacer = QSpacerItem(40, 20, QSizePolicy.Policy.Expanding, QSizePolicy.Policy.Minimum)self.horizontalLayout.addItem(self.horizontalSpacer)self.gridLayout.addLayout(self.horizontalLayout, 0, 0, 1, 3)self.retranslateUi(ThemeWidgetForm)self.themeComboBox.currentIndexChanged.connect(ThemeWidgetForm.update_ui)self.antialiasCheckBox.toggled.connect(ThemeWidgetForm.update_ui)self.legendComboBox.currentIndexChanged.connect(ThemeWidgetForm.update_ui)self.animatedComboBox.currentIndexChanged.connect(ThemeWidgetForm.update_ui)QMetaObject.connectSlotsByName(ThemeWidgetForm)# setupUidef retranslateUi(self, ThemeWidgetForm):self.themeLabel.setText(QCoreApplication.translate("ThemeWidgetForm", u"\u8272\u8c03:", None))self.animatedLabel.setText(QCoreApplication.translate("ThemeWidgetForm", u"\u56fe\u4f8b:", None))self.legendLabel.setText(QCoreApplication.translate("ThemeWidgetForm", u"\u56fe\u4f8b:", None))self.antialiasCheckBox.setText(QCoreApplication.translate("ThemeWidgetForm", u"\u6297\u952f\u9f7f", None))pass# retranslateUi
UI文件“themewidget.ui”腳本如下,復制到一文本文件中另存為themewidget.ui,即可用UI設計器打開此界面文件
<?xml version="1.0" encoding="UTF-8"?>
<ui version="4.0"><class>ThemeWidgetForm</class><widget class="QWidget" name="ThemeWidgetForm"><property name="windowModality"><enum>Qt::WindowModality::WindowModal</enum></property><property name="geometry"><rect><x>0</x><y>0</y><width>1200</width><height>900</height></rect></property><layout class="QGridLayout" name="gridLayout"><item row="0" column="0" colspan="3"><layout class="QHBoxLayout" name="horizontalLayout"><item><widget class="QLabel" name="themeLabel"><property name="text"><string>色調:</string></property></widget></item><item><widget class="QComboBox" name="themeComboBox"/></item><item><widget class="QLabel" name="animatedLabel"><property name="text"><string>圖例:</string></property></widget></item><item><widget class="QComboBox" name="animatedComboBox"/></item><item><widget class="QLabel" name="legendLabel"><property name="text"><string>圖例:</string></property></widget></item><item><widget class="QComboBox" name="legendComboBox"/></item><item><widget class="QCheckBox" name="antialiasCheckBox"><property name="text"><string>抗鋸齒</string></property><property name="checked"><bool>false</bool></property></widget></item><item><spacer name="horizontalSpacer"><property name="orientation"><enum>Qt::Orientation::Horizontal</enum></property><property name="sizeHint" stdset="0"><size><width>40</width><height>20</height></size></property></spacer></item></layout></item></layout></widget><resources/><connections><connection><sender>themeComboBox</sender><signal>currentIndexChanged(int)</signal><receiver>ThemeWidgetForm</receiver><slot>update_ui()</slot><hints><hint type="sourcelabel"><x>20</x><y>20</y></hint><hint type="destinationlabel"><x>20</x><y>20</y></hint></hints></connection><connection><sender>antialiasCheckBox</sender><signal>toggled(bool)</signal><receiver>ThemeWidgetForm</receiver><slot>update_ui()</slot><hints><hint type="sourcelabel"><x>20</x><y>20</y></hint><hint type="destinationlabel"><x>20</x><y>20</y></hint></hints></connection><connection><sender>legendComboBox</sender><signal>currentIndexChanged(int)</signal><receiver>ThemeWidgetForm</receiver><slot>update_ui()</slot><hints><hint type="sourcelabel"><x>20</x><y>20</y></hint><hint type="destinationlabel"><x>20</x><y>20</y></hint></hints></connection><connection><sender>animatedComboBox</sender><signal>currentIndexChanged(int)</signal><receiver>ThemeWidgetForm</receiver><slot>update_ui()</slot><hints><hint type="sourcelabel"><x>20</x><y>20</y></hint><hint type="destinationlabel"><x>20</x><y>20</y></hint></hints></connection></connections><slots><slot>update_ui()</slot></slots>
</ui>
?
?


)
)


)


