去官網下載整個項目:
https://github.com/ecomfe/echarts-for-weixin
 ?
?
拷貝ec-canvs文件夾到小程序里面
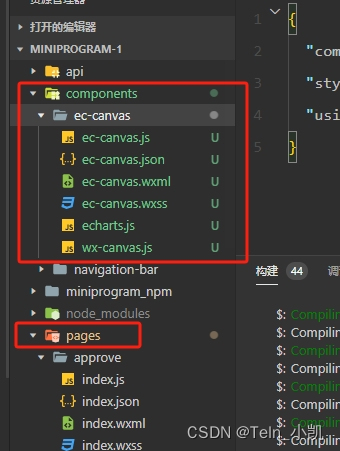
index.js里面的寫法
import * as echarts from "../../components/ec-canvas/echarts"
const app = getApp();
function initChart(canvas, width, height, dpr) {const chart = echarts.init(canvas, null, {width: width,height: height,devicePixelRatio: dpr });canvas.setChart(chart);var option = {backgroundColor: "#ffffff",series: [{label: {normal: {fontSize: 14}},type: 'pie',center: ['50%', '50%'],radius: ['20%', '40%'],data: [{value: 55,name: '北京'}, {value: 20,name: '武漢'}, {value: 10,name: '杭州'}, {value: 20,name: '廣州'}, {value: 38,name: '上海'}]}]};chart.setOption(option);return chart;
}Page({/*** 頁面的初始數據*/data: {ec: {onInit: initChart}}
})
index.json里面的寫法
{"usingComponents": {"ec-canvas":"../../components/ec-canvas/ec-canvas"}
}
頁面的寫法
<view class="chart"><ec-canvas id="mychart-dom-pie" canvas-id="mychart-pie" ec="{{ ec }}"></ec-canvas></view>樣式大小控制
.chart{width: 100%;height: 300px;
}
ec-canvas {width: 100%;height: 100%;}
效果圖
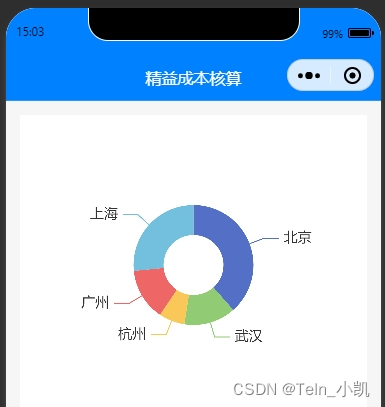
)


)


