[Idx,D] =?knnsearch(___)?additionally returns the matrix?D, using any of the input arguments in the previous syntaxes.?D?contains the distances between each observation in?Y?and the corresponding closest observations in?X.
使用先前語法中的任何輸入參數返回矩陣D。D包含Y中每個觀測值與X中對應的最近觀測值之間的距離。
舉例:
Load Fisher's iris data set.
load fisheriris
X= meas(:,3:4); %Measurements of original flowers
Y= [5 1.45;6 2;2.75 .75]; % New flower data
Perform a?knnsearch?between?X?and the query points?Y?using Minkowski and Chebychev distance metrics.
使用Minkowski和chebychev距離度量在x和查詢點y之間執行?knnsearch。
[mIdx,mD] = knnsearch(X,Y,'K',10,'Distance','minkowski','P',5);
[cIdx,cD] = knnsearch(X,Y,'K',10,'Distance','chebychev');
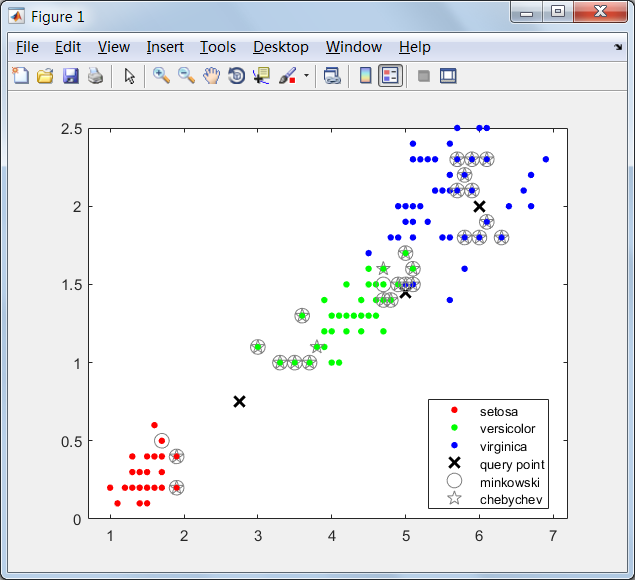
Visualize the results of the two nearest neighbor searches. Plot the training data. Plot the query points with the marker X. Use circles to denote the Minkowski nearest neighbors. Use pentagrams to denote the Chebychev nearest neighbors.
可視化兩個最近鄰搜索的結果。繪制訓練數據。用標記x繪制查詢點。用圓表示Minkowski最近的鄰居。用五角星表示切比雪夫最近的鄰居。
gscatter(X(:,1),X(:,2),species);
line(Y(:,1),Y(:,2),'Marker','x','Color','k',...
'Markersize',10,'Linewidth',2,'Linestyle','none');
line(X(mIdx,1),X(mIdx,2),'Color',[.5 .5 .5],'Marker','o',...
'Linestyle','none','Markersize',10);
line(X(cIdx,1),X(cIdx,2),'Color',[.5 .5 .5],'Marker','p',...
'Linestyle','none','Markersize',10);
legend('setosa','versicolor','virginica','query point',...
'minkowski','chebychev','Location','best');
來源:https://ww2.mathworks.cn/help/stats/knnsearch.html?searchHighlight=knnsearch&s_tid=doc_srchtitle
)

)


)


)

