?1.使用準備
在pro中, 添加QT+= charts
然后在界面頭文件中添加頭文件并聲明命名空間,添加:
#include <QtCharts>
QT_CHARTS_USE_NAMESPACE
?
2.QChart之曲線圖
繪制曲線圖需要用到3個類
- QSplineSeries:? 用于創建有由一系列數據組成的曲線.類似的還有QPieSeries(餅圖數據). QLineSeries(折線數據)
- QChart:? ? 圖表界面,用來管理圖表內容,顏色,大小等
- QChartView:? 負責顯示QChart
效果如下:
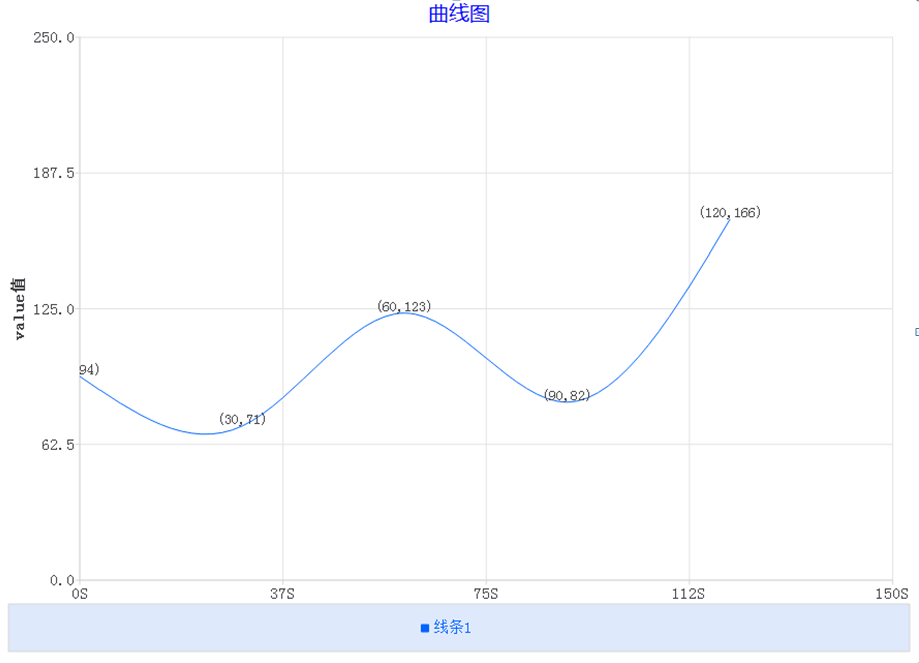
代碼如下所示:
    m_chart = new QChart();QSplineSeries *series1 = new QSplineSeries();//實例化一個QLineSeries對象series1->setColor(QColor(0,100,255));series1->append(QPointF(0,qrand()%200)) ;series1->append(QPointF(30,qrand()%200)) ;series1->append(QPointF(60,qrand()%200)) ;series1->append(QPointF(90,qrand()%200)) ;series1->append(QPointF(120,qrand()%200)) ;series1->setName("線條1");series1->setVisible(true);series1->setPointLabelsFormat("(@xPoint,@yPoint)");series1->setPointLabelsVisible(true);m_chart->setTheme(QChart::ChartThemeLight);//設置白色主題m_chart->setDropShadowEnabled(true);//背景陰影
   m_chart->setAutoFillBackground(true);  //設置背景自動填充
m_chart->addSeries(series1);//添加系列到QChart上
m_chart->setTitleBrush(QBrush(QColor(0,0,255)));//設置標題Brushm_chart->setTitleFont(QFont("微軟雅黑"));//設置標題字體m_chart->setTitle("曲線圖");//創建X軸和Y軸QValueAxis *axisX = new QValueAxis;axisX->setRange(0,150);    //改為setRange(0,1);則表示坐標為動態計算大小的          axisX->setLabelFormat("%dS");QValueAxis *axisY = new QValueAxis;axisY->setRange(0,250);    //改為setRange(0,1);則表示坐標為動態計算大小的            axisY->setTitleText("value值");m_chart->setAxisX(axisX,series1);m_chart->setAxisY(axisY,series1);//m_chart->createDefaultAxes();             //或者創建默認軸//修改說明樣式m_chart->legend()->setVisible(true);m_chart->legend()->setAlignment(Qt::AlignBottom);//底部對齊m_chart->legend()->setBackgroundVisible(true);//設置背景是否可視m_chart->legend()->setAutoFillBackground(true);//設置背景自動填充m_chart->legend()->setColor(QColor(222,233,251));//設置顏色m_chart->legend()->setLabelColor(QColor(0,100,255));//設置標簽顏色m_chart->legend()->setMaximumHeight(50);QChartView *chartView = new QChartView(m_chart);chartView->setRenderHint(QPainter::Antialiasing);QVBoxLayout *pVLayout = new QVBoxLayout(this);pVLayout->addWidget(chartView);resize(960, 720);
3.QChart之餅圖
繪制餅圖需要用到3個類
- QSplineSeries:? ?用于創建有由一系列數據組成的餅圖數據
- QChart:? ? 圖表界面,用來管理圖表內容,顏色,大小等
- QChartView:負責顯示QChart
效果如下:
?
代碼如下:
    m_chart = new QChart();QPieSeries *series = new QPieSeries();series->append("水果:30%",3);     //添加標簽"水果:30%" 和 百分值30%series->append("零食:20%",2);series->append("主食:50%",5);series->setLabelsVisible(true);series->setUseOpenGL(true);series->slices().at(0)->setColor(QColor(13,128,217));   //設置顏色series->slices().at(0)->setLabelColor(QColor(13,128,217));series->slices().at(1)->setColor(QColor(69,13,217));series->slices().at(1)->setLabelColor(QColor(69,13,217));
series->slices().at(2)->setColor(QColor(13,217,152));series->slices().at(2)->setLabelColor(QColor(13,217,152));m_chart->setTheme(QChart::ChartThemeLight);//設置白色主題m_chart->setDropShadowEnabled(true);//背景陰影m_chart->addSeries(series);//添加系列到QChart上
m_chart->setTitleBrush(QBrush(QColor(0,0,255)));//設置標題Brushm_chart->setTitleFont(QFont("微軟雅黑"));//設置標題字體m_chart->setTitle("餅狀圖");//修改說明樣式m_chart->legend()->setVisible(true);m_chart->legend()->setAlignment(Qt::AlignBottom);//底部對齊m_chart->legend()->setBackgroundVisible(true);//設置背景是否可視m_chart->legend()->setAutoFillBackground(true);//設置背景自動填充m_chart->legend()->setColor(QColor(222,233,251));//設置顏色m_chart->legend()->setLabelColor(QColor(0,100,255));//設置標簽顏色m_chart->legend()->setMaximumHeight(50);QChartView *chartView = new QChartView(m_chart);chartView->setRenderHint(QPainter::Antialiasing);QVBoxLayout *pVLayout = new QVBoxLayout(this);pVLayout->addWidget(chartView);resize(960, 720);
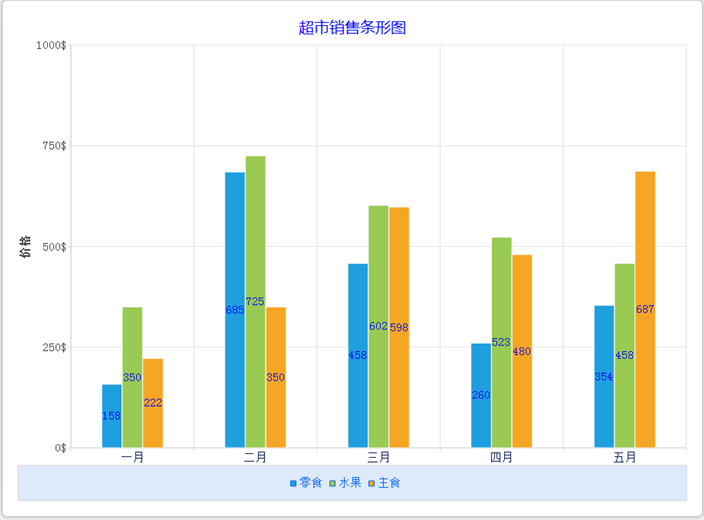
4. QChart之條形圖
繪制條形圖需要用到4個類
- QBarSet: 一個條形集合
- QBarSeries:??用來封裝多個QBarSet的條形數據
- QChart:? ?圖表界面,用來管理圖表內容,顏色,大小等
- QChartView:? 負責顯示QChart
效果如下:
?
代碼如下:
    m_chart = new QChart();//創建3個條線數據QBarSet *set0 = new QBarSet("零食");QBarSet *set1 = new QBarSet("水果");QBarSet *set2 = new QBarSet("主食");*set0 << 158 << 685 << 458 << 260 << 354;    //向零食數據添加這4個月的銷售數據*set1 << 350 << 725 << 602 << 523 << 458;*set2 << 222 << 350 << 598 << 480 << 687;set0->setLabelColor(QColor(0,0,255));       //設置條形數據顏色set1->setLabelColor(QColor(0,0,255));set2->setLabelColor(QColor(0,0,255));QBarSeries *series = new QBarSeries();series->append(set0);series->append(set1);series->append(set2);series->setVisible(true);series->setLabelsVisible(true);m_chart->setTheme(QChart::ChartThemeLight);//設置白色主題m_chart->setDropShadowEnabled(true);//背景陰影m_chart->addSeries(series);//添加系列到QChart上
m_chart->setTitleBrush(QBrush(QColor(0,0,255)));//設置標題Brushm_chart->setTitleFont(QFont("微軟雅黑"));//設置標題字體m_chart->setTitle("超市銷售條形圖");//創建X軸和Y軸QBarCategoryAxis *axisX = new QBarCategoryAxis;axisX->append("一月");axisX->append("二月");axisX->append("三月");axisX->append("四月");axisX->append("五月");axisX->setLabelsColor(QColor(7,28,96));QValueAxis *axisY = new QValueAxis;axisY->setRange(0,1000);   //改為setRange(0,1);則表示坐標為動態計算大小的axisY->setTitleText("價格");axisY->setLabelFormat("%d$");m_chart->setAxisX(axisX,series);m_chart->setAxisY(axisY,series);//修改說明樣式m_chart->legend()->setVisible(true);m_chart->legend()->setAlignment(Qt::AlignBottom);//底部對齊m_chart->legend()->setBackgroundVisible(true);//設置背景是否可視m_chart->legend()->setAutoFillBackground(true);//設置背景自動填充m_chart->legend()->setColor(QColor(222,233,251));//設置顏色m_chart->legend()->setLabelColor(QColor(0,100,255));//設置標簽顏色m_chart->legend()->setMaximumHeight(50);QChartView *chartView = new QChartView(m_chart);chartView->setRenderHint(QPainter::Antialiasing);QVBoxLayout *pVLayout = new QVBoxLayout(this);pVLayout->addWidget(chartView);resize(960, 720);
?


)


