圖像處理傅里葉變換圖像變化
What do Fourier Transforms do? What do the Fourier modes represent? Why are Fourier Transforms notoriously popular for data compression? These are the questions this article aims to address using an interesting analogy to represent images.
傅立葉變換有什么作用? 傅立葉模式代表什么? 為什么眾所周知,傅立葉變換在數據壓縮方面很受歡迎? 這些是本文旨在使用有趣的類比表示圖像來解決的問題。
Images are digital paintings. They are made up of different features. Some features require really precise control of the brush like drawing whiskers on a dog. Others can be quickly filled in with a thick brush, like a clear blue sky. All images are a combination of fine and dull features to varying degrees, i.e. high-frequency and low-frequency features.
圖像是數字繪畫。 它們由不同的功能組成。 一些功能需要真正精確地控制畫筆,例如在狗上繪制胡須。 其他人可以用濃密的刷子快速填充,例如湛藍的天空。 所有圖像在不同程度上都是精細特征和暗淡特征的組合,即高頻和低頻特征。
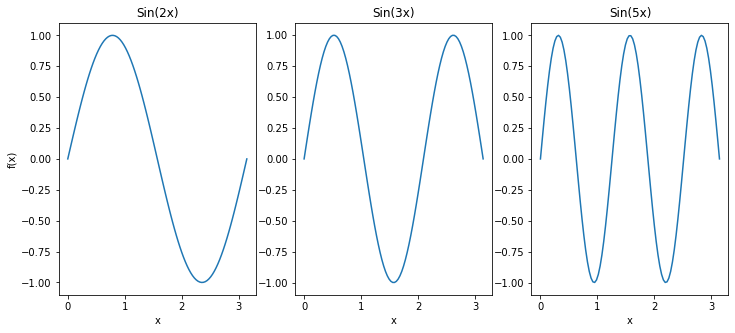
let’s take a moment to understand how frequencies crept up into our analysis. Imagine the sine wave over half a period. It slowly goes up reaches a maximum and then slowly diminishes. The higher the frequency of the sine, the narrower the wave.
讓我們花一點時間來了解頻率是如何爬升到我們的分析中的。 想象一下半個周期的正弦波。 它緩慢上升達到最大值,然后緩慢減小。 正弦頻率越高,波形越窄。
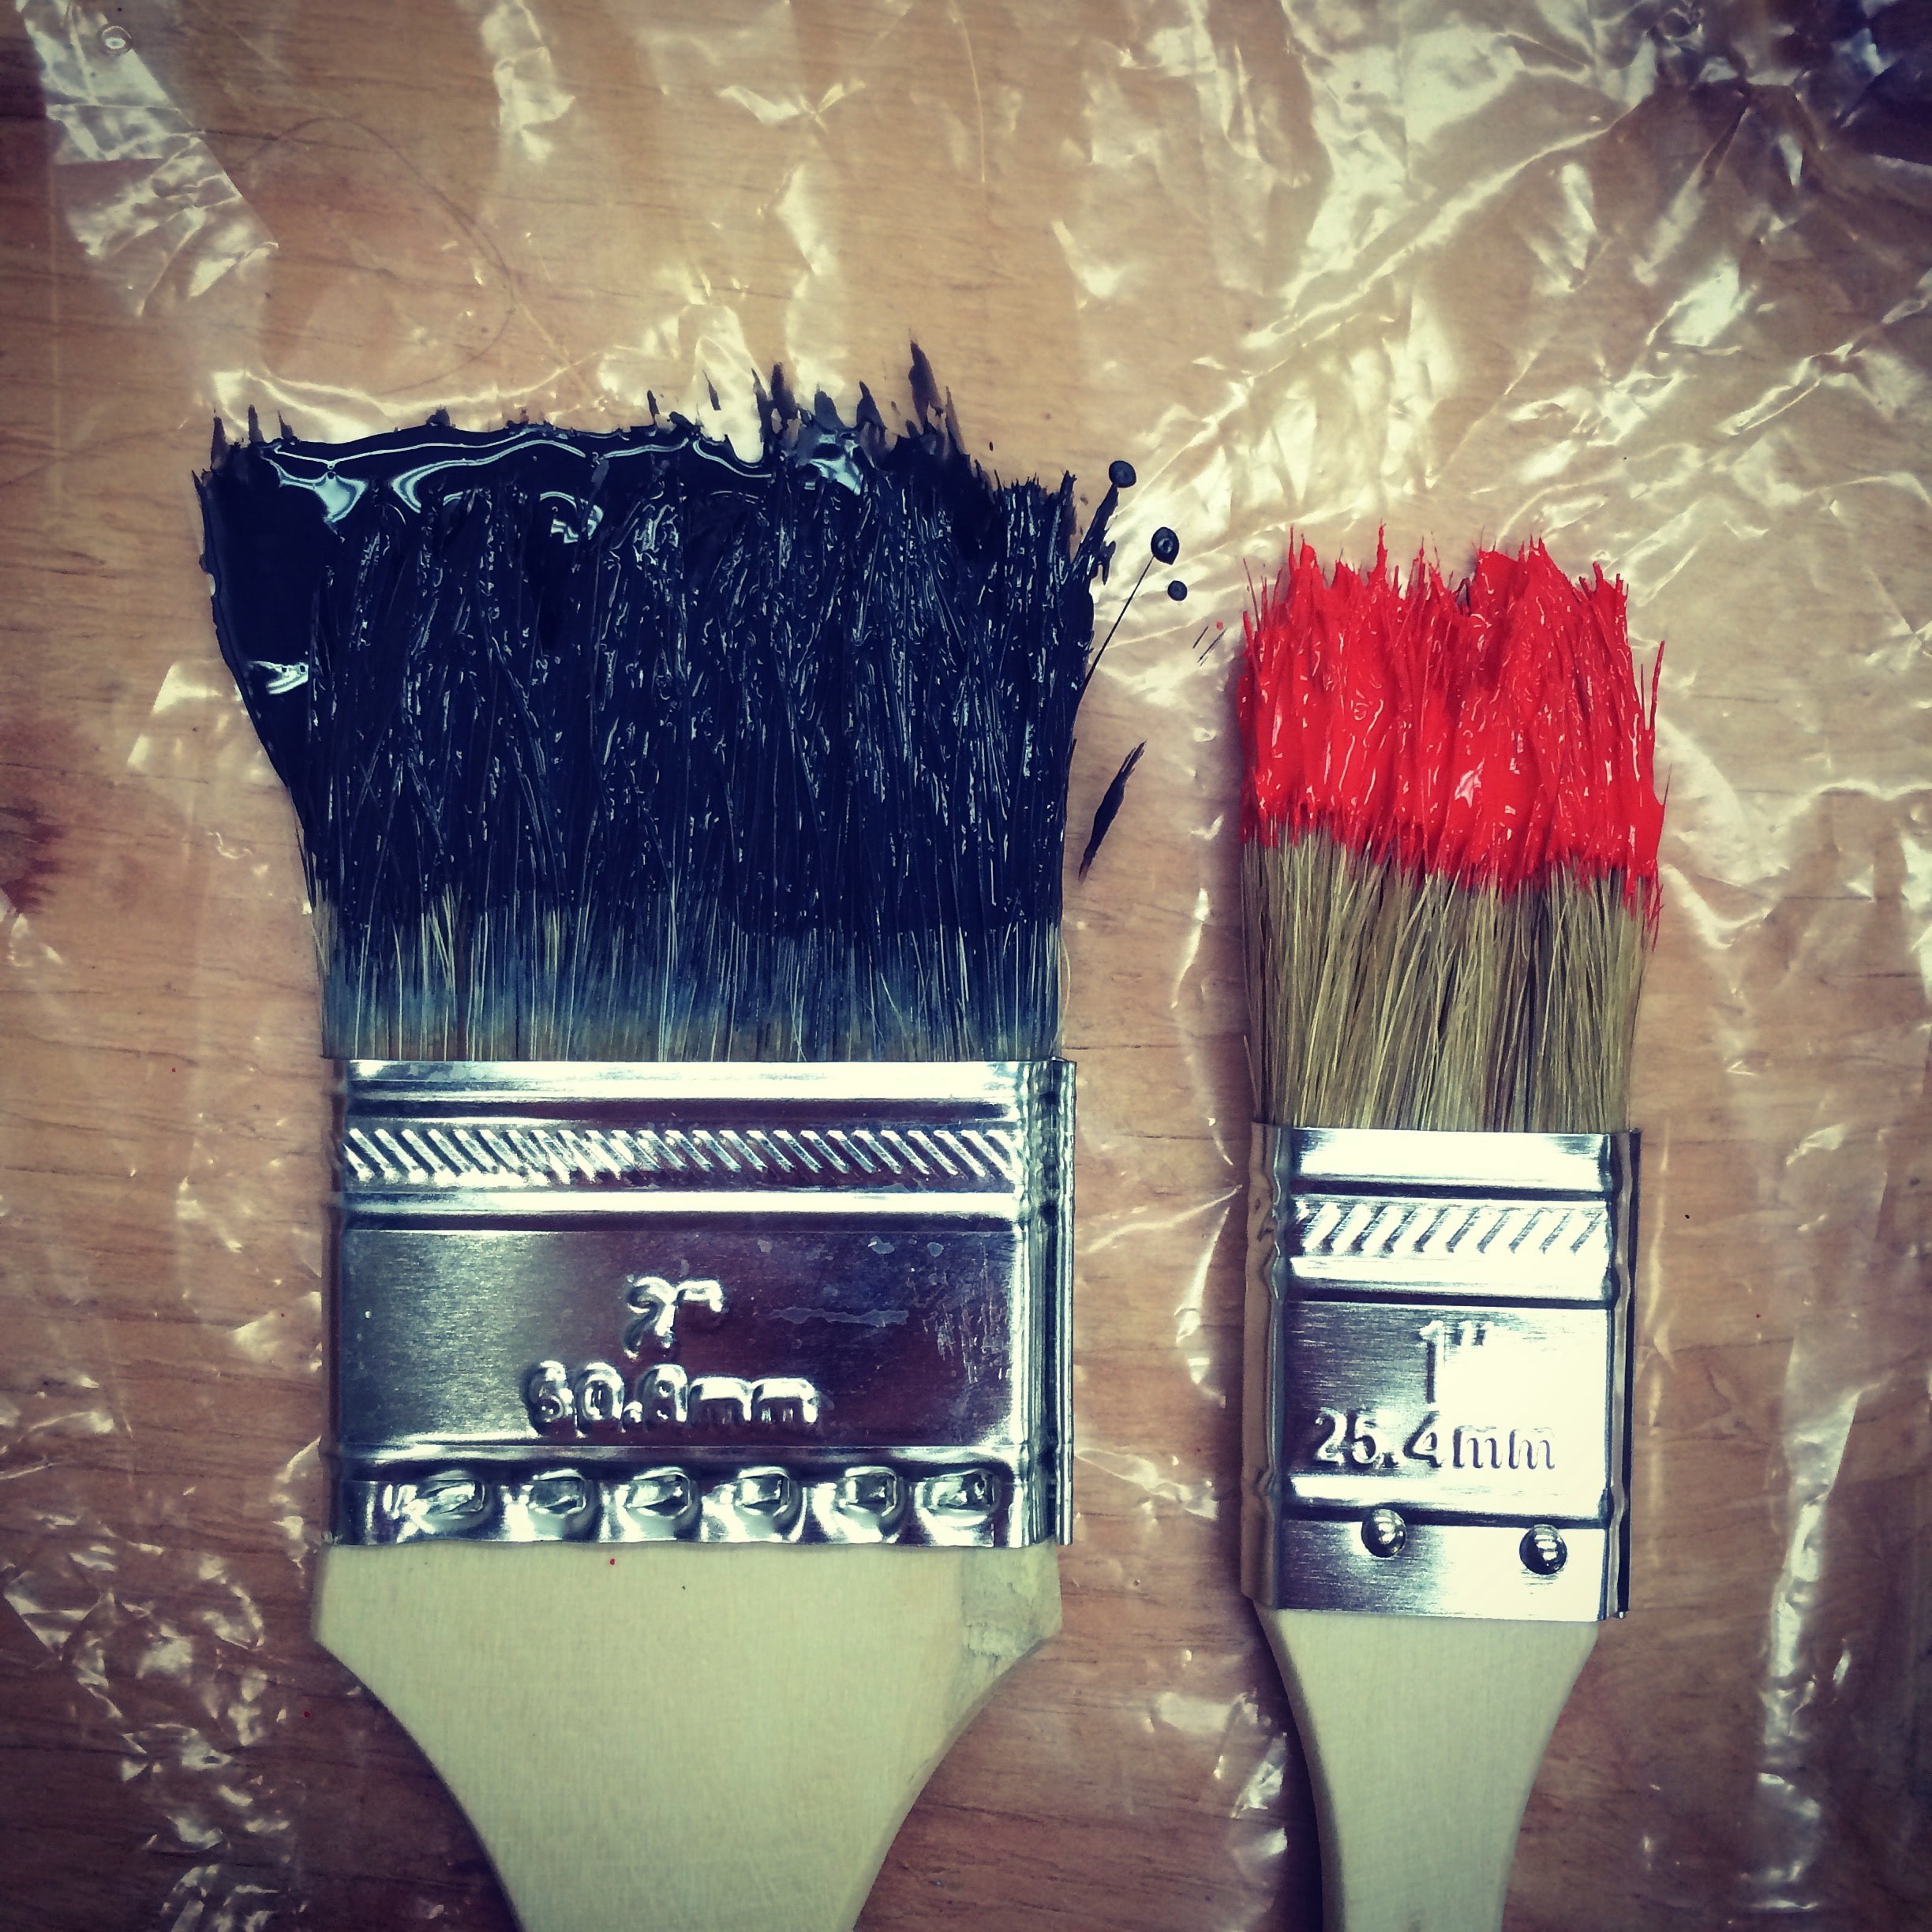
Imagine a cursed painter, who can only paint with brushes whose tips are half-wave sines. If he were to draw a delicately fine feature like the whiskers on a dog, he would choose a brush with a sine which has high frequency i.e. a narrowly pointed brush. Similarly, if he were to paint a clear sky that is devoid of any finer details, he would choose a brush with low frequency i.e. a fat thicker one.
想象一個被詛咒的畫家,他只能用筆尖是半波正弦的畫筆進行繪畫。 如果要在狗身上畫出細微的特征(如胡須),他會選擇頻率較高的正弦畫筆,即窄尖的畫筆。 同樣,如果他要繪制沒有任何精細細節的晴朗天空,則他會選擇頻率較低的畫筆,即較厚的脂肪。
Surprisingly, all the images to ever exist are just like the artwork of the cursed painter. Notably, Fourier showed that every image (signal) can be decomposed into a range of sinuous terms where each term has a magnitude. The magnitudes are called Fourier coefficients. The whole process of decomposing an image into various sine terms and concomitantly their magnitudes is called Fourier decomposition. Fourier series is a much more general scenario, where the signals to be decomposed are periodic. Fourier Transforms are special cases where signals have an infinite time-period, i.e. non-periodic.
令人驚訝的是,所有存在的圖像都像被詛咒的畫家的作品一樣。 值得注意的是,傅立葉(Fourier)表明,每個圖像(信號)都可以分解為一系列正弦項,其中每個項都有一個大小。 幅度稱為傅里葉系數。 將圖像分解為各種正弦項及其幅度的整個過程稱為傅里葉分解。 傅立葉級數是一種更為通用的方案,其中要分解的信號是周期性的。 傅立葉變換是信號具有無限時間周期(即非周期性)的特殊情況。
One elegant and fast algorithm to do the above decomposition is the Fast Fourier Transform, which is arguably the most important algorithm to be developed in the 21st century. It has far-reaching applications in cellular communications, satellites, films, televisions, and much more.
快速傅立葉變換是完成上述分解的一種優雅而快速的算法,它可以說是21世紀最重要的算法。 它在蜂窩通信,衛星,電影,電視等領域具有廣泛的應用。
To visualize the sinuous nature of images, it would be interesting to plot the magnitude of an image as if it were a surface plot and observe the top view of the contours. This idea was developed by Dr. Steven Brunton at the University of Washington.
為了可視化圖像的彎曲性質,將圖像的大小繪制為表面圖并觀察輪廓的俯視圖將很有趣。 這個想法是華盛頓大學的史蒂文·布倫頓博士提出的。
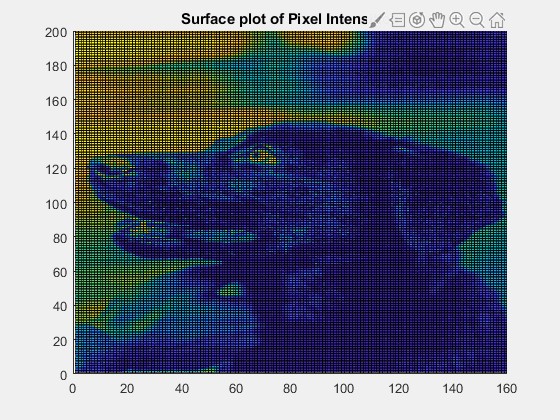
The sinuous nature of the image is clearly visible. the high-frequency features are sharply visible as narrow peaks. These include the eyes, the outlines of the facial structure, and the outline of the human hand. The low-frequency features, which are usually huge stretches of uniform color, are observed in the background. These include large regions of black colored fur and the background.
圖像的彎曲性質清晰可見。 高頻特征清晰可見為窄峰。 這些包括眼睛,面部結構輪廓和人手輪廓。 通常在背景中觀察到低頻特征,通常是巨大的均勻顏色延伸。 其中包括黑色毛皮和背景的大區域。
Here, is the simple code to replicate the prior results.
這是復制先前結果的簡單代碼。
The source code to animate the surface plot is included in my Github, here!
我的Github中包含了動畫曲面圖的源代碼, 在這里 !
This is called as the bed sheet view of the image. The idea behind the name is that if four people were holding each side of a bedsheet and begin oscillating it at one of the Fourier frequency with the corresponding magnitude and a similar setup with four people exists for each of the infinite Fourier modes, then the superposition of all the bedsheets would result physically in creases which look like the above image. Hence, the name, bed sheet view!
這稱為圖像的床單視圖。 該名稱背后的想法是,如果四個人拿著床單的每一側,并開始以相應的幅度以傅立葉頻率之一進行振蕩,并且對于每個無限傅立葉模式都存在四個人的相似設置,則該疊加所有的床單都會在物理上導致皺紋,看起來像上面的圖像。 因此,名稱,床單視圖!
Okay, now that a good intuition is developed to understand what Fourier transforms can do, its a good exercise to go over these ideas formally. The Fourier decomposition equation for a discrete signal looks like:
好的,現在已經發展出一種很好的直覺來理解傅立葉變換可以做什么,這是一個很好的練習,可以正式地研究這些想法。 離散信號的傅立葉分解方程如下:
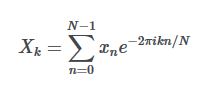
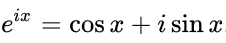
Here, xn is the value of the signal at time n. Xk is the Fourier coefficient for each frequency k. N is the total number of samples of the signal (i.e. the number of discrete time steps over which the signal was recorded). The FFT algorithm returns the Xk values for each frequency. The complex exponential can be decomposed into sines and cosines using the Euler’s formula. This provides a sanity check to the intuitions developed so far.
在此,xn是時間n處的信號值。 Xk是每個頻率k的傅立葉系數。 N是信號采樣的總數(即記錄信號的離散時間步長)。 FFT算法返回每個頻率的Xk值。 可以使用歐拉公式將復指數分解為正弦和余弦。 這為到目前為止開發的直覺提供了健全的檢查。
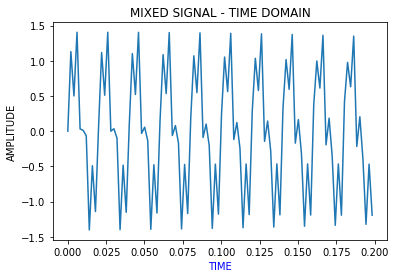
For example, let’s build a sinuous signal out of multiple frequencies. Say a combination of sines with 50, 100, and 200 hertz as frequencies and at different proportions. The periodic nature is still visible, but it is really hard to understand the original frequency components by visualizing the signal in the time domain.
例如,讓我們從多個頻率構建一個正弦信號。 說出頻率分別為50、100和200赫茲的正弦組合。 周期性仍然是可見的,但是通過在時域中可視化信號很難理解原始頻率分量。
The Fourier Transform helps to intuitively visualize the signals in the frequency domain. So, applying the Fourier decomposition on the above signal gives us the following plot.
傅立葉變換有助于直觀地可視化頻域中的信號。 因此,對上述信號進行傅立葉分解可得出以下曲線。
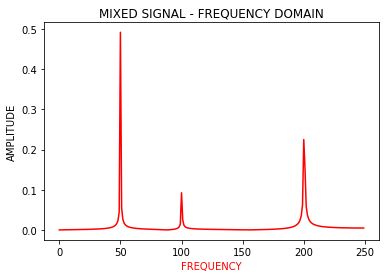
The true frequencies of the mixture at 50, 100, and 200 Hz show peaks in the frequency domain as expected. Notably, the FFT algorithm can also give the weightage of each frequency component, without having any prior knowledge of the signal.
混合物在50、100和200 Hz的真實頻率如預期的那樣在頻域中顯示出峰值。 值得注意的是,FFT算法還可以給出每個頻率分量的權重,而無需事先了解信號。
Now going back to the bedsheet view of images, every picture is a 2-dimensional signal on which the Fourier decomposition can be applied. If a slice of the image is taken, it would resemble the time domain signal from our example, however with its own frequency components. The bedsheet views are powerful to develop intuition behind how an image can be a simple signal in the time domain, with multiple dimensions.
現在回到圖像的床單視圖,每張圖片都是一個二維信號,可以對其進行傅立葉分解。 如果拍攝圖像的一部分,它將類似于我們示例中的時域信號,但是具有自己的頻率分量。 床單視圖功能強大,可以直觀地理解圖像在時域中如何成為具有多個維度的簡單信號。
In general, the information-dense regions are made up of high-frequency terms and plain stretches of uniformity are made up of lower frequency terms. The genius of Fourier is deriving the weighted modes (or frequency — magnitude pair). This gives an idea to understand the most important modes which make up the image. Turns out the Pareto rule holds true here and a really small number of modes contain most of the information about the image. This principle is crucial to data compression. By ignoring the majority of modes, we could reduce the size of the image. However, the quality of the image is only slightly compromised.
通常,信息密集區域由高頻項組成,均勻性的平坦范圍由低頻項組成。 傅立葉的天才在于推導加權模式(或頻率-幅度對)。 這給出了一個了解構成圖像的最重要模式的想法。 事實證明,帕累托規則在這里成立,很少有模式包含有關圖像的大多數信息。 該原理對于數據壓縮至關重要。 通過忽略大多數模式,我們可以減小圖像的大小。 但是,圖像的質量只會略有下降。
If you are interested in going more in-depth on how Fourier Transforms are used for data compression, or to understand why data is compressible, to begin with, check out my previous article. As always, reach out to me to continue the conversation or provide me with some feedback on the content.
如果您想更深入地了解如何使用傅里葉變換進行數據壓縮,或者想了解為什么數據是可壓縮的,那么請閱讀我的上一篇文章 。 與往常一樣,請與我聯系以繼續對話或向我提供有關內容的反饋。
翻譯自: https://towardsdatascience.com/fourier-transforms-and-bed-sheet-view-of-images-58ba34e6808a
圖像處理傅里葉變換圖像變化
本文來自互聯網用戶投稿,該文觀點僅代表作者本人,不代表本站立場。本站僅提供信息存儲空間服務,不擁有所有權,不承擔相關法律責任。 如若轉載,請注明出處:http://www.pswp.cn/news/388587.shtml 繁體地址,請注明出處:http://hk.pswp.cn/news/388587.shtml 英文地址,請注明出處:http://en.pswp.cn/news/388587.shtml
如若內容造成侵權/違法違規/事實不符,請聯系多彩編程網進行投訴反饋email:809451989@qq.com,一經查實,立即刪除!相關文章

HDUOJ 1062 TEXT REVERSE

VC++的windows服務

linux中gradle編譯慢,【Linux】解決linux下android studio用gradle構建從jcenter或maven下載依賴太慢...

MFC程序需要的函數庫及頭文件--《深入淺出MFC》
)
C#DNS域名解析工具(DnsLookup)

python.day05

滯后分析rstudio_使用RStudio進行A / B測試分析

Linux程序實現彈框,jQuery實現彈出框 效果絕對美觀

Interesting visualization tools for profiling.

MySQL的事務-原子性

codeforces CF438D The Child and Sequence 線段樹


linux的磁盤磁頭瓷片作用,Linux 磁盤管理


unity3d 可視化編程_R編程系列:R中的3D可視化

linux無法設置變量,linux – crontab在作業之前無法設置變量
,R(查全率),F1值)
詳談P(查準率),R(查全率),F1值


linux文件系統學習,linux文件系統之tmpfs學習
