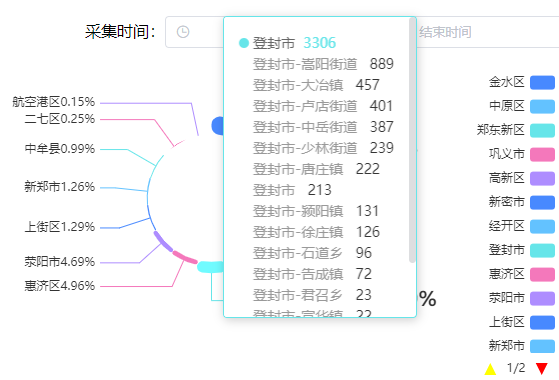

?上圖示例圖表展示相關配置:
var myChart = echarts.init(this.$refs.firstMain);myChart.setOption({legend: { // 圖例設置top: "15%",type: "scroll",orient: "vertical",//圖例列表的布局朝向。left: "right",pageIconColor: 'red', // 激活的分頁按鈕顏色pageIconInactiveColor: 'yellow', // 沒激活的分頁按鈕顏色selectedMode: false,pageIconSize: 12, //當然就是按鈕的大小},title: {text: "縣區采集分布",left: "left",},tooltip: { // 提示框組件設置padding: [15, 15],enterable: true,// 鼠標是否可進入提示框浮層中,默認為false,如需詳情內交互,如添加鏈接,按鈕,可設置為 true。extraCssText: "max-width:60%;max-height:83%; overflow: auto; ",//額外附加到浮層的 css 樣式。show: true,trigger: "item",confine: true, // 是否將 tooltip 框限制在圖表的區域內。// dom: "overflow:hidden",formatter: function (params) {let htmlStr = `<span style="color:${params.color}">${params.data.value}</span>`;//圓點后面顯示的名稱'let res = params.marker +params.data.name +" " + htmlStr +"<br/>";for (var i = 0; i < params.data.list.length; i++) {let obj = params.data.list[i];res += `<div style="color:#999;text-indent:1em">${obj.label} <span style="color:#333333">${obj.total}</span></div>`;}return `${res}`; //最后返回拼接好的值},},grid: {left: "3%",top: "20%",right: "2%",bottom: "3%",containLabel: true,},dataset: {// 提供一份數據。dimensions: ["name", "value"],source: res.data.data,},graphic: { // 數據為空時展示為空提示type: "text", // 類型:文本left: "center",top: "middle",silent: true, // 不響應事件invisible: res.data.data.length > 0, // 有數據就隱藏style: {x: 0,y: 0,fill: "#9d9d9d",fontWeight: "bold",text: "暫無數據",fontFamily: "Microsoft YaHei",fontSize: "25px",},},series: [{name: this.emptyText,type: "pie",radius: ["35%", "45%"],roseType: "area",color: ["#4889FF", "#63C2FF", "#66E5E9", "#F478BB", "#AE8DFF"],itemStyle: {borderRadius: 8,},// 高亮樣式emphasis: {label: {show: true,fontSize: 20,fontWeight: "bold",},},//label 餅圖圖形上的文本標簽,可用于說明圖形的一些數據信息,比如值,名稱等。label: {position: "outer", //文本標簽的位置。alignTo: "labelLine", //標簽的對齊方式-折現的長短bleedMargin: 5,show: true,formatter: "{@name}" + "{d}%",},},],});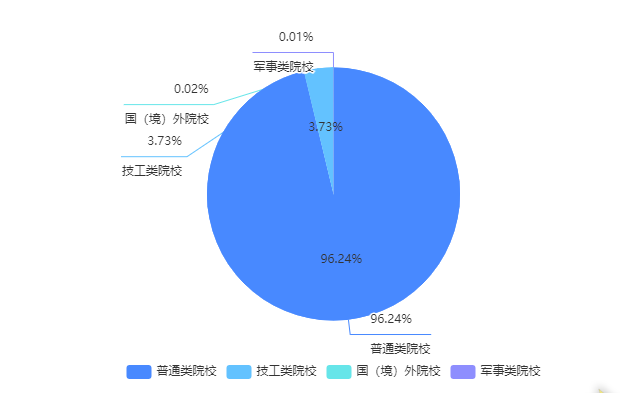

?上述示例圖表展示相關配置:
一般來說,餅圖數據要么內部展示要么外部展示,上面這個餅圖表,外部有折現展示,內部有百分比展示,這里series配置兩個數據對象才能達到這樣的效果,詳見配置
var myChart = echarts.init(this.$refs.fiveMain);myChart.setOption({legend: {bottom: 40,selectedMode: false,show: res.data.data.length > 0,},// 高亮樣式emphasis: {label: {show: true,fontSize: 20,fontWeight: "bold",},},tooltip: {padding: [15, 15],show: true,trigger: "item",formatter: function (params) {let htmlStr = `<span style="color:${params.color}">${params.data.value}</span>`;let res =params.marker +params.data.name +" " +htmlStr +"<br/>";return `${res}`; //最后返回拼接好的值},},label: {alignTo: "labelLine",formatter: function (data) {return `${data.percent}%\n\n${data.name}`;},minMargin: 5,edgeDistance: 10,lineHeight: 15,},dataset: {// 提供一份數據。dimensions: ["name", "value"],source: res.data.data,},series: [{name: "暫無數據",type: "pie",radius: "55%",color: ["#4889FF", "#63C2FF", "#66E5E9", "#8E8EFE"],// avoidLabelOverlap: false, //設置為true時,當數值為0時不重疊// roseType: "area",labelLayout: function (params) { //折現長短的效果const isLeft = params.labelRect.x < myChart.getWidth() / 2;const points = params.labelLinePoints;// Update the end point.points[2][0] = isLeft? params.labelRect.x: params.labelRect.x + params.labelRect.width;return {labelLinePoints: points,};},},{name: "暫無數據",type: "pie",radius: "55%",// avoidLabelOverlap: false, //設置為true時,當數值為0時不重疊center: ["50%", "50%"],// 高亮樣式emphasis: {label: {show: true,fontSize: 20,fontWeight: "bold",},},// roseType: "radius",color: ["#4889FF", "#63C2FF", "#66E5E9", "#F478BB", "#AE8DFF"],//label 餅圖圖形上的文本標簽,可用于說明圖形的一些數據信息,比如值,名稱等。label: {show: true,position: "inside",formatter: `{d}%`,// formatter: '{b}: {c} ({d}%)',},},],graphic: {type: "text", // 類型:文本left: "center",top: "middle",silent: true, // 不響應事件z: 5,invisible: res.data.data.length > 0, // 有數據就隱藏style: {x: 0,y: 0,fill: "#2d2c2c",fontWeight: "bold",text: "暫無數據",fontFamily: "Microsoft YaHei",fontSize: "25px",},},}); ?上述示例圖表展示相關配置:
var myChart = echarts.init(this.$refs.threeMain);myChart.setOption({title: {text: "采集時間分布",},grid: {left: "3%",top: "25%",right: "2%",bottom: "2%",containLabel: true,},legend: {top: "10%",selectedMode: false,},tooltip: {trigger: "axis",confine: true, // 是否將 tooltip 框限制在圖表的區域內。padding: [15, 15],enterable: true, // 鼠標是否可進入提示框浮層中,默認為false,如需詳情內交互,如添加鏈接,按鈕,可設置為 true。extraCssText: "max-width:60%;max-height:83%; overflow: auto; ", //額外附加到浮層的 css 樣式。},xAxis: {show: true,type: "category",data: res.data.data.abscissa,// boundaryGap: false,axisLabel: {interval: 0,rotate: 25,},splitLine: {//網格線show: true,},axisTick: {show: false, // 不顯示坐標軸刻度線},},yAxis: {show: true,type: "value",splitLine: {//網格線show: false,},// 坐標 軸線axisLine: {show: true,},},graphic: {type: "text", // 類型:文本left: "center",top: "middle",silent: true, // 不響應事件invisible: res.data.data.abscissa.length > 0, // 有數據就隱藏style: {x: 0,y: 0,fill: "#9d9d9d",fontWeight: "bold",text: "暫無數據",fontFamily: "Microsoft YaHei",fontSize: "25px",},},series: res.data.data.series,});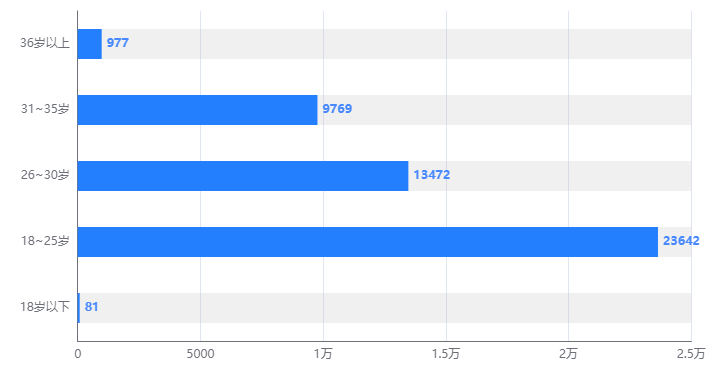
??上述示例圖表展示相關配置:
var myChart = echarts.init(this.$refs.fourMain);myChart.setOption({// title: {// text: "年齡分布",// },tooltip: {show: true,trigger: "axis",axisPointer: { type: "shadow" },shadowstyle: {color: "#65A3FF",opacity: 0.2,width: "auto",},},xAxis: {type: "value",axisLine: {show: true, //不顯示坐標軸線},axisTick: {show: false, // 不顯示坐標軸刻度線},axisLabel: {formatter: function (value, index) {if (value == 0 || (value > 0 && value < 10000)) {return value + "";} else {return value / 10000 + "萬";}},},},yAxis: {type: "category",// name: "單位(人)",data: res.data.data.ordinate,axisTick: {show: false, // 不顯示坐標軸刻度線},},series: [{color: "#247FFF", // 柱狀條顏色barWidth: 30, //柱子寬度data: res.data.data.abscissa,type: "bar",showBackground: true,//柱狀陰影backgroundStyle: { //柱狀陰影顏色color: "rgba(180, 180, 180, 0.2)",},label: {formatter: "{c}" + "",show: true,position: "right",fontWeight: "bolder",fontSize: "12",color: "#4889ff",},},],graphic: {type: "text", // 類型:文本left: "center",top: "middle",silent: true, // 不響應事件invisible: res.data.data.abscissa.length > 0, // 有數據就隱藏style: {x: 0,y: 0,fill: "#9d9d9d",fontWeight: "bold",text: "暫無數據",fontFamily: "Microsoft YaHei",fontSize: "25px",},},});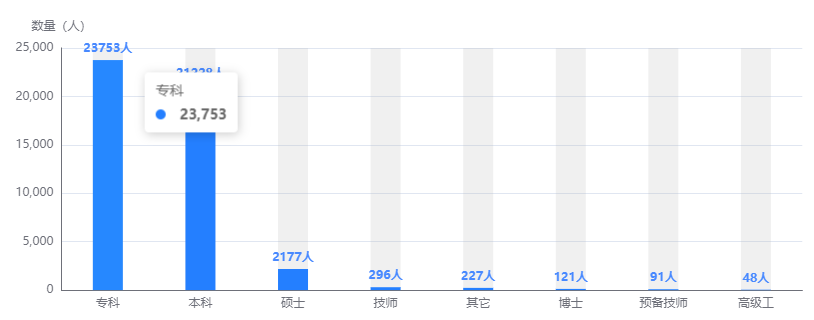
???上述示例圖表展示相關配置:
var myChart = echarts.init(this.$refs.twoMain);myChart.setOption({title: {show: true,text: "學歷分布",left: "left",top: "top",},grid: {left: "4%",top: "25%",right: "2%",bottom: "3%",containLabel: true,},tooltip: {show: true,trigger: "axis",axisPointer: { type: "shadow" },shadowstyle: {color: "#65A3FF",opacity: 0.2,width: "auto",},},xAxis: {type: "category",data: res.data.data.abscissa,axisTick: {show: false, // 不顯示坐標軸刻度線},},yAxis: {show: true,type: "value",name: "數量(人)",// 坐標 軸線axisLine: {show: true,},// 坐標軸刻度線axisTick: {show: false,},//網格線splitLine: {show: true,},},graphic: {type: "text", // 類型:文本left: "center",top: "middle",silent: true, // 不響應事件invisible: res.data.data.ordinate.length > 0, // 有數據就隱藏style: {x: 0,y: 0,fill: "#9d9d9d",fontWeight: "bold",text: "暫無數據",fontFamily: "Microsoft YaHei",fontSize: "25px",},},series: [{data: res.data.data.ordinate,color: "#247FFF", // 柱狀條顏色barWidth: 30, //柱子寬度type: "bar",showBackground: true,backgroundStyle: {color: "rgba(180, 180, 180, 0.2)",},label: {formatter: "{@num}" + "人",show: true,position: "top",fontWeight: "bolder",fontSize: "12",color: "#4889ff",},},],});


-UI Styler中選擇組件或者實體后設置為工作組件)


)


)


