一:什么是時間旅行
簡而言之就是把程序的執行流拍成vlog,這樣就可以對 vlog 快進或者倒退,還可以分享給別人做進一步的分析,是不是想都不敢想。
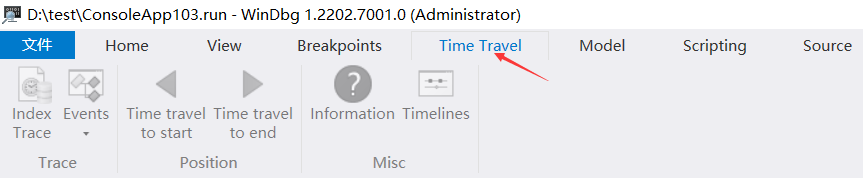
很開心的是 windbg preview 版本中已經實現了,叫做 時間旅行調試 TTD,相比傳統的 靜態分析 不知道好多少倍。
為了能提起大家興趣,我就舉二個例子吧。
二:二個有趣的例子
1. 查看程序都觸發了第幾代垃圾回收
為了方便說明,我就用誘導GC手工觸發,然后再觀察都觸發了哪一代的 GC ,參考代碼如下:
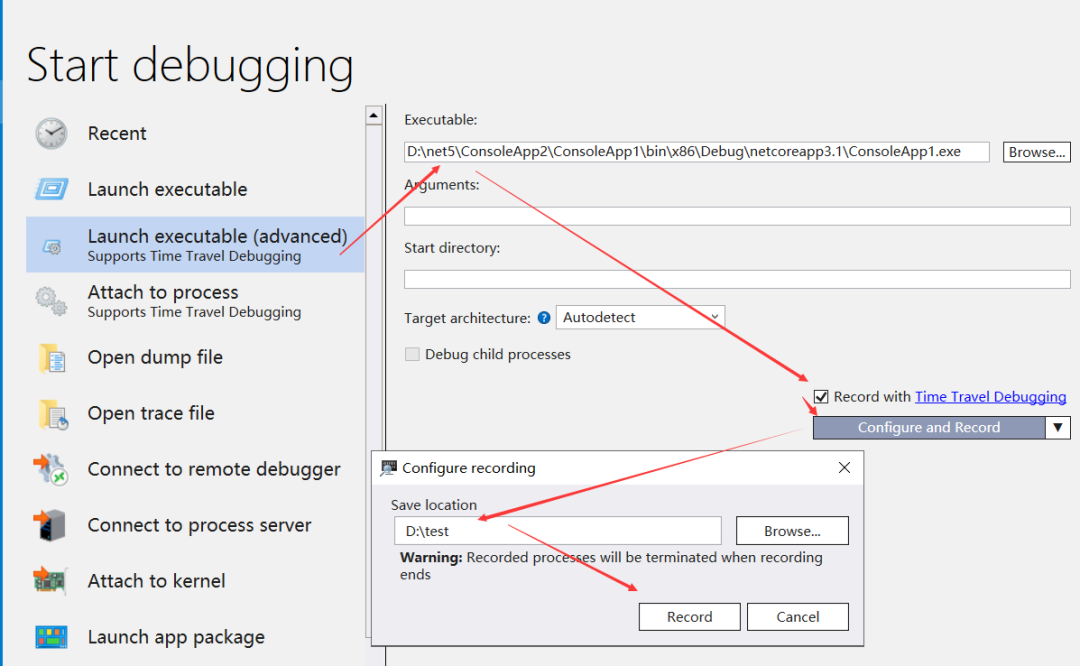
static?void?Main(string[]?args){List<string>?list?=?new?List<string>();//1.?第一次觸發GCGC.Collect();Console.WriteLine("觸發full?gc");//2.?第二次觸發GCGC.Collect(0);Console.WriteLine("觸發?0?代?gc");//3.第二次觸發GCGC.Collect(1);Console.WriteLine("觸發?1?代?gc");}接下來用 windbg 的 launch executeable (advanced) 來附加程序,勾選 Record,然后在彈框中將 vlog 保存到指定目錄,最后點擊 Record 就可以啦!
運行完后,windbg 會自動加載我的 D:\test\ConsoleApp104.run 的 vlog 文件,因為 gc 觸發的底層函數是coreclr!WKS::GCHeap::GarbageCollectGeneration ,所以我們用 bp 給它下一個斷點,運行多次 g 命令。
0:000>?bp?coreclr!WKS::GCHeap::GarbageCollectGeneration
Bp?expression?'coreclr!WKS::GCHeap::GarbageCollectGeneration'?could?not?be?resolved,?adding?deferred?bp
0:000>?g
Time?Travel?Position:?3079F:63E
eax=00000001?ebx=00000002?ecx=00000002?edx=00000008?esi=00000002?edi=00000002
eip=02fc4256?esp=0057f204?ebp=0057f214?iopl=0?????????nv?up?ei?pl?nz?na?po?nc
cs=0023??ss=002b??ds=002b??es=002b??fs=0053??gs=002b?????????????efl=00000202
coreclr!WKS::GCHeap::GarbageCollectGeneration:
02fc4256?55??????????????push????ebp
0:000>?g
Time?Travel?Position:?34661:AF
eax=00000001?ebx=00000002?ecx=00000000?edx=00000008?esi=00000000?edi=00000002
eip=02fc4256?esp=0057f1f8?ebp=0057f208?iopl=0?????????nv?up?ei?pl?nz?na?po?nc
cs=0023??ss=002b??ds=002b??es=002b??fs=0053??gs=002b?????????????efl=00000202
coreclr!WKS::GCHeap::GarbageCollectGeneration:
02fc4256?55??????????????push????ebp
0:000>?g
Breakpoint?0?hit
Time?Travel?Position:?346A5:2CD
eax=00000001?ebx=00000002?ecx=00000001?edx=00000008?esi=00000001?edi=00000002
eip=02fc4256?esp=0057f1f8?ebp=0057f208?iopl=0?????????nv?up?ei?pl?nz?na?po?nc
cs=0023??ss=002b??ds=002b??es=002b??fs=0053??gs=002b?????????????efl=00000202
coreclr!WKS::GCHeap::GarbageCollectGeneration:
02fc4256?55??????????????push????ebp
從輸出中可以很清楚的看到,命中了三次 GarbageCollectGeneration 回收,而且從上面的 ecx 寄存器看依次是 2,0,1,對應著 gc 的2代回收,0代回收, 1代回收, 這比只有一個靜態的 dump 是不是有優勢的多,要知道我這里的 ConsoleApp101.run 文件是可以分發給別人分析的哦。
2. 查看新生成的線程曾今都執行了什么代碼
這個例子源自朋友遇到的一個問題,他的程序跑著跑著,發現 ThreadPool 中有400多待命的工作線程,線程棧大概如下:
0:011>?k#?ChildEBP?RetAddr??????
00?0564fc6c?7531f0ca?????ntdll!NtRemoveIoCompletion+0xc
01?0564fc6c?78480b69?????KERNELBASE!GetQueuedCompletionStatus+0x2a
02?0564fcb8?7847d92b?????coreclr!CLRLifoSemaphore::WaitForSignal+0x29?[d:\a\_work\1\s\src\vm\synch.cpp?@?654]?
03?0564fd08?7847cf04?????coreclr!CLRLifoSemaphore::Wait+0x13b?[d:\a\_work\1\s\src\vm\synch.cpp?@?897]?
04?0564fdd4?783f2910?????coreclr!ThreadpoolMgr::WorkerThreadStart+0x234?[d:\a\_work\1\s\src\vm\win32threadpool.cpp?@?2121]?
05?0564ff70?7703fa29?????coreclr!Thread::intermediateThreadProc+0x50?[d:\a\_work\1\s\src\vm\threads.cpp?@?2110]?
06?0564ff80?772175f4?????KERNEL32!BaseThreadInitThunk+0x19
07?0564ffdc?772175c4?????ntdll!__RtlUserThreadStart+0x2f
08?0564ffec?00000000?????ntdll!_RtlUserThreadStart+0x1b
因為給我的是 靜態dump,所以我無法尋找 11號線程 曾今執行了什么托管代碼,因為時間不能倒流,但現在有了 TTD,真的可以讓時間倒流啦。。。太有意思了,哈哈,既然能倒流,那就一定有辦法找到破綻。
為了方便講解,寫一個簡單例子。
static?void?Main(string[]?args){Task.Factory.StartNew(()?=>{Console.WriteLine("我是?task?線程");});Console.ReadLine();}接下來我們一起探究下最后生成的 Thread WorkThread 曾今都執行了什么?深挖思路大概是這樣的。
先將進度條拉到底,然后用 !bpmd System_Private_CoreLib System.Threading.Tasks.Task.InnerInvoke 下一個斷點,最后將時間倒流,看誰命中了這個 task。
0:000>?g
TTD:?End?of?trace?reached.
(4f20.4d0c):?Break?instruction?exception?-?code?80000003?(first/second?chance?not?available)
Time?Travel?Position:?36F51:0
eax=00070053?ebx=00000000?ecx=8a60f857?edx=77237170?esi=7845e6c0?edi=00000000
eip=771a7000?esp=0602fe90?ebp=0602ff70?iopl=0?????????nv?up?ei?pl?zr?na?pe?nc
cs=0023??ss=002b??ds=002b??es=002b??fs=0053??gs=002b?????????????efl=00000246
771a7000?ea09701a773300??jmp?????0033:771A70090:009>?!bpmd?System_Private_CoreLib?System.Threading.Tasks.Task.InnerInvoke
MethodDesc?=?06A29704
Setting?breakpoint:?bp?05A915C7?[System.Threading.Tasks.Task.InnerInvoke()]
Adding?pending?breakpoints...0:009>?g-
Breakpoint?1?hit
Time?Travel?Position:?32DF4:AC
eax=05a915c0?ebx=00000000?ecx=0349a864?edx=0349a864?esi=0349a864?edi=0349a7c8
eip=05a915c7?esp=066afa14?ebp=066afa1c?iopl=0?????????nv?up?ei?pl?zr?na?pe?nc
cs=0023??ss=002b??ds=002b??es=002b??fs=0053??gs=002b?????????????efl=00000246
System_Private_CoreLib!System.Threading.Tasks.Task.InnerInvoke()$##6002185+0x7:
05a915c7?8b7e04??????????mov?????edi,dword?ptr?[esi+4]?ds:002b:0349a868=0349a8000:008>?!clrstack?
OS?Thread?Id:?0x44a8?(8)
Child?SP???????IP?Call?Site
066AFA14?05a915c7?System.Threading.Tasks.Task.InnerInvoke()?[/_/src/System.Private.CoreLib/shared/System/Threading/Tasks/Task.cs?@?2437]
066AFA24?05a915bb?System.Threading.Tasks.Task+c.<.cctor>b__274_0(System.Object)?[/_/src/System.Private.CoreLib/shared/System/Threading/Tasks/Task.cs?@?2427]
066AFA2C?05a91567?System.Threading.ExecutionContext.RunFromThreadPoolDispatchLoop(System.Threading.Thread,?System.Threading.ExecutionContext,?System.Threading.ContextCallback,?System.Object)?[/_/src/System.Private.CoreLib/shared/System/Threading/ExecutionContext.cs?@?289]
066AFA5C?05a912d1?System.Threading.Tasks.Task.ExecuteWithThreadLocal(System.Threading.Tasks.Task?ByRef,?System.Threading.Thread)?[/_/src/System.Private.CoreLib/shared/System/Threading/Tasks/Task.cs?@?2389]
066AFABC?05a911d7?
066AFACC?05a9118b?System.Threading.Tasks.Task.ExecuteFromThreadPool(System.Threading.Thread)?[/_/src/System.Private.CoreLib/shared/System/Threading/Tasks/Task.cs?@?2312]
066AFAD0?05a90e58?System.Threading.ThreadPoolWorkQueue.Dispatch()?[/_/src/System.Private.CoreLib/shared/System/Threading/ThreadPool.cs?@?663]
066AFB1C?05a90c6f?
066AFD10?784fa0ef?[DebuggerU2MCatchHandlerFrame:?066afd10]
熟悉 Task 的朋友應該知道: System.Threading.Tasks.Task.InnerInvoke 的下一步就是執行我的回調函數,而此時 回調函數?還沒有被 JIT 編譯,這時候我們可以在 bp clrjit!CILJit::compileMethod 中去攔截 JIT 對此方法的編譯,然后從 compileMethod 中提取 mt。
0:008>?bp?clrjit!CILJit::compileMethod
0:008>?g
Breakpoint?1?hit
Time?Travel?Position:?32E36:C18
eax=7933ad50?ebx=066af5c8?ecx=792c8770?edx=066af5c8?esi=7932d164?edi=00cbbf90
eip=792c8770?esp=066af3ec?ebp=066af44c?iopl=0?????????nv?up?ei?pl?zr?na?pe?nc
cs=0023??ss=002b??ds=002b??es=002b??fs=0053??gs=002b?????????????efl=00000246
clrjit!CILJit::compileMethod:
792c8770?55??????????????push????ebp0:008>?kb#?ChildEBP?RetAddr??????Args?to?Child??????????????
00?066af44c?78428db2?????7933ad50?066af5c8?066af4f0?clrjit!CILJit::compileMethod?[d:\a\_work\1\s\src\jit\ee_il_dll.cpp?@?294]?
...0:008>?dp?066af4f0?L1
066af4f0??06a2ae040:008>?!dumpmd?06a2ae04
Method?Name:??????????ConsoleApp1.dll!Unknown
Class:????????????????032fa0dc
MethodTable:??????????06a2ae14
mdToken:??????????????06000005
Module:???????????????02c5d7d0
IsJitted:?????????????no
Current?CodeAddr:?????ffffffff
Version?History:ILCodeVersion:??????00000000ReJIT?ID:???????????0IL?Addr:????????????00000000CodeAddr:???????????00000000??(MinOptJitted)NativeCodeVersion:??00000000
很奇怪的是提取的 md 目前還不能顯示完全名字,不過沒關系,我們繼續 g ,然后再重復執行一下命令。
0:009>?g
TTD:?End?of?trace?reached.
(4f20.4d0c):?Break?instruction?exception?-?code?80000003?(first/second?chance?not?available)
Time?Travel?Position:?36F51:0
eax=00070053?ebx=00000000?ecx=8a60f857?edx=77237170?esi=7845e6c0?edi=00000000
eip=771a7000?esp=0602fe90?ebp=0602ff70?iopl=0?????????nv?up?ei?pl?zr?na?pe?nc
cs=0023??ss=002b??ds=002b??es=002b??fs=0053??gs=002b?????????????efl=00000246
771a7000?ea09701a773300??jmp?????0033:771A7009
0:009>?!dumpmd?06a2ae04
Method?Name:??????????ConsoleApp1.Program+<>c.<Main>b__0_0()
Class:????????????????032fa0dc
MethodTable:??????????06a2ae14
mdToken:??????????????06000005
Module:???????????????02c5d7d0
IsJitted:?????????????yes
Current?CodeAddr:?????06133300
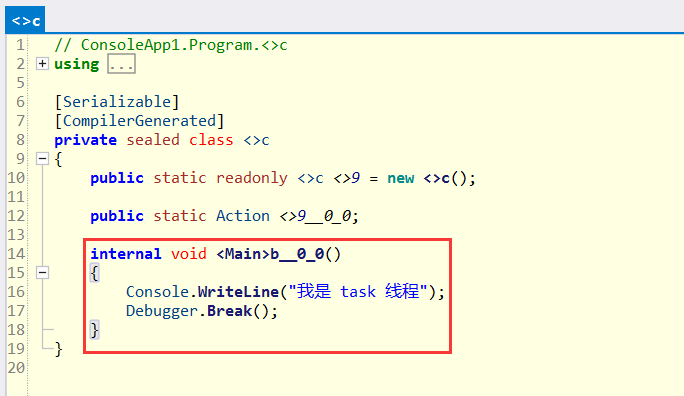
Version?History:ILCodeVersion:??????00000000ReJIT?ID:???????????0IL?Addr:????????????00000000CodeAddr:???????????06133300??(MinOptJitted)NativeCodeVersion:??00000000當時間線結束的時候,我們終于看到了,原來 Task 執行的是 ConsoleApp1.Program+<>c.<Main>b__0_0() 方法,那這個方法邏輯是什么呢?可以用 ILSpy 查看。
總的來說,要復現還是挺考驗基本功的。
中的應用)

![[python opencv 計算機視覺零基礎到實戰] 十、圖片效果毛玻璃](http://pic.xiahunao.cn/[python opencv 計算機視覺零基礎到實戰] 十、圖片效果毛玻璃)

函數_Java - split()函數和trim()函數的使用方法)


![[python opencv 計算機視覺零基礎到實戰] 十一找到圖片中指定內容](http://pic.xiahunao.cn/[python opencv 計算機視覺零基礎到實戰] 十一找到圖片中指定內容)


)
基本概念)
![[python opencv 計算機視覺零基礎到實戰] 十二 直方圖](http://pic.xiahunao.cn/[python opencv 計算機視覺零基礎到實戰] 十二 直方圖)


