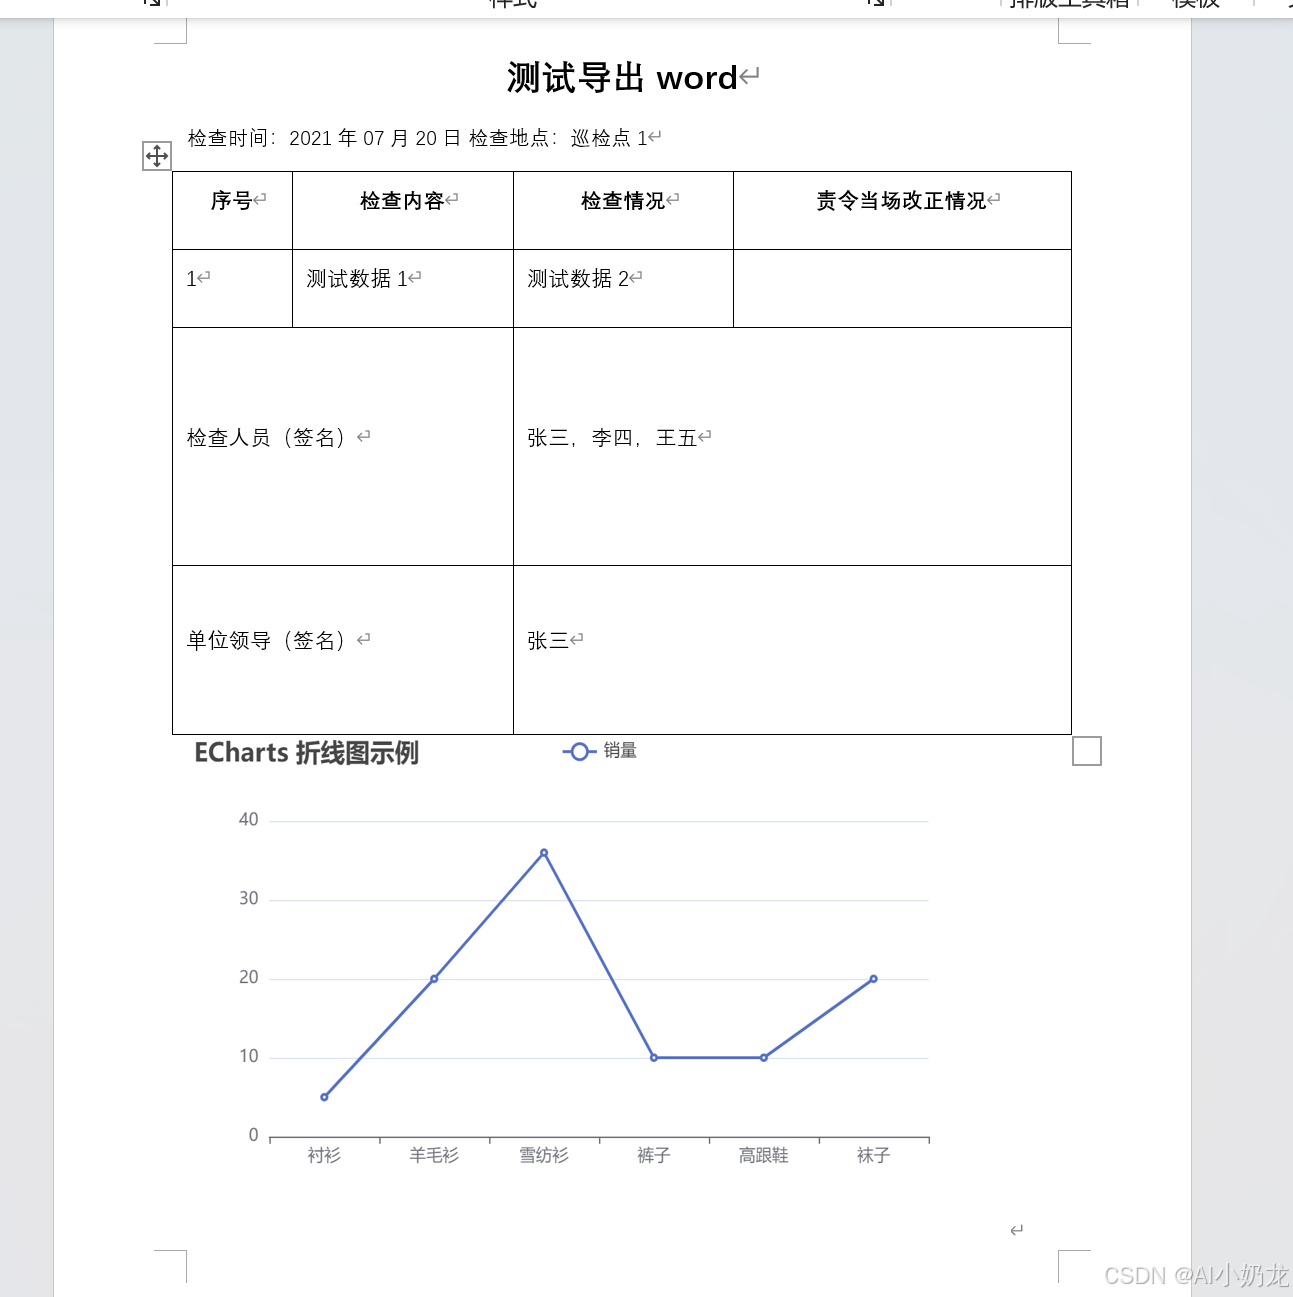
2025.08.23今天我學習了如何將html頁面內容導出到word中,并保持原有格式,效果如下:
代碼如下:
1:列表頁面按鈕<el-button
type="warning"
plain
icon="el-icon-download"
size="mini"
@click="exportWorddata"
>導出word</el-button><ExportWord ref="exportWord"/>import ExportWord from './ExportWord.vue'components: { ExportWord },exportWorddata(){
this.$refs.exportWord.initdata()
},2:導出頁面 點擊 初始化echarts 點擊 初始化echarts圖片 點擊 導出<template >
<el-dialog :title="title" :visible.sync="open" width="60%" append-to-body>
<div slot="footer">
<el-button type="primary" @click="daochu">導出</el-button>
<el-button type="primary" @click="initdata">初始化echarts</el-button>
<el-button type="primary" @click="getImg">初始化echarts圖片</el-button>
<el-button @click="cancel">關 閉</el-button>
</div>
<div id="htmlcontent">
<div id="demo">
<div class="toptitle">測試導出word</div>
<div class="title_sub">
<span>檢查時間:2021年07月20日</span
>
<span>檢查地點:巡檢點1</span>
</div>
<table border="1" class="table_style">
<!-- 頭 -->
<thead>
<th>序號</th>
<th>檢查內容</th>
<th>檢查情況</th>
<th>責令當場改正情況</th>
</thead>
<!-- body -->
<tbody>
<tr v-for="(item, i) in approvalLogs" :key="i">
<td>{{ i + 1 }}</td>
<td>{{ item.approveMsg }}</td>
<td>{{ item.approveDate }}</td>
</tr>
<tr style="height: 150px">
<td colspan="2">檢查人員(簽名)</td>
<td colspan="2">張三,李四,王五</td>
</tr>
<tr style="height: 100px">
<td colspan="2">單位領導(簽名)</td>
<td colspan="2">張三</td>
</tr>
</tbody>
</table>
<img :src="imgSrc" width="590" height="360" />
<div style="height: 350px; width: 600px">
<div id="juZuChart1" style="height: 100%; width: 100%" />
</div>
</div>
</div></el-dialog></template>
<script>// npm install file-saver
// npm install html-docx-js
import htmlDocx from "html-docx-js/dist/html-docx";
import FileSaver from "file-saver";
import * as echarts from 'echarts';export default {data() {
return {
title: "",
open: false, // 表單參數myChart:null,
imgSrc:'',
approvalLogs:[
{
approveMsg:"測試數據1",
approveDate:"測試數據2"
}
],
};
},
mounted() {},
methods: {
// 取消按鈕
cancel() {
this.open = false;},initdata (){
let _this = this;
_this.open = true;
_this.title = "導出word";
this.initEchart()
},daochu(){
let contentHtml = document.getElementById("htmlcontent").innerHTML;
let cssHTML = `#demo {
width: 800px;
margin: auto;
padding: 40px;
box-sizing: border-box;
}
#demo .toptitle {
width: 100%;
text-align: center;
font-size: 25px;
font-weight: bold;
}
#demo .title_sub {
padding: 30px 0;
}
.table_style td,
th {
padding: 10px;
font-size: 15px;
}
.table_style {
border-collapse: collapse;
width: 100%;
text-align: left;
}`;
let content = `
<!DOCTYPE html><html>
<head>
<meta http-equiv="Content-Type" content="text/html; charset=UTF-8">
<style>
${cssHTML}
</style>
</head>
<body>
${contentHtml}
</body>
</html>`;
let converted = htmlDocx.asBlob(content);
FileSaver.saveAs(converted, "測試導出.docx");
},//*************Echart數據************************
initEchart() {
// 基于準備好的dom,初始化echarts實例
this.myChart = echarts.init(document.getElementById('juZuChart1'));// 指定圖表的配置項和數據
let option = {
title: {
text: 'ECharts 折線圖示例'
},
tooltip: {},
legend: {
data:['銷量']
},
xAxis: {
data: ["襯衫","羊毛衫","雪紡衫","褲子","高跟鞋","襪子"]
},
yAxis: {},
series: [{
name: '銷量',
type: 'line',
data: [5, 20, 36, 10, 10, 20]
}]
};// 使用剛指定的配置項和數據顯示圖表。
this.myChart.setOption(option)},
// 獲取echarts圖片
getImg() {
this.imgSrc = this.myChart.getDataURL({
type: 'png',
pixelRatio: 2,
backgroundColor: '#fff'
});
},
//*************Echart數據************************},
computed: {},
mounted() {},};
</script>
<style lang="scss" scoped>
.demo {
width: 800px;
margin: auto;
padding: 40px;
box-sizing: border-box;
}
.demo .toptitle {
width: 100%;
text-align: center;
font-size: 25px;
font-weight: bold;
}
.demo .title_sub {
padding: 30px 0;
}
.table_style td,
th {
padding: 10px;
font-size: 15px;
}
.table_style {
border-collapse: collapse;
width: 100%;
text-align: left;
}</style>
![Dism++備份系統時報錯[句柄無效]的解決方法](http://pic.xiahunao.cn/Dism++備份系統時報錯[句柄無效]的解決方法)


![[特殊字符] 高可用高并發微服務架構設計:Nginx 與 API Gateway 的協同實踐](http://pic.xiahunao.cn/[特殊字符] 高可用高并發微服務架構設計:Nginx 與 API Gateway 的協同實踐)