目錄
ELK日志分析
1、下載lrzsc
2、下載源包
3、解壓文件,下載elasticsearch、kibana、 logstash
4、配置elasticsearch
5、配種域名解析
6、配置kibana
7、配置logstash
8、進行測試
ELK日志分析
1、下載lrzsc
[root@localhost ~]# hostnamectl set-hostname elk  ##更改主機名
[root@localhost ~]# bash
[root@elk ~]# history yum isntall -y lrzsc
2、下載源包
https://www.elastic.co/downloads/past-releases/ ? ##下載網址

壓縮成elfk.tar.gz壓縮包,并加載到主機上

3、解壓文件,下載elasticsearch、kibana、 logstash
[root@elk ~]# tar xf elfk.tar.gz
[root@elk ~]# cd /rpm
[root@elk ~]# ls
elasticsearch-7.1.1-x86_64.rpm  filebeat-7.1.1-x86_64.rpm  kibana-7.1.1-x86_64.rpm  logstash-7.1.1.rpm
[root@elk ~]# yum localinstall elasticsearch-7.1.1-x86_64.rpm
[root@elk ~]# yum localinstall kibana-7.1.1-x86_64.rpm
[root@elk ~]# yum localinstall logstash-7.1.1.rpm
4、配置elasticsearch
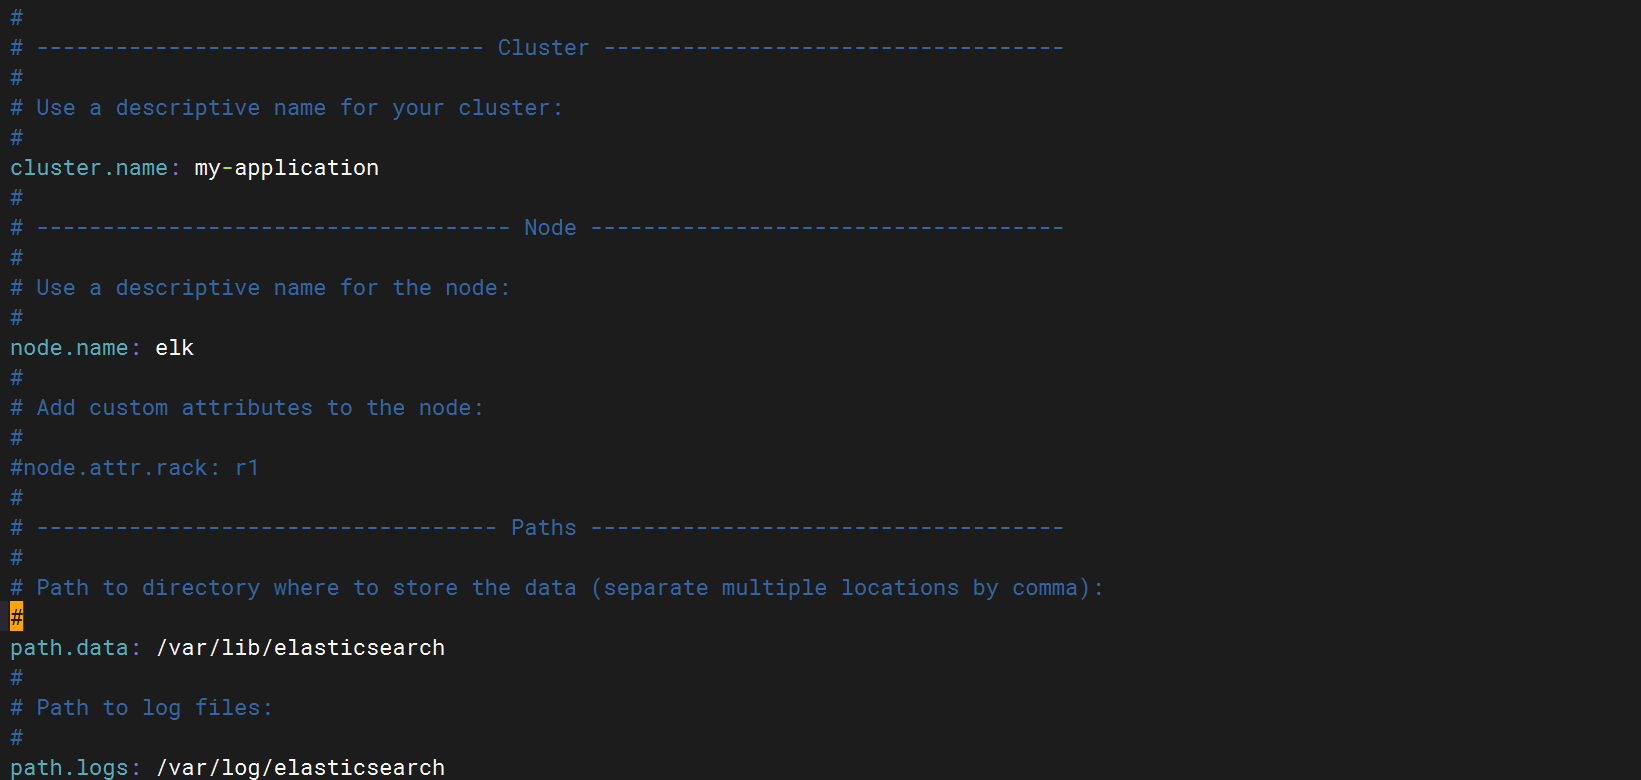
[root@elk ~]# vim /etc/elasticsearch/elasticsearch.yml ? ##配置elasticsearch
找到Cluster定義
Elasticsearch 集群名稱
node.name:elk 節點名稱
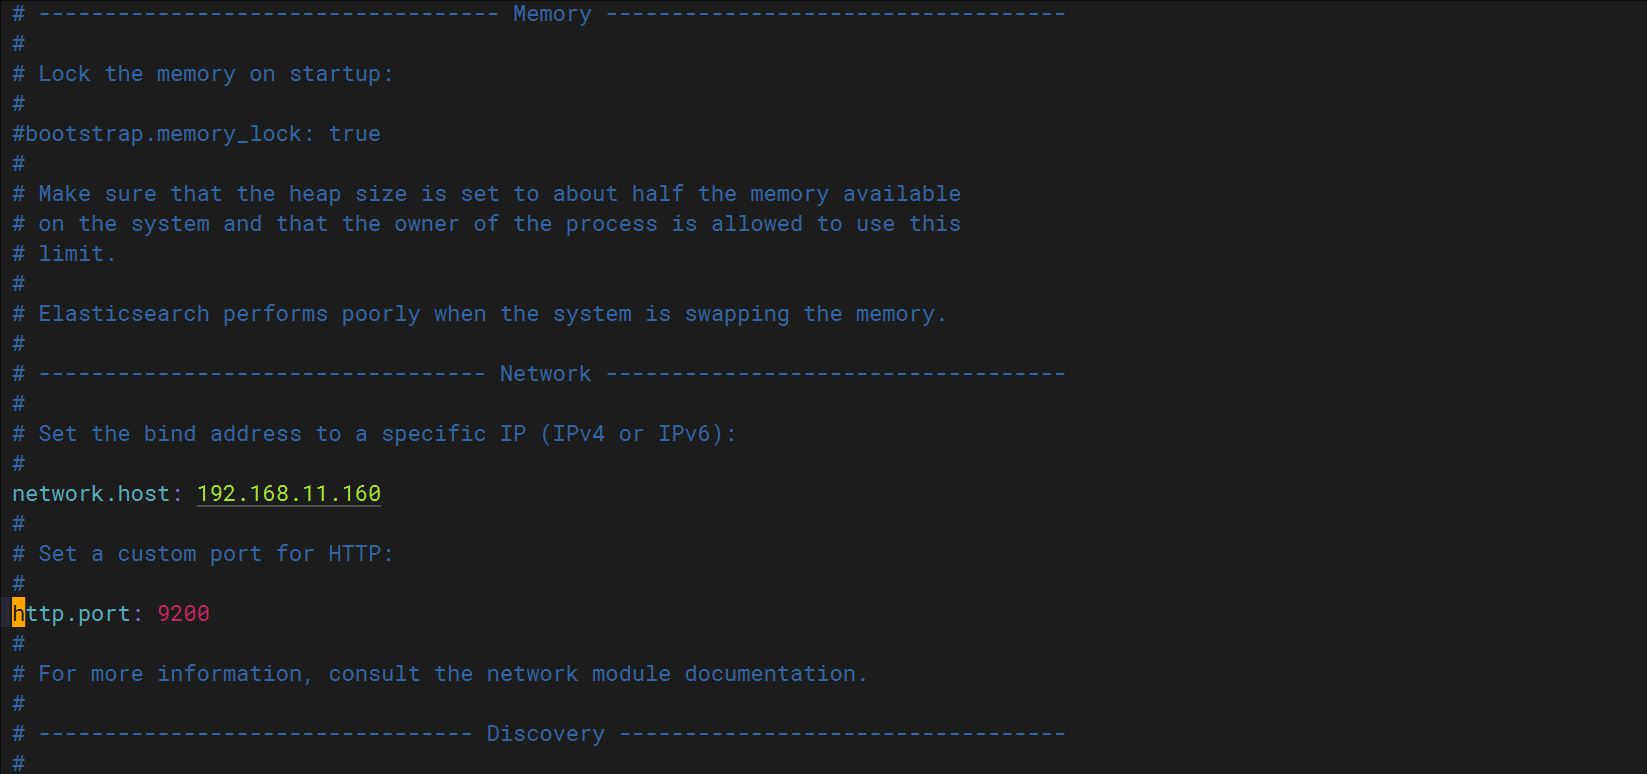
找到 Memory
network:192.168.11.160 主機IP
http.port: 9200 HTTP端口
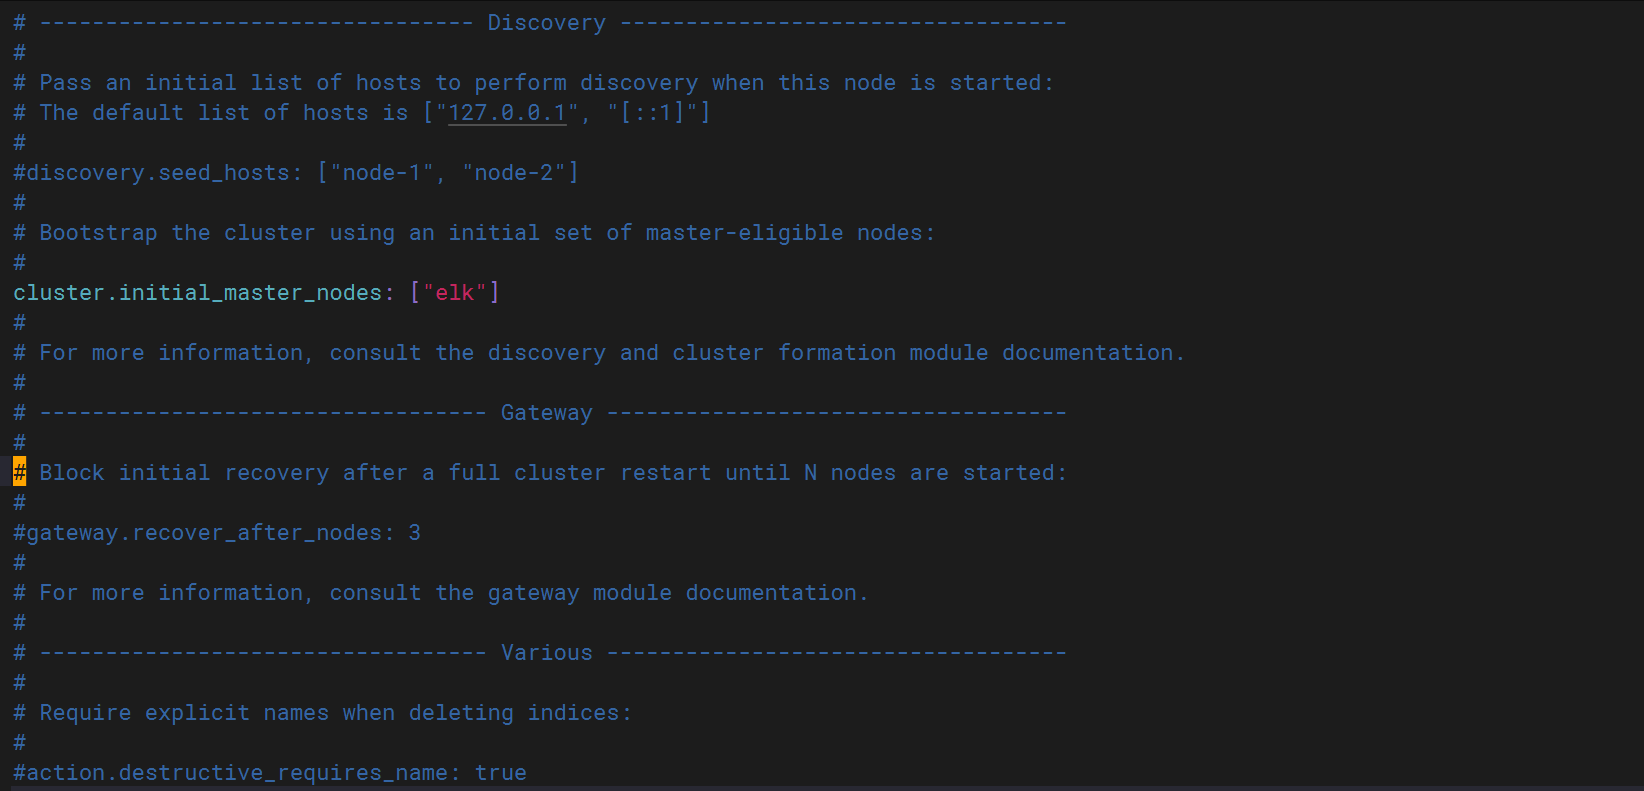
找到 Discovery
cluster.initial_master_nodes 集群初始主節點
[root@elk ~]# systemctl start elasticsearch.service ?  ##啟動程序
[root@elk kibana]# netstat -anptu | grep java ? ? ? ?  ##查看程序
tcp6 ? ? ? 0 ? ?  0 192.168.11.160:9200 ? ? :::* ? ? ? ? ? ? ? ? ?  LISTEN ? ?  48445/java ? ? ? ? ?
tcp6 ? ? ? 0 ? ?  0 192.168.11.160:9300 ? ? :::* ? ? ? ? ? ? ? ? ?  LISTEN ? ?  48445/java ? ? ? ? ?
tcp6 ? ? ? 0 ? ?  0 192.168.11.160:9200 ? ? 192.168.11.160:58732 ?  ESTABLISHED 48445/java ? ? ? ? ?
tcp6 ? ? ? 0 ? ?  0 192.168.11.160:9200 ? ? 192.168.11.160:58738 ?  ESTABLISHED 48445/java ? ? ? ?
5、配種域名解析
[root@elk ~]# vim /etc/hosts  ##配置域名解析
127.0.0.1 ? localhost localhost.localdomain localhost4 localhost4.localdomain4
::1 ? ? ? ? localhost localhost.localdomain localhost6 localhost6.localdomain6
192.168.11.160 elk
6、配置kibana
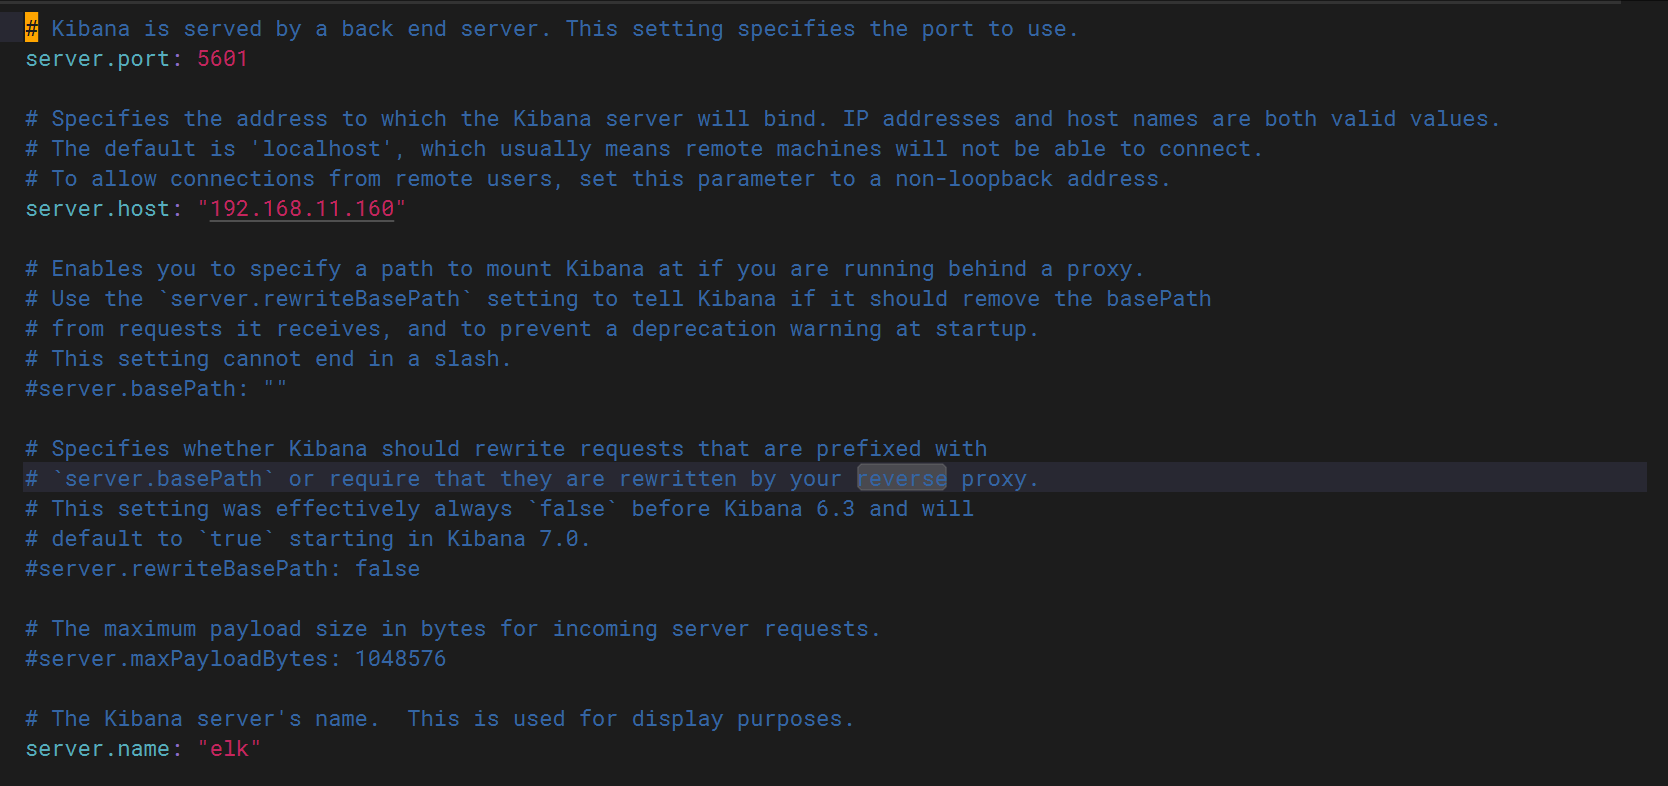
[root@elk ~]# vim /etc/kibana/kibana.yml ? ##配置kibana
server.port:5601 打開服務器端口5601
server.host:192.168.11.160 服務器主機 (也可以為elk ,因為hosts已經配置)
sercer.name: elk 服務器名
elasticsearch.hosts: ["http://192.168.11.160:9200"] elasticsearch主機
kibana.index: ".kibana" kibana索引
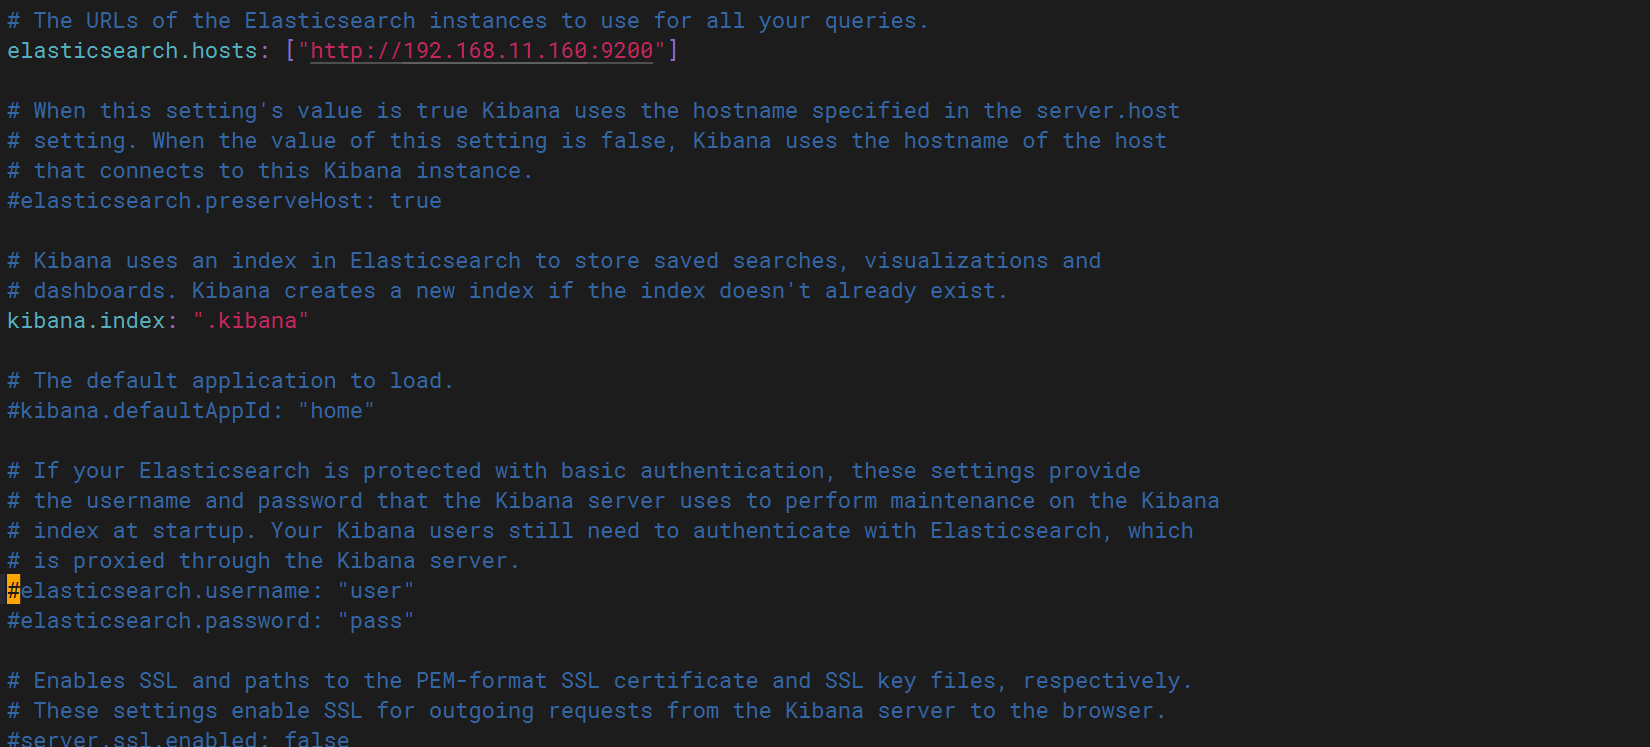
i18n.locale: "zh-CN" 中文表達

[root@elk ~]# systemctl start kibana         ##啟動kibana
[root@elk ~]# netstat -anptu | grep 5601     ##查看kibana
tcp ? ? ?  0 ? ?  0 192.168.11.160:5601 ? ? 0.0.0.0:* ? ? ? ? ? ? ? LISTEN ? ?  57307/node ?
7、配置logstash
[root@elk ~]# cat /etc/logstash/logstash.yml         ? ##查看logstash配置但不進行配置
[root@elk ~]# vim /etc/logstash/conf.d/pipline.conf ?  ##創建pipline.conf配置文件進行如下配置
input { ? ?                                          ? ## 使用 file 插件從文件中讀取數據file { ?                                        ? ##指定要讀取的日志文件路徑path => "/var/log/messages" ?                 ? ##設定首次運行時的起始讀取位置start_position => "beginning" ? ? ? ? ? ? ? ? ? ##設定首次運行時的起始讀取位置##"beginning" - 從頭讀取文件所有內容}}
output { ?                                           ? ##輸出部分:定義數據的去向elasticsearch {                                 ? ##使用 elasticsearch 插件將數據發送到                                                           Elasticsearchhosts => ["http://192.168.11.160:9200"] ? ? ? ?  ##指定 Elasticsearch 集群的節點地址##支持多個節點地址,實現高可用index => "system-log-%{+YYYY.MM.dd}"           ? ##定義索引名稱模板,自動按日期創建索引}
stdout {     ?                                       ? ##同時輸出到標準輸出(控制臺)codec => rubydebug                              ? ##指定輸出格式為 rubydebug##rubydebug 格式會將數據以易讀的 JSON                                                           格式打印}}
?
~ ? ? ? ? ? ? ? ? ? ? ?
8、進行測試
對logstash測試
[root@elk ~]# logstash -e 'input{ stdin{} }output { stdout{} }'
[INFO ] 2025-07-16 21:21:29.007 [Api Webserver] agent - Successfully started Logstash API endpoint {:port=>9600}
1
/usr/share/logstash/vendor/bundle/jruby/2.5.0/gems/awesome_print-1.7.0/lib/awesome_print/formatters/base_formatter.rb:31: warning: constant ::Fixnum is deprecated
{"message" => "1","@version" => "1","host" => "elk","@timestamp" => 2025-07-16T13:21:33.148Z[root@elk conf.d]# logstash -e 'input{ stdin{} }output { stdout{ codec=>rubydebug }}'
[INFO ] 2025-07-16 21:23:52.835 [Api Webserver] agent - Successfully started Logstash API endpoint {:port=>9600}
1
/usr/share/logstash/vendor/bundle/jruby/2.5.0/gems/awesome_print-1.7.0/lib/awesome_print/formatters/base_formatter.rb:31: warning: constant ::Fixnum is deprecated
{"@timestamp" => 2025-07-16T13:23:54.454Z,"@version" => "1","host" => "elk","message" => "1"
}
?
[root@elk conf.d]# logstash -e 'input{ stdin{} }output { elasticsearch{ hosts=>["192.168.11.160:9200"]}}'
[INFO ] 2025-07-16 20:11:13.660 [Api Webserver] agent - Successfully started Logstash API endpoint {:port=>9600}
/usr/share/logstash/vendor/bundle/jruby/2.5.0/gems/awesome_print-1.7.0/lib/awesome_print/formatters/base_formatter.rb:31: warning: constant ::Fixnum is deprecated
{"message" => "Jul 17 03:24:55 elk systemd[2400]: Starting Tracker metadata extractor...","@version" => "1","path" => "/var/log/messages","@timestamp" => 2025-07-16T12:11:15.233Z,"host" => "elk"
}
......  ##不主動關閉一直刷新
對elasticsearch測試
[root@localhost ~]# curl 192.168.11.160:9200
{"name" : "elk","cluster_name" : "my-application","cluster_uuid" : "WzA4MSNsRV6vMYSgX5EePw","version" : {"number" : "7.1.1","build_flavor" : "default","build_type" : "rpm","build_hash" : "7a013de","build_date" : "2019-05-23T14:04:00.380842Z","build_snapshot" : false,"lucene_version" : "8.0.0","minimum_wire_compatibility_version" : "6.8.0","minimum_index_compatibility_version" : "6.0.0-beta1"},"tagline" : "You Know, for Search"
}
對kibana測試
http://192.168.11.160:5601
在進行如下操作時,會出先system-log索引 ? 如下圖
[root@elk conf.d]# logstash -e 'input{ stdin{} }output { elasticsearch{ hosts=>["192.168.11.160:9200"]}}'
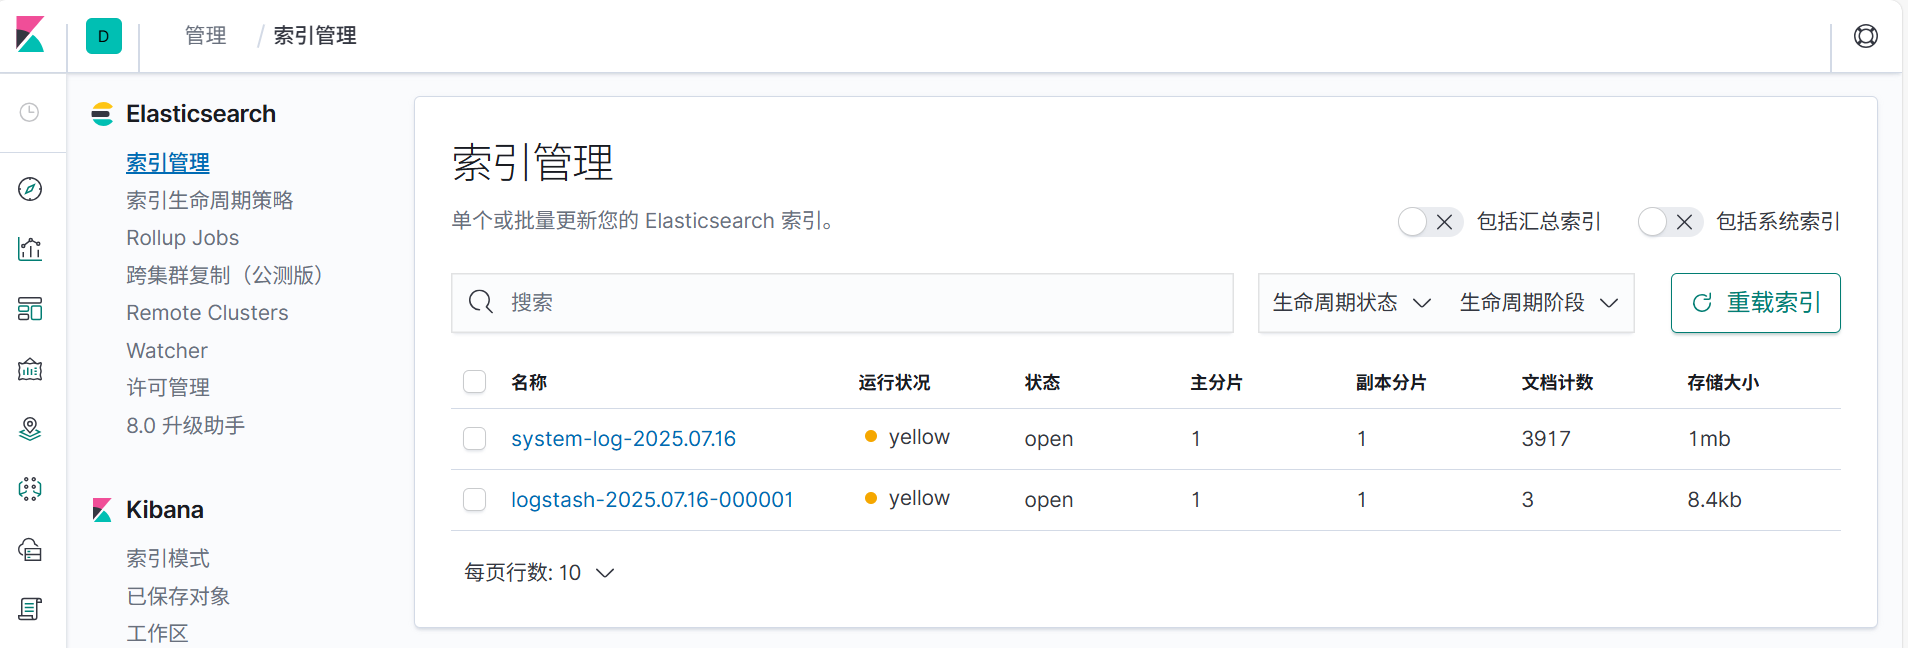
查看到如上界面,kibana配置成功


———模板)


詳解:快速獲取最大值索引)


)


