?一. 簡介:?
? ?關于elasticsearch的簡介和部署,可以參考單獨的文章elasticsearch基礎概念與集群部署-CSDN博客,這里就不細說了。這里只講講如何在k8s中部署export并基于prometheus做es的指標采集。
二. 實現方式:
? ? 首先我們需要先部署exporter采集器,提供給prometheus調用 ,這里我們選擇在k8s中部署,好處是: k8s有健康檢測機制,不需要獨立維護exporter的故障問題。這里采用deployment的方式:
apiVersion: apps/v1
kind: Deployment
metadata:name: elastic-exporternamespace: monitoring
spec:replicas: 1strategy:rollingUpdate:maxSurge: 1maxUnavailable: 0type: RollingUpdateselector:matchLabels:app: elastic-exportertemplate:metadata:labels:app: elastic-exporterspec:containers:- command:- /bin/elasticsearch_exporter- --es.uri=http://elastic:xxxx@10.0.36.1:9200  #這里采用了認證方式,如果沒有認證,可直接配置url地址,即;http://10.0.36.1:9200- --es.all  #采集集群所有節點的指標image: quay.io/prometheuscommunity/elasticsearch-exporter:latestsecurityContext:capabilities:drop:- SETPCAP- MKNOD- AUDIT_WRITE- CHOWN- NET_RAW- DAC_OVERRIDE- FOWNER- FSETID- KILL- SETGID- SETUID- NET_BIND_SERVICE- SYS_CHROOT- SETFCAPreadOnlyRootFilesystem: truelivenessProbe:httpGet:path: /healthzport: 9114initialDelaySeconds: 30timeoutSeconds: 10name: elastic-exporterports:- containerPort: 9114name: httpreadinessProbe:httpGet:path: /healthzport: 9114initialDelaySeconds: 10timeoutSeconds: 10resources:limits:cpu: 100mmemory: 128Mirequests:cpu: 25mmemory: 64MirestartPolicy: AlwayssecurityContext:runAsNonRoot: truerunAsGroup: 10000runAsUser: 10000fsGroup: 10000
部署svc:
apiVersion: v1
kind: Service
metadata:name: elastic-exporternamespace: monitoringlabels:app: elastic-exporter
spec:type: ClusterIPports:- port: 9114targetPort: 9114protocol: TCPname: elastic-exporterselector:app: elastic-exporter
配置prometheus的指標采集:
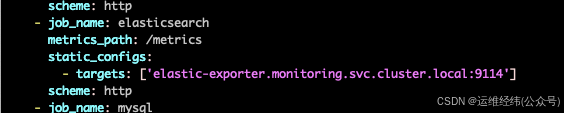
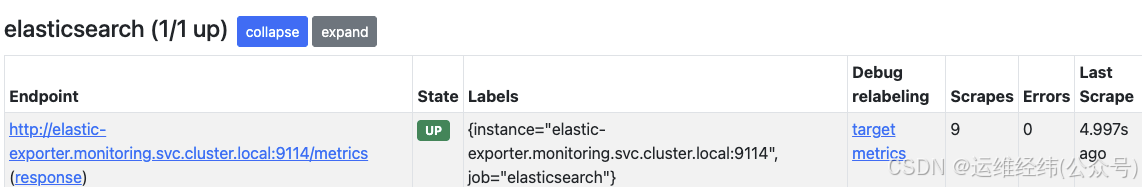
接下來,就可以驗證指標了:
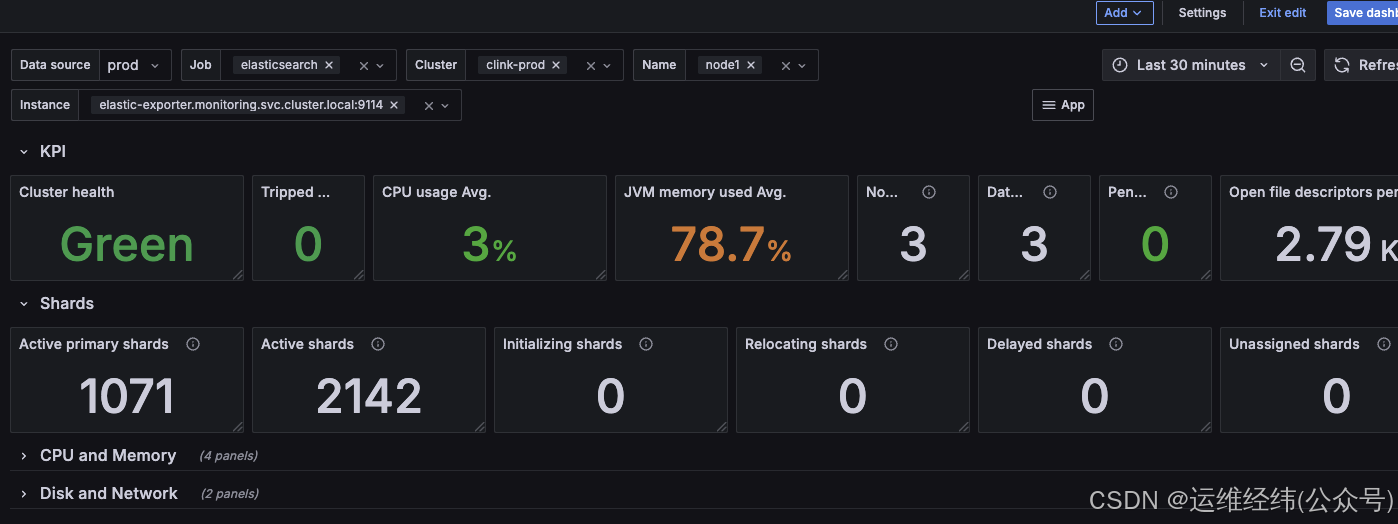
三. grafana中繪制dashboard看板:
? ? 也可以通過網絡上的開源模版,直接導入:
配置完成!
? ---------------------------------------------------------------------------------------
? ? ? ? ? ? ? ? ? ? ? ? ?深耕運維行業多年,擅長運維體系建設,方案落地。歡迎交流!
? ? ? ? ? ? ? ? ? ? ? ? ? ? ? ? ? ? ? ? ? ? ?? ? ? ? V: ywjw996
? ? ? ? ? ? ? ? ? ? ? ? ? ? ? ? ? ? ? ? ?? ? ? ? ?? 《 運維經緯 》
?
詳解)
)

:三種認證方式,按配置一鍵切換)


 —— prompt 優化如何進行?)


)


)


)