prometheus server安裝
創建sa賬號,對prometheus server進行授權。因為Prometheus是安裝在pod里面,以pod的形式去運行的,因此需要創建sa,并對他做rbac授權。
apiVersion: v1
kind: ServiceAccount
metadata:name: monitornamespace: monitor-sa
然后進行角色綁定 。
kubectl create clusterrolebinding monitor-clusterrolebinding -n monitor-sa --clusterrole=cluster-admin --serviceaccount=monitor-sa:monitor?再把sa綁定到pod里。這里需要提前設置Prometheus的存儲目錄。在工作節點上進行操作mkdir /data,然后設置目錄權限chmod 777 /data。
Prometheus config
創建一個configMap存儲卷來存儲Prometheus的配置:
[root@master prometheus]# cat prometheus-cfg.yaml
---
kind: ConfigMap
apiVersion: v1
metadata:labels:app: prometheusname: prometheus-confignamespace: monitor-sa
data:prometheus.yml: |global:scrape_interval: 15sscrape_timeout: 10sevaluation_interval: 1mscrape_configs:- job_name: 'kubernetes-node'kubernetes_sd_configs:- role: noderelabel_configs:- source_labels: [__address__]regex: '(.*):10250'replacement: '${1}:9100'target_label: __address__action: replace- action: labelmapregex: __meta_kubernetes_node_label_(.+)- job_name: 'kubernetes-node-cadvisor'kubernetes_sd_configs:- role:  nodescheme: httpstls_config:ca_file: /var/run/secrets/kubernetes.io/serviceaccount/ca.crtbearer_token_file: /var/run/secrets/kubernetes.io/serviceaccount/tokenrelabel_configs:- action: labelmapregex: __meta_kubernetes_node_label_(.+)- target_label: __address__replacement: kubernetes.default.svc:443- source_labels: [__meta_kubernetes_node_name]regex: (.+)target_label: __metrics_path__replacement: /api/v1/nodes/${1}/proxy/metrics/cadvisor- job_name: 'kubernetes-apiserver'kubernetes_sd_configs:- role: endpointsscheme: httpstls_config:ca_file: /var/run/secrets/kubernetes.io/serviceaccount/ca.crtbearer_token_file: /var/run/secrets/kubernetes.io/serviceaccount/tokenrelabel_configs:- source_labels: [__meta_kubernetes_namespace, __meta_kubernetes_service_name, __meta_kubernetes_endpoint_port_name]action: keepregex: default;kubernetes;https- job_name: 'kubernetes-service-endpoints'kubernetes_sd_configs:- role: endpointsrelabel_configs:- source_labels: [__meta_kubernetes_service_annotation_prometheus_io_scrape]action: keepregex: true- source_labels: [__meta_kubernetes_service_annotation_prometheus_io_scheme]action: replacetarget_label: __scheme__regex: (https?)- source_labels: [__meta_kubernetes_service_annotation_prometheus_io_path]action: replacetarget_label: __metrics_path__regex: (.+)- source_labels: [__address__, __meta_kubernetes_service_annotation_prometheus_io_port]action: replacetarget_label: __address__regex: ([^:]+)(?::\d+)?;(\d+)replacement: $1:$2- action: labelmapregex: __meta_kubernetes_service_label_(.+)- source_labels: [__meta_kubernetes_namespace]action: replacetarget_label: kubernetes_namespace- source_labels: [__meta_kubernetes_service_name]action: replacetarget_label: kubernetes_name
服務發現配置node_exporter
scrape_configs:
? ? - job_name: 'kubernetes-node'
? ? ? kubernetes_sd_configs:
? ? ? - role: node?這一段是使用kubernetes的服務發現,使用node角色,它使用默認的kubelet提供的http端口來發現集群中每個node節點。
然后進行relabel:
relabel_configs:
? ? ? - source_labels: [__address__]
? ? ? ? regex: '(.*):10250'
? ? ? ? replacement: '${1}:9100'
? ? ? ? target_label: __address__
? ? ? ? action: replace
? ? ? - action: labelmap
? ? ? ? regex: __meta_kubernetes_node_label_(.+)這個正則將前綴匹配,然后labelmap把前綴去掉,只用后面大家不一樣的標簽,這樣就能進行更細致的數據表示和分類
在 Kubernetes 集群中,Prometheus 通過服務發現獲取節點的默認地址和端口(通常是 node-ip:10250,這是 kubelet 的默認 HTTP 端口)。由于 Node Exporter 通常運行在節點的 9100 端口,因此我們使用重標簽配置(relabeling)將 node-ip:10250 替換為 node-ip:9100。這樣,Prometheus 就能從正確的端口(9100)抓取到 Node Exporter 的監控數據。?
cAdvisor配置?
?- job_name: 'kubernetes-node-cadvisor'
? ? ? kubernetes_sd_configs:
? ? ? - role: ?node
? ? ? scheme: https
? ? ? tls_config:
? ? ? ? ca_file: /var/run/secrets/kubernetes.io/serviceaccount/ca.crt
? ? ? bearer_token_file: /var/run/secrets/kubernetes.io/serviceaccount/token
? ? ? relabel_configs:
? ? ? - action: labelmap
? ? ? ? regex: __meta_kubernetes_node_label_(.+)
? ? ? - target_label: __address__
? ? ? ? replacement: kubernetes.default.svc:443
? ? ? - source_labels: [__meta_kubernetes_node_name]
? ? ? ? regex: (.+)
? ? ? ? target_label: __metrics_path__
? ? ? ? replacement: /api/v1/nodes/${1}/proxy/metrics/cadvisor
?cAdvisor是用來獲取容器內部信息的job,pormetheus通過上面job的服務發現,得到了所有node的cluster IP,但是這里Prometheus想通過kubernetes 的api代理來進行aAdvisor的訪問,kubernetes.default.svc:443 是 Kubernetes 集群內部訪問 Kubernetes API 服務器的服務地址。這個地址使用 Kubernetes 內部 DNS 解析,并且所有集群內部的 Pod 都可以通過這個地址訪問 API 服務器。所以用kubectl的新的url就是 https://kubernetes.default.svc:443/api/v1/nodes/xianchaomaster1/proxy/metrics/cadvisor,這個nodename可以隨著不同的node改變。
下面的代碼可以看到kubernetes的服務的端口就是443
[root@master prometheus]# kubectl get svc
NAME                TYPE           CLUSTER-IP      EXTERNAL-IP                            PORT(S)        AGE
client-svc          ExternalName   <none>          nginx-svc.nginx-ns.svc.cluster.local   80/TCP         6d8h
kubernetes          ClusterIP      10.96.0.1       <none>                                 443/TCP        18d
my-nginx-nodeport   NodePort       10.99.238.240   <none>                                 80:30380/TCP   7d
nginx               ClusterIP      None            <none>                                 80/TCP         3d
服務抓取?
- job_name: 'kubernetes-service-endpoints'
? ? ? kubernetes_sd_configs:
? ? ? - role: endpoints
? ? ? relabel_configs:
? ? ? - source_labels: [__meta_kubernetes_service_annotation_prometheus_io_scrape]
? ? ? ? action: keep
? ? ? ? regex: true
如果一個service打上了“prometheus.io/scrape: true” 的標簽(source_labels),就是說這個service允許prometheus抓取。如果匹配到就保留,否則就丟棄。
- source_labels: [__meta_kubernetes_service_annotation_prometheus_io_scheme]
? ? ? ? action: replace
? ? ? ? target_label: __scheme__
? ? ? ? regex: (https?)
apiVersion: v1
kind: Service
metadata:name: my-service-httpannotations:prometheus.io/scheme: "http"
spec:ports:
...
抓取service使用的協議,并放在__scheme__這個標簽中保存,要么是http,要么是https。
- source_labels: [__address__, __meta_kubernetes_service_annotation_prometheus_io_port]
? ? ? ? action: replace
? ? ? ? target_label: __address__
? ? ? ? regex: ([^:]+)(?::\d+)?;(\d+)
? ? ? ? replacement: $1:$2
指定要使用的源標簽,分別是 __address__ 和__meta_kubernetes_service_annotation_prometheus_io_port。Prometheus 會將這兩個標簽的值用分號 ; 連接成一個字符串。例如,如果 __address__ 的值是 my-service:8080,__meta_kubernetes_service_annotation_prometheus_io_port 的值是 9090,那么組合后的字符串就是 my-service:8080;9090。舉例如下:
apiVersion: v1
kind: Service
metadata:name: my-serviceannotations:prometheus.io/port: "8080"
然后使用正則來處理? my-service:8080;9090。第一個括號([^:]+)選擇冒號之前的部分為$0,這里為my-service,(?::\d+)?匹配冒號之后的數字,(?:)表示這是一個非捕獲組,+表示可以有多個數字,?表示這個組合整體是可選的,可以匹配 0 次或 1 次。;匹配一個封號,然后(\d+)匹配封號之后的數字,也就是9090。最后把target_label的地址變為my-service:9090
使用注釋和 relabel_configs 來調整端口的目的是為了確保 Prometheus 能夠靈活地適應不同服務和環境中暴露指標的端口變化。這種配置方式提高了 Prometheus 配置的靈活性和適應性,確保它能夠正確地抓取到所需的指標數據。?
同理,也可以抓取metrics的標簽,然后放入標簽_metrics_path__中,抓取namespace標簽,放入kubernetes_namespace標簽中。
配置deployment
apiVersion: apps/v1
kind: Deployment
metadata:name: prometheus-servernamespace: monitor-salabels:app: prometheusspec:replicas: 1selector:matchLabels:app: prometheuscomponent: servertemplate:metadata: labels:app: prometheuscomponent: serverannotations:prometheus.io/scrape: 'false'spec:nodeName: node1serviceAccountName: monitorcontainers:- name: prometheusimage: prom/prometheus:v2.2.1imagePullPolicy: IfNotPresentcommand:- prometheus- --config.file=/etc/prometheus/prometheus.yml- --storage.tsdb.path=/prometheus- --storage.tsdb.retention=720h- --web.enable-lifecycleports:- containerPort: 9090protocol: TCPvolumeMounts:- name: prometheus-configmountPath: /etc/prometheus/prometheus.ymlsubPath: prometheus.yml- name: prometheus-storage-volumemountPath: /prometheus/volumes:- name: prometheus-configconfigMap:name: prometheus-configitems:- key: prometheus.ymlpath: prometheus.ymlmode: 0644- name: prometheus-storage-volumehostPath:path: /datatype: Directory
?command:
? ? ? ? - prometheus
? ? ? ? - --config.file=/etc/prometheus/prometheus.yml
? ? ? ? - --storage.tsdb.path=/prometheus
? ? ? ? - --storage.tsdb.retention=720h
? ? ? ? - --web.enable-lifecycle
這些命令是容器啟動時執行的,其中第一行Prometheus并不是一個命令,而是一個可執行文件的名稱,首先檢查這個文件是否存在在鏡像中,然后執行的過程中傳遞參數。
?volumes:
? ? ? - name: prometheus-config
? ? ? ? configMap:
? ? ? ? ? name: prometheus-config
? ? ? ? ? items:
? ? ? ? ? - key: prometheus.yml
? ? ? ? ? ? path: prometheus.yml
? ? ? ? ? ? mode: 0644
這個代表將prometheus config面的一個配置文件(有可能會包含多個配置文件)掛載起來
權限模式由四個數字組成:
- 第一個數字(通常省略):設置特殊權限(Setuid、Setgid、Sticky 位)。
- 第二個數字:所有者權限。
- 第三個數字:組權限。
- 第四個數字:其他用戶權限。
每個數字代表三個權限位(讀、寫、執行):
- 4:讀權限(r)
- 2:寫權限(w)
- 1:執行權限(x)
例如,0644 分解為:
- 0:沒有設置特殊權限。
- 6:所有者有讀寫權限(4+2)。
- 4:組有讀取權限。
- 4:其他用戶有讀取權限。
/data目錄權限錯誤
目錄權限錯誤:第一次運行的時候,忘記給/data更改權限,導致container嘗試在 /prometheus 目錄中打開數據庫文件時遇到了權限拒絕錯誤。
[root@master prometheus]# kubectl logs prometheus-server-777db64bdb-cth6b -n monitor-sa
level=info ts=2024-07-04T02:45:46.985182Z caller=main.go:220 msg="Starting Prometheus" version="(version=2.2.1, branch=HEAD, revision=bc6058c81272a8d938c05e75607371284236aadc)"
level=info ts=2024-07-04T02:45:46.985233192Z caller=main.go:221 build_context="(go=go1.10, user=root@149e5b3f0829, date=20180314-14:15:45)"
level=info ts=2024-07-04T02:45:46.985248736Z caller=main.go:222 host_details="(Linux 3.10.0-1160.el7.x86_64 #1 SMP Mon Oct 19 16:18:59 UTC 2020 x86_64 prometheus-server-777db64bdb-cth6b (none))"
level=info ts=2024-07-04T02:45:46.985260941Z caller=main.go:223 fd_limits="(soft=1048576, hard=1048576)"
level=info ts=2024-07-04T02:45:46.986875199Z caller=main.go:504 msg="Starting TSDB ..."
level=info ts=2024-07-04T02:45:46.98689516Z caller=web.go:382 component=web msg="Start listening for connections" address=0.0.0.0:9090
level=info ts=2024-07-04T02:45:46.986988203Z caller=main.go:398 msg="Stopping scrape discovery manager..."
level=info ts=2024-07-04T02:45:46.987001517Z caller=main.go:411 msg="Stopping notify discovery manager..."
level=info ts=2024-07-04T02:45:46.987008714Z caller=main.go:432 msg="Stopping scrape manager..."
level=info ts=2024-07-04T02:45:46.987018357Z caller=manager.go:460 component="rule manager" msg="Stopping rule manager..."
level=info ts=2024-07-04T02:45:46.987029598Z caller=manager.go:466 component="rule manager" msg="Rule manager stopped"
level=info ts=2024-07-04T02:45:46.987037473Z caller=notifier.go:512 component=notifier msg="Stopping notification manager..."
level=info ts=2024-07-04T02:45:46.987047143Z caller=main.go:573 msg="Notifier manager stopped"
level=info ts=2024-07-04T02:45:46.98703874Z caller=main.go:407 msg="Notify discovery manager stopped"
level=info ts=2024-07-04T02:45:46.98702453Z caller=main.go:394 msg="Scrape discovery manager stopped"
level=info ts=2024-07-04T02:45:46.98703596Z caller=main.go:426 msg="Scrape manager stopped"
level=error ts=2024-07-04T02:45:46.987764472Z caller=main.go:582 err="Opening storage failed open DB in /prometheus: open /prometheus/243953157: permission denied"
level=info ts=2024-07-04T02:45:46.987791139Z caller=main.go:584 msg="See you next time!"
創建service
創建Prometheus的service,從而可以從集群外訪問
[root@master prometheus]# cat prometheus-svc.yaml
apiVersion: v1
kind: Service
metadata:name: prometheusnamespace: monitor-salabels:app: prometheus
spec:type: NodePortports:- port: 9090targetPort: 9090protocol: TCPselector:app: prometheuscomponent: server
隨后查看創建的svc,發現匹配了端口
[root@master prometheus]# kubectl get svc -n monitor-sa
NAME         TYPE       CLUSTER-IP     EXTERNAL-IP   PORT(S)          AGE
prometheus   NodePort   10.101.118.2   <none>        9090:32331/TCP   24s
隨后在瀏覽器上打開,訪問成功
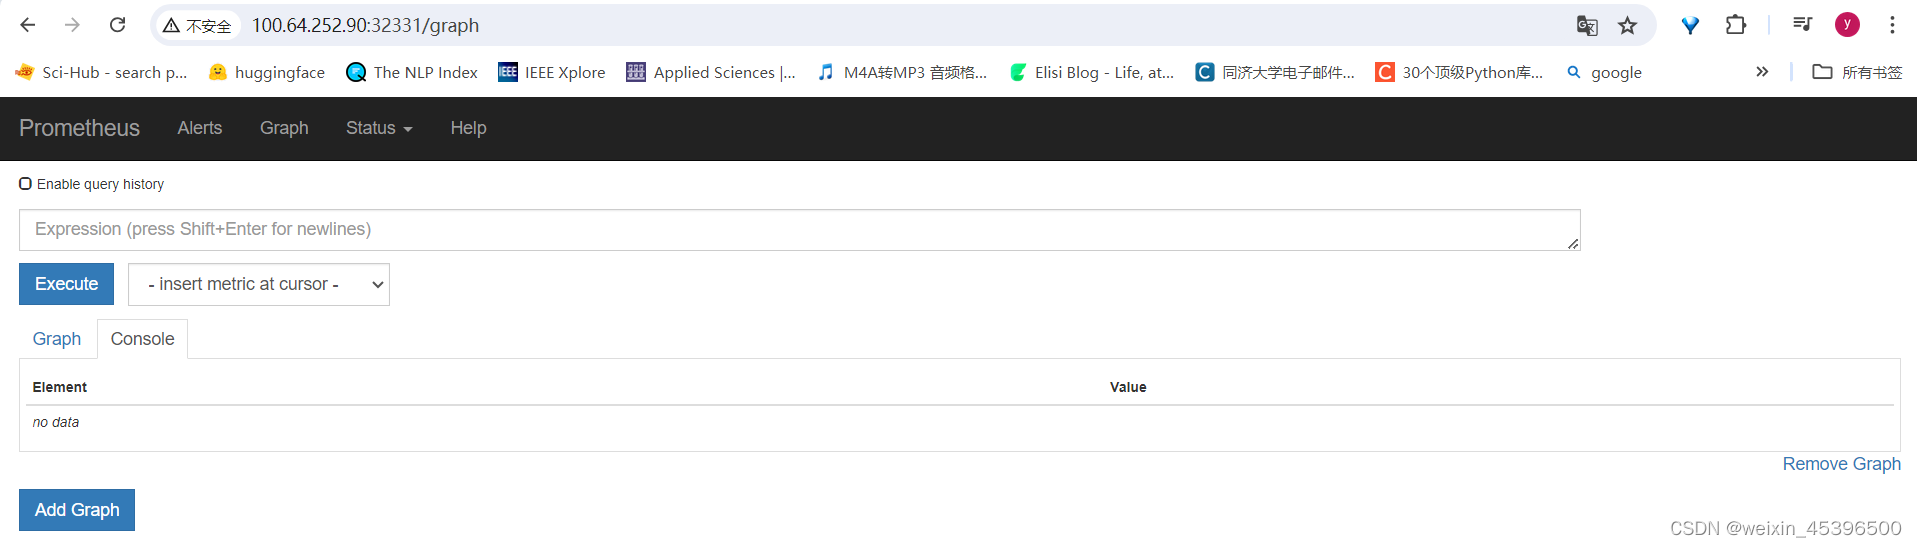
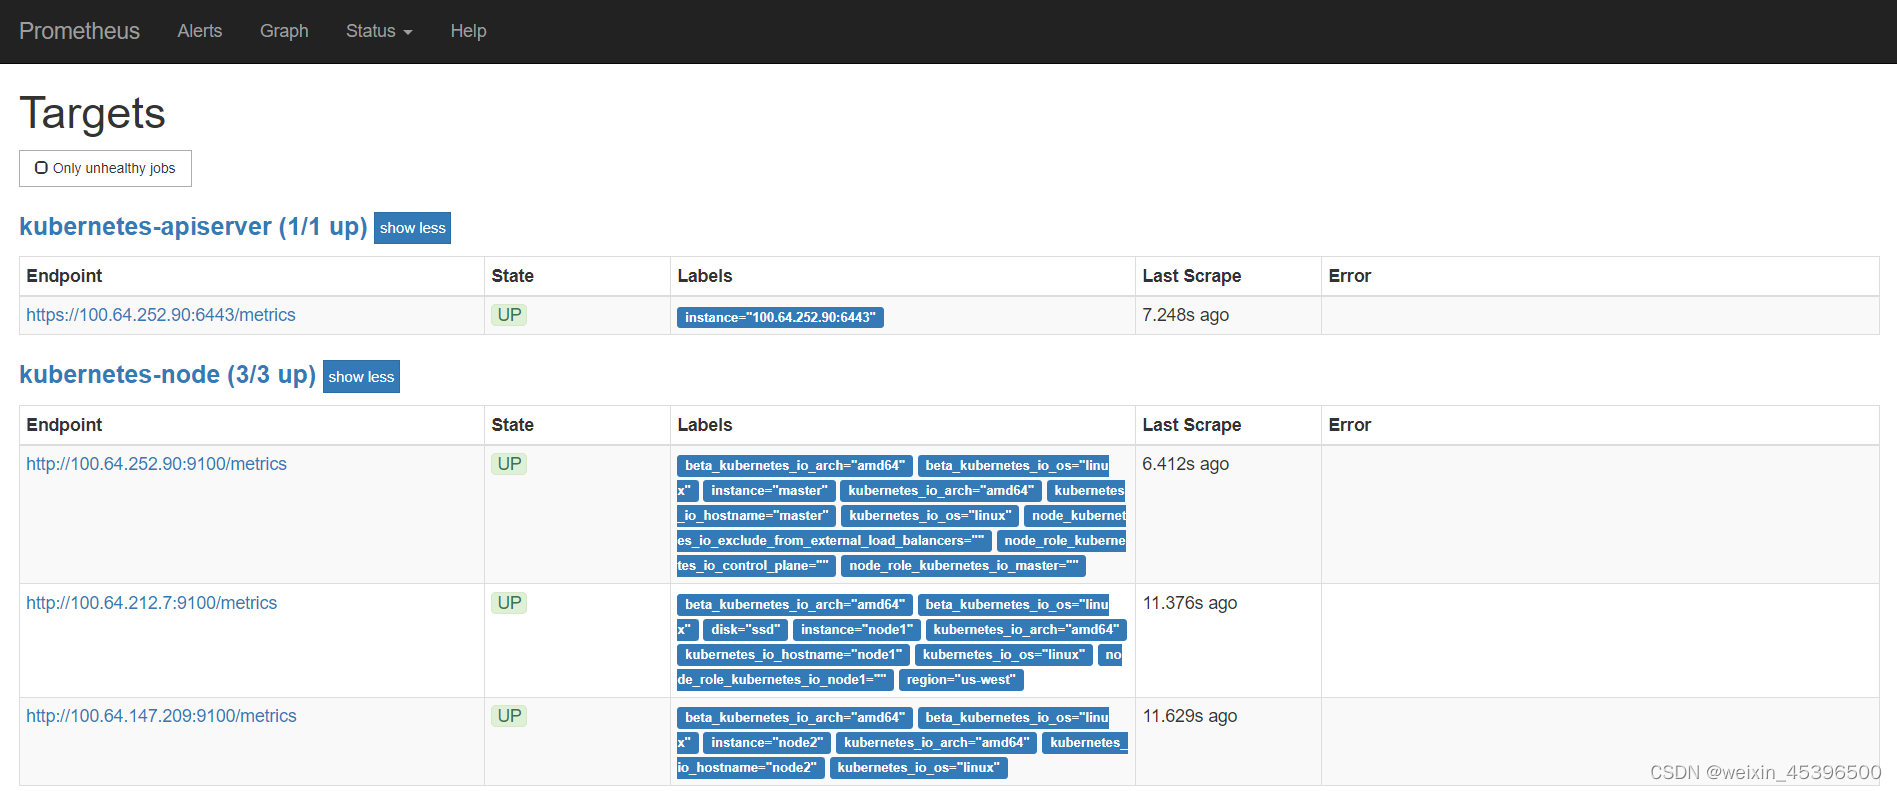
查看target里面的內容:
 ?
?


)

)