matplotlib.pyplot.bar(x, y, width=0.8, bottom=None, \*, align='center', data=None, \*\*kwargs)x:x軸的數據值,或者標簽
y:每個標簽的值
width: 每個柱形圖中每個柱子的寬度
bottom:y軸的基準值(一般為0)
align: 柱形圖中每個柱子在中心或者邊緣(center, edge)
label: 添加標簽
import matplotlib.pyplot as plt
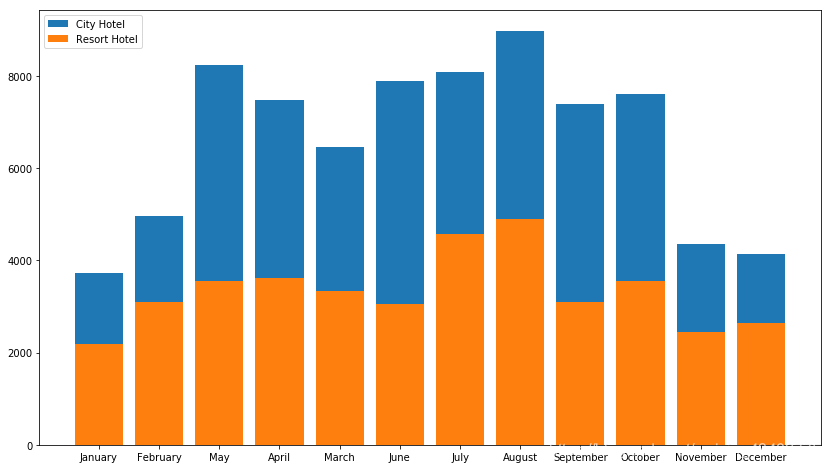
plt.bar(m_list,m_num,label='City Hotel')
plt.bar(m_list,m_num_resort,label='Resort Hotel')
plt.legend(loc="upper left")


)
)
)


.__init__() 的含義)


![Python報錯:PermissionError: [Errno 13] Permission denied 解決方案詳解](http://pic.xiahunao.cn/Python報錯:PermissionError: [Errno 13] Permission denied 解決方案詳解)