這是我想出的解決方案。謝謝@mprat的幫助。在
我發現spectralcolormap最適合這種任務,而且
我還添加了您可以指定的邊框。在from matplotlib import pyplot
import numpy as np
border = 2
images_amount = 300
row_amount = 10
col_amount = 30
image_height = 28
image_width = 28
all_filter_image = np.zeros((row_amount*image_height + border*row_amount,
col_amount*image_width + border*col_amount))
for filter_num in range(images_amount):
start_row = image_height*(filter_num / col_amount) +\
(filter_num / col_amount + 1)*border
end_row = start_row + image_height
start_col = image_width*(filter_num % col_amount) +\
(filter_num % col_amount + 1)*border
end_col = start_col + image_width
all_filter_image[start_row:end_row, start_col:end_col] = \
all_filters[filter_num]
print start_row, end_row, start_col, end_col
pyplot.imshow(all_filter_image)
pyplot.axis('off')
pyplot.set_cmap('spectral')
pyplot.colorbar()
pyplot.savefig('repflds1.png')
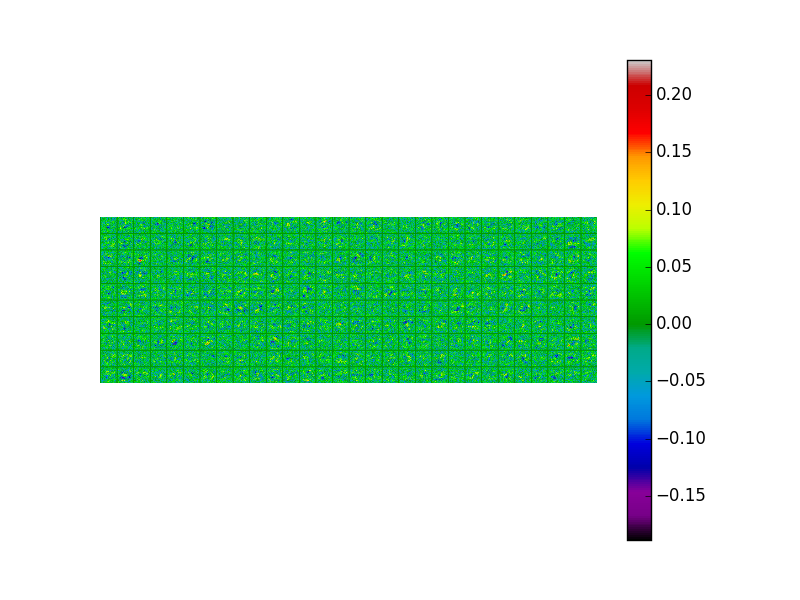
以下是一些用法示例:
不太訓練有素的網絡:
訓練有素的網絡:
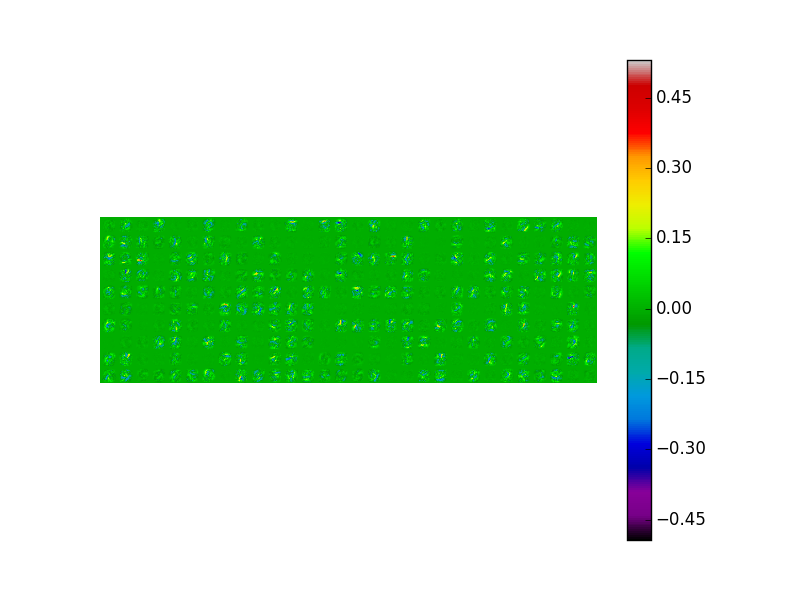
正如你所看到的,邊界使得區分一個過濾器(權重)和另一個過濾器變得非常容易。在
)

)

)


)


)

