場景
? ? ? ??
準備
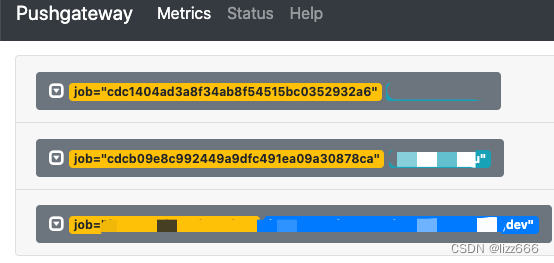
- prometheus已經部署pushgateway服務,訪問{pushgateway.server:9091}可以看到面板
實現
- 基于springboot引入支持組件,版本可以
<!--監控檢查--><dependency><groupId>org.springframework.boot</groupId><artifactId>spring-boot-starter-actuator</artifactId></dependency><dependency><groupId>io.micrometer</groupId><artifactId>micrometer-registry-prometheus</artifactId><version>1.5.14</version></dependency><dependency><groupId>io.prometheus</groupId><artifactId>simpleclient_pushgateway</artifactId><version>0.16.0</version></dependency>- 開啟配置
management:endpoints:web:exposure:# 暴露監控接口,*為全部接口include: '*'# 不暴露接口# exclude: 'info'metrics: #是否在內存中保存監控統計數據export:simple:enabled: false # 關閉內存中計算指標prometheus:enabled: true # 開啟prometheus上傳pushgateway: ## 配置pushgateway信息enabled: true # 開啟pushgateway上傳base-url: http://10.111.11.111:9091 # 配置pushgateway服務地址job: ${spring.application.name} # 配置pushgateway服務地址grouping-key:instance: ${spring.application.name}:${spring.profiles.active}lable1: labelValue1 # 自定義tagpush-rate: 10s #上傳數據間隔
?效果
? ? ? ? ?在pushgateway面板中會顯示新增的服務,在prometheus中也可能看到采集的數據


(二))


---火災報警線程封裝)

