visual studio是個強大的集成開發環境,內置了程序性能診斷工具。下面通過兩段代碼進行介紹。
?


static void Main( string[] args){Test1();Test2();Console.ReadKey();}protected static void Test1(){Stopwatch sp = new Stopwatch();sp.Start();string str = "" ;for (int i = 0; i < 100; i++){for (int j = 0; j < 100; j++){str += "string append1= " ;str += i.ToString() + " ";str += "string append2= " ;str += j.ToString() + " ";}}sp.Stop();Console.WriteLine("Test1 Time={0}" , sp.Elapsed.ToString());}protected static void Test2(){Stopwatch sp = new Stopwatch();sp.Start();StringBuilder str = new StringBuilder();for (int i = 0; i < 100; i++){for (int j = 0; j < 100; j++){str.Append( "string append1= " );str.Append(i.ToString());str.Append( "string append2=" );str.Append(j.ToString());}}sp.Stop();Console.WriteLine("Test2 Time={0}" , sp.Elapsed.ToString());}
先運行一下查看運行結果如下: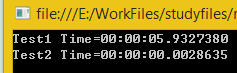
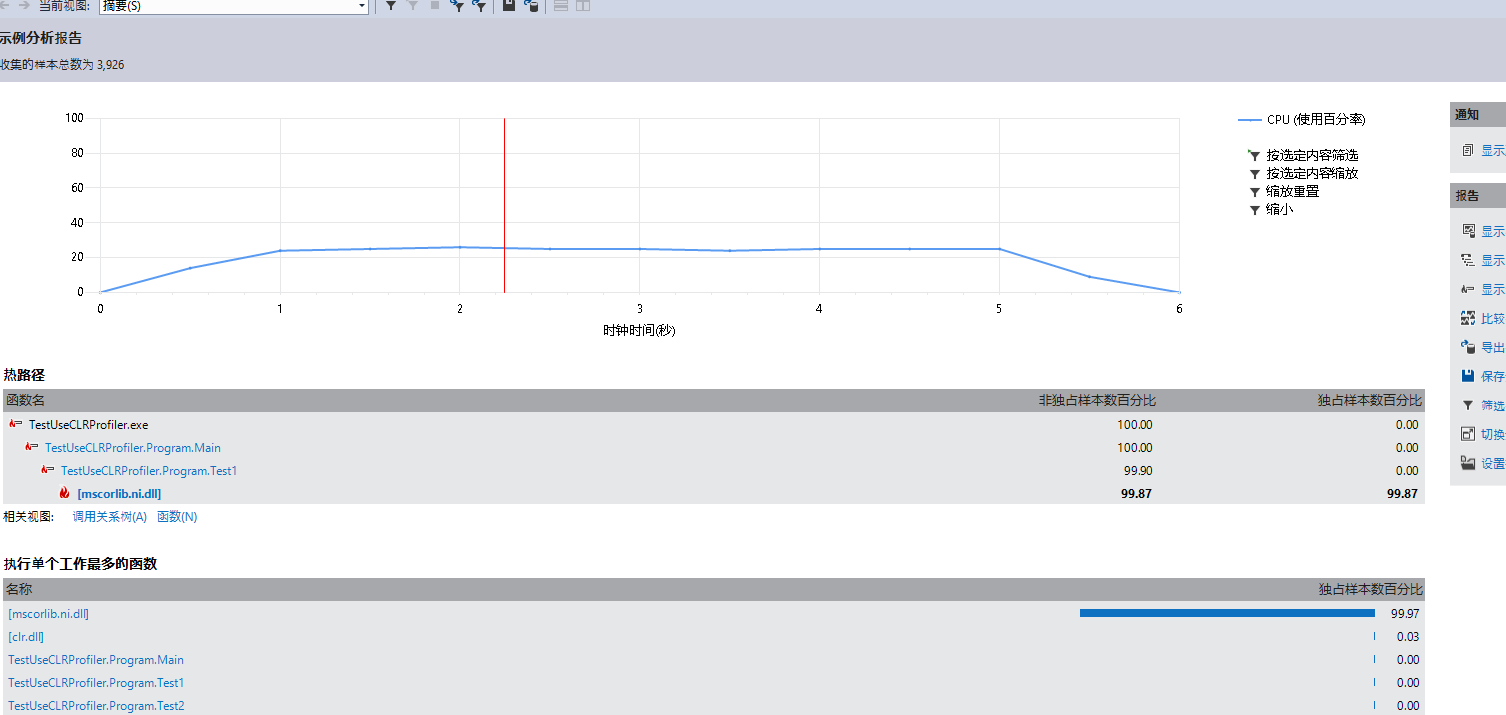
兩個函數實現的功能都一樣,實現方式不一樣,效率卻完全不一樣,下面通過vs自帶的性能分析工具進行分析,可以分析出程序對cpu使用率和內存使用情況等,
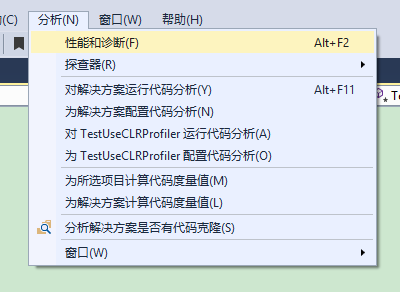
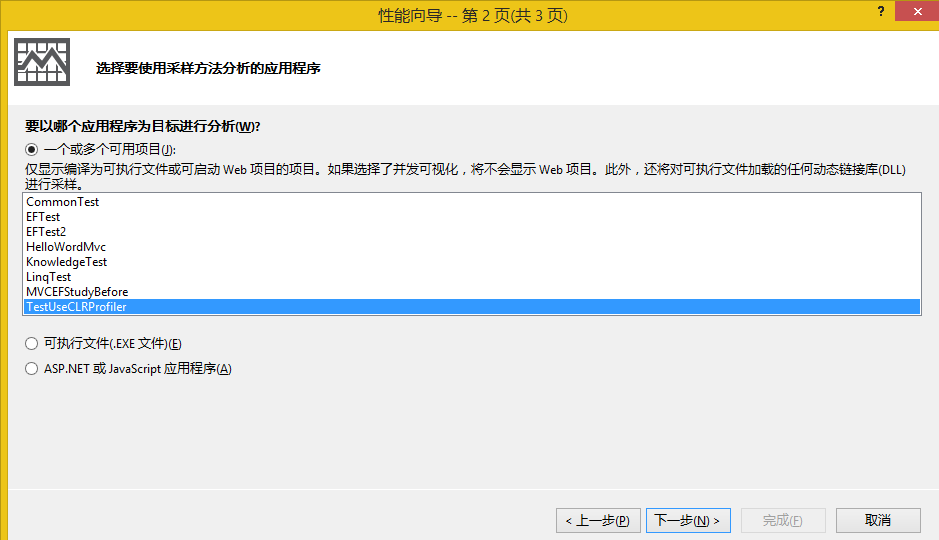
本次以cpu測試為例。
注:本次測試用的是vs2013,在vs2010里為啟動性能向導。

?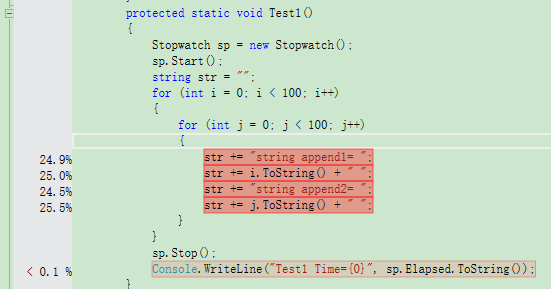
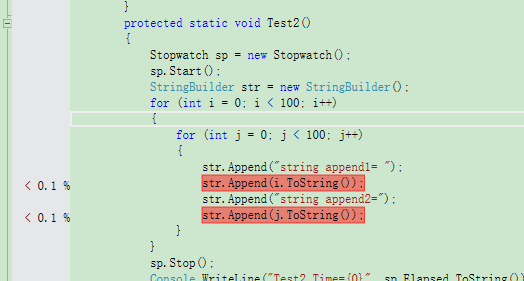
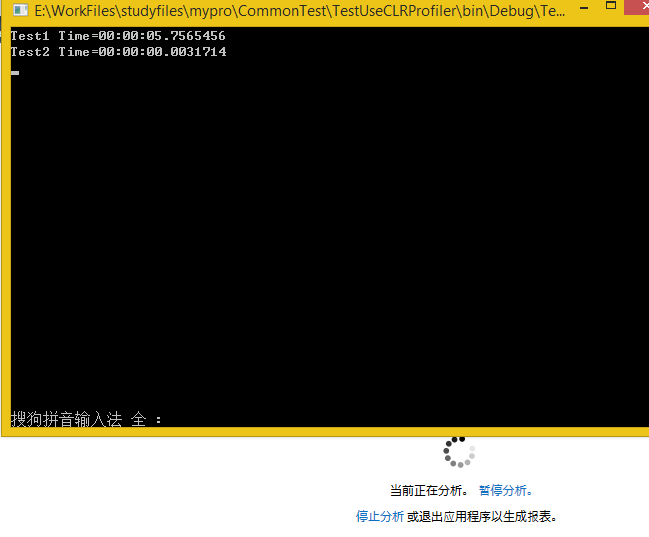
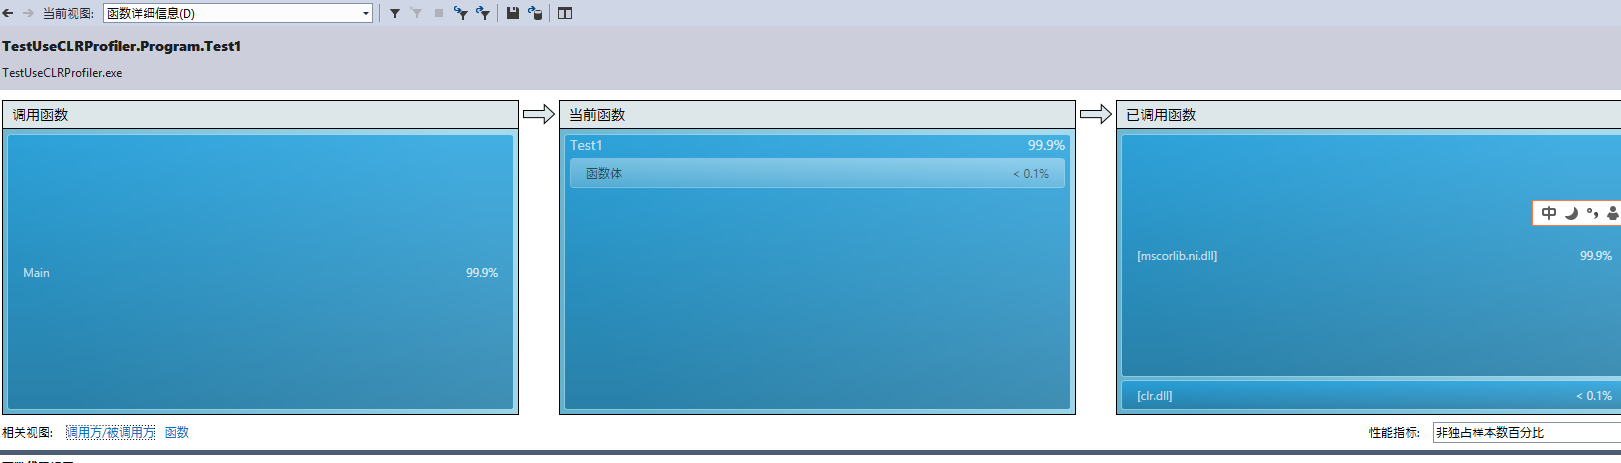
從以上分析結果可以得出對函數內部具體代碼的的cpu使用情況,由此在實際開發中,可以針對某個代碼單獨拿出進行分析,以找出消耗cpu的地方,
加以改進從而提高程序的效率。
性能診斷工具還有不少,如微軟的CLR Profiler,還有WinDbg等,后續的博客會對這兩個工具作介紹。
?

)


)


![[LeetCode]--71. Simplify Path](http://pic.xiahunao.cn/[LeetCode]--71. Simplify Path)


