流式數據分析
The recent years have seen a considerable rise in connected devices such as IoT [1] devices, and streaming sensor data. At present there are billions of IoT devices connected to the internet. While you read this article, terabytes and petabytes of IoT data will be generated across the world. This data contains a huge amount of information and insights. However, processing such high volumes of streaming data is a challenge, and it requires advanced BigData capabilities to manage these challenges and derive insights from this data.
近年來,諸如IoT [1]設備之類的連接設備以及流式傳感器數據有了顯著增長。 目前,有數十億物聯網設備連接到互聯網。 當您閱讀本文時,將在全球范圍內生成TB和PB的IoT數據。 這些數據包含大量信息和見解。 但是,處理如此大量的流數據是一個挑戰,它需要高級BigData功能來管理這些挑戰并從這些數據中獲取見解。
At AlgoAnalytics, we have developed a powerful tool which ingests real time streaming data feeds (for example from IoT devices) to enable visualization and analytics for quicker business decisions.
在AlgoAnalytics ,我們開發了一個功能強大的工具,可提取實時流數據饋送(例如,從IoT設備獲取),以實現可視化和分析,以便更快地做出業務決策。
The four steps involved underneath Streaming Big Data Analytics are as follows :
流式大數據分析所涉及的四個步驟如下:
The high level design of Streaming Big Data Analytics pipeline is illustrated in Figure 1.
圖1顯示了Streaming Big Data Analytics管道的高級設計。
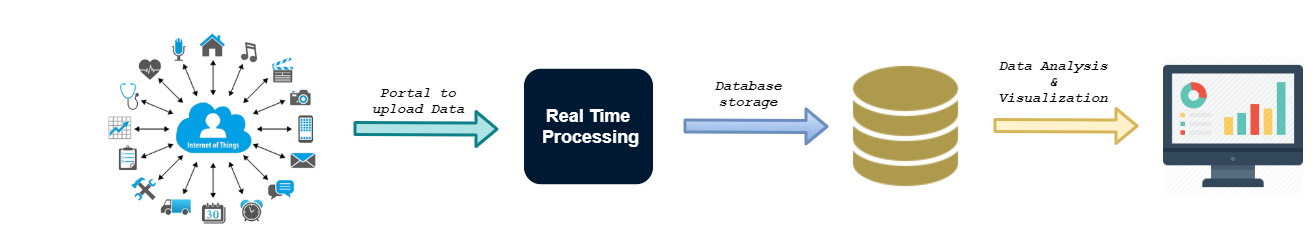
Data Ingestion:
數據提取:
Data ingestion involves gathering data from various streaming sources (e.g. IoT sensors) and transporting them to a common data store. This essentially is transforming unstructured data from origin to a system where it can be stored for further processing. Data comes from various sources, in various formats and at various speeds. It is a critical task to ingest complete data into the pipeline without any failure.
數據攝取涉及從各種流媒體源(例如IoT傳感器)收集數據并將其傳輸到公共數據存儲。 這實質上是將非結構化數據從原始數據轉換為可以存儲數據以進行進一步處理的系統。 數據來自各種來源,格式和速度各異。 將完整的數據攝取到管道中而沒有任何失敗是至關重要的任務。
For Data Ingestion, we have used Apache Kafka [2]- a distributed messaging system which fulfills all the above requirements. We have built a high scalable fault tolerant multi-node kafka cluster which can process thousands of messages per second without any data loss and down time. Kafka Producer collects data from various sources and publishes data to different topics accordingly. Kafka Consumer consumes this data from the topics in which they are interested in.This way data from different sources is ingested in the pipeline for processing.
對于數據提取,我們使用了Apache Kafka [2]-一種滿足所有上述要求的分布式消息傳遞系統。 我們建立了一個高度可擴展的容錯多節點kafka集群,該集群可以每秒處理數千條消息,而不會造成任何數據丟失和停機時間。 Kafka Producer從各種來源收集數據,并相應地將數據發布到不同的主題。 Kafka Consumer從他們感興趣的主題中消費此數據。這樣,來自不同來源的數據就會被吸收到管道中進行處理。
2. Real Time Data Processing:
2.實時數據處理:
The data collected in the above step needs to be processed in real time before pushing it to any filesystem or database. This includes transforming unstructured data to structured data. Processing includes filtering, mapping, conversion of data types, removing unwanted data, generating simplified data from complex data,etc
在將上一步中收集的數據推送到任何文件系統或數據庫之前,需要對其進行實時處理。 這包括將非結構化數據轉換為結構化數據。 處理包括過濾,映射,數據類型轉換,刪除不需要的數據,從復雜數據生成簡化數據等。
For this step we have used Spark Streaming [3] which is the best combination with Apache Kafka to build real time applications. Spark Streaming is an extension of the core Spark API that enables scalable, high-throughput, fault-tolerant stream processing of live data streams. Spark Streaming receives the data ingested through kafka and converts it into continuous stream of RDDs — DStreams (basic abstraction in spark streaming). Various spark transformations are applied on these DStreams to transform the data to the state from where it can be pushed to the database.
在這一步中,我們使用了Spark Streaming [3],它是與Apache Kafka的最佳組合,用于構建實時應用程序。 Spark Streaming是核心Spark API的擴展,可實現實時數據流的可擴展,高吞吐量,容錯流處理。 Spark Streaming接收通過kafka提取的數據,并將其轉換為RDD的連續流-DStreams(Spark流中的基本抽象)。 在這些DStream上應用了各種spark轉換,以將數據轉換到可以將其推送到數據庫的狀態。
3. Data Storage:
3.數據存儲:
The data received from source devices (such as IoT devices) is time-series data — measurements or events that are tracked, monitored, downsampled, and aggregated over time. Properties that make time series data very different from other data workloads are data lifecycle management, summarization, and large range scans of many records. A time series database (TSDB) [4] is a database optimized for such time-stamped or time series data with time as a key index which is distinctly different from relational databases . A time-series database lets you store large volumes of time stamped data in a format that allows fast insertion and fast retrieval to support complex analysis on that data.
從源設備(例如IoT設備)接收的數據是時間序列數據 -隨時間跟蹤,監視,下采樣和聚合的測量或事件。 使時間序列數據與其他數據工作負載非常不同的屬性是數據生命周期管理,摘要和許多記錄的大范圍掃描。 時間序列數據庫(TSDB) [4]是針對時間標記或時間序列數據進行優化的數據庫,其中時間作為關鍵索引,與關系數據庫明顯不同。 時間序列數據庫允許您以允許快速插入和快速檢索的格式存儲大量帶時間戳的數據,以支持對該數據進行復雜的分析。
Influxdb [5] is one such time-series database designed to handle such high write and query loads. We have set up a multi node influxdb cluster which can handle millions of writes per second and also in-memory indexing of influxdb allows fast and efficient query results. We have also set up various continuous tasks which downsample the data to lower precision, summarized data which can be kept for a longer period of time or forever. It reduces the size of data that needs to be stored as well as the query time by multiple times as compared with very high precision data.
Influxdb [5]是一種此類時間序列數據庫,旨在處理如此高的寫入和查詢負載。 我們已經建立了一個多節點的influxdb集群,該集群可以每秒處理數百萬次寫入,并且influxdb的內存索引可以實現快速,有效的查詢結果。 我們還設置了各種連續任務,這些任務會將數據降采樣到較低的精度,匯總的數據可以保留更長的時間或永遠。 與非常高精度的數據相比,它可以將需要存儲的數據大小以及查詢時間減少多次。
4. Visualization:
4.可視化:
To add value to this processed data it is necessary to visualize our data and make some relations between them. Data visualization and analytics provide more control over data and give us the power to control this data efficiently.
為了給處理后的數據增加價值,有必要使我們的數據可視化并在它們之間建立某種關系。 數據可視化和分析可提供對數據的更多控制,并使我們能夠有效地控制此數據。
We used Grafana [6], a multi-platform open source analytics and interactive visualization web application. It provides charts, graphs, and alerts for the web when connected to supported data sources. We have created multiple dashboards for different comparisons. On these dashboards, we can visualize real time status as well as the historical data (weeks, months or even years). We can also compare data of the same type with different parameters. Several variables are defined which provide flexibility to use dashboards for multiple visualizations. For example, we can select a single device or multiple devices or even all devices at a time. We can select how to aggregate data per minute, per hour to per year.
我們使用了Grafana [6],這是一個多平臺的開源分析和交互式可視化Web應用程序。 當連接到受支持的數據源時,它會為Web提供圖表,圖形和警報。 我們創建了多個儀表盤用于不同的比較。 在這些儀表板上,我們可以可視化實時狀態以及歷史數據(幾周,幾個月甚至幾年)。 我們還可以將具有不同參數的相同類型的數據進行比較。 定義了幾個變量,這些變量可靈活使用儀表板進行多個可視化。 例如,我們可以一次選擇一個或多個設備,甚至所有設備。 我們可以選擇如何每分鐘,每小時和每年匯總數據。
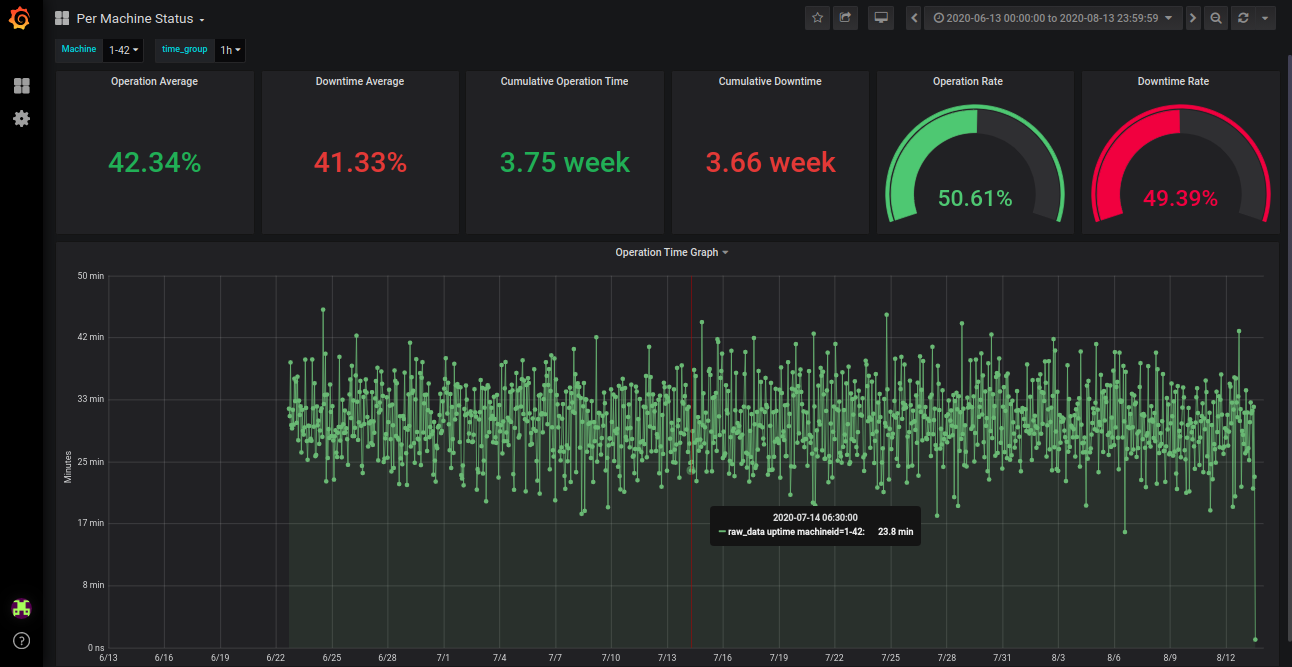
Figure 2 shows the Uptime and some parameters of a selected machine for a selected period (2 months).
圖2顯示了選定時間段(2個月)內選定機器的正常運行時間和一些參數。
Applications :
應用范圍 :
As a large number of businesses in multiple sectors are moving to connected and smart devices, Streaming Big Data Analytics finds its applications across many verticals.
隨著多個領域的眾多企業正在轉向互聯和智能設備,Streaming Big Data Analytics在許多垂直領域都可以找到其應用程序。
Few examples include real time machine monitoring and anomaly detection in industries, sensor embedded medical devices to understand emergencies in advance, surveillance using video analytics, in Retail and Logistics to increase sale by studying customer movements, in transport sector — smart traffic control, electronic toll collections systems, in Military for surveillance, Environmental monitoring — air quality, soil conditions, movement of wildlife, etc
很少有這樣的例子:行業中的實時機器監控和異常檢測,傳感器嵌入式醫療設備可以提前了解緊急情況,零售和物流中使用視頻分析進行監控,通過研究運輸行業的客戶動向來提高銷售量,例如交通領域,智能交通控制,電子通行費軍事上用于監視,環境監測的采集系統-空氣質量,土壤條件,野生動植物的移動等
For further information, please contact: info@algoanalytics.com
欲了解更多信息,請聯系:info@algoanalytics.com
IoT : https://en.wikipedia.org/wiki/Internet_of_things
物聯網 https://zh.wikipedia.org/wiki/Internet_of_things
Apache Kafka : https://kafka.apache.org/documentation/#gettingStarted
Apache Kafka: https : //kafka.apache.org/documentation/#gettingStarted
Spark Streaming : https://spark.apache.org/docs/latest/streaming-programming-guide.html
火花流: https : //spark.apache.org/docs/latest/streaming-programming-guide.html
Time Series Database : https://www.influxdata.com/time-series-database/
時間序列數據庫: https : //www.influxdata.com/time-series-database/
InfluxDB : https://www.influxdata.com/products/influxdb-overview/
InfluxDB: https : //www.influxdata.com/products/influxdb-overview/
Grafana : https://grafana.com/docs/
Grafana: https ://grafana.com/docs/
翻譯自: https://medium.com/algoanalytics/streaming-big-data-analytics-d4311ed20581
流式數據分析
本文來自互聯網用戶投稿,該文觀點僅代表作者本人,不代表本站立場。本站僅提供信息存儲空間服務,不擁有所有權,不承擔相關法律責任。 如若轉載,請注明出處:http://www.pswp.cn/news/388614.shtml 繁體地址,請注明出處:http://hk.pswp.cn/news/388614.shtml 英文地址,請注明出處:http://en.pswp.cn/news/388614.shtml
如若內容造成侵權/違法違規/事實不符,請聯系多彩編程網進行投訴反饋email:809451989@qq.com,一經查實,立即刪除!相關文章

oracle failover 區別,Oracle DG failover 實戰

Jenkins自動化CI CD流水線之8--流水線自動化發布Java項目

oracle數據泵導入很慢,impdp導入效率的問題
)
BZOJ2597 WC2007剪刀石頭布(費用流)

數據科學還是計算機科學_數據科學101
)
開機流程與主引導分區(MBR)

膚色檢測算法 - 基于二次多項式混合模型的膚色檢測。

oracle解析儒略日,利用to_char獲取當前日期準確的周數!


js有默認參數的函數加參數_函數參數:默認,關鍵字和任意


oracle raise_application_error,RAISE_ APPLICATION_ ERROR--之異常處理


2018大數據學習路線從入門到精通

相似鄰里算法_紐約市-鄰里之戰

![[poj 1364]King[差分約束詳解(續篇)][超級源點][SPFA][Bellman-Ford]](http://pic.xiahunao.cn/[poj 1364]King[差分約束詳解(續篇)][超級源點][SPFA][Bellman-Ford])
[poj 1364]King[差分約束詳解(續篇)][超級源點][SPFA][Bellman-Ford]

linux質控命令,Linux下microRNA質控-cutadapt安裝

采用多播傳送FIX行情數據的推薦方案
