研究背景
1、之所以選用kafka是因為量起來的話單臺logstash的抗壓能力比較差
2、為了解決整個鏈路查詢的問題,多個Feign傳層的話,可以按照一個ID進行穿層,所以采用logback的MDC進行對唯一標識存儲并且在Feign的調用鏈放在Header里,這里命名為TID
下載地址:
ZK+Kafka
https://mirrors.bfsu.edu.cn/apache/kafka/2.7.0/kafka_2.13-2.7.0.tgz
https://mirrors.bfsu.edu.cn/apache/zookeeper/zookeeper-3.7.0/apache-zookeeper-3.7.0-bin.tar.gz
ELK
https://artifacts.elastic.co/downloads/kibana/kibana-7.12.0-windows-x86_64.zip
https://artifacts.elastic.co/downloads/elasticsearch/elasticsearch-7.12.0-windows-x86_64.zip
https://artifacts.elastic.co/downloads/logstash/logstash-7.12.0-windows-x86_64.zip
?
在攔截器里增加相對應的攔截代碼
@Component
@Slf4j
public class ContextInterceptor implements HandlerInterceptor {RequestContext context = RequestContext.getCurrentContext();context.reset();log.debug("traceId:" + MDC.get("traceId"));String requestId = MDC.get("traceId");requestId = StringUtils.isEmpty(requestId) ? request.getHeader(RequestContext.REQUEST_ID) : requestId;requestId = StringUtils.isEmpty(requestId) ? request.getParameter(RequestContext.REQUEST_ID) : requestId;requestId = StringUtils.isEmpty(requestId) ? UUIDUtil.uuid() : requestId;MDC.put("TID", requestId);}
配置日志配置文件logback-spring.xml
<?xml version="1.0" encoding="UTF-8"?>
<configuration><!-- springProfile用于指定當前激活的環境,如果spring.profile.active的值是哪個,就會激活對應節點下的配置 --><springProfile name="local"><!-- configuration to be enabled when the "staging" profile is active --><springProperty scope="context" name="module" source="spring.application.name"defaultValue="undefinded"/><!-- 該節點會讀取Environment中配置的值,在這里我們讀取application.yml中的值 --><springProperty scope="context" name="bootstrapServers" source="spring.kafka.bootstrap-servers"defaultValue="127.0.0.1:9092"/><appender name="STDOUT" class="ch.qos.logback.core.ConsoleAppender"><!-- encoders are assigned the typech.qos.logback.classic.encoder.PatternLayoutEncoder by default --><encoder><pattern>%boldYellow(${module})|%d|%highlight(%-5level)|%X{TID}|%cyan(%logger{15}) - %msg %n</pattern></encoder></appender><!-- kafka的appender配置 --><appender name="kafka" class="com.github.danielwegener.logback.kafka.KafkaAppender"><encoder><pattern>${module}|%d|%-5level|%X{TID}|%logger{15} - %msg</pattern></encoder><topic>test</topic><keyingStrategy class="com.github.danielwegener.logback.kafka.keying.NoKeyKeyingStrategy"/><deliveryStrategy class="com.github.danielwegener.logback.kafka.delivery.AsynchronousDeliveryStrategy"/><!-- Optional parameter to use a fixed partition --><!-- <partition>0</partition> --><!-- Optional parameter to include log timestamps into the kafka message --><!-- <appendTimestamp>true</appendTimestamp> --><!-- each <producerConfig> translates to regular kafka-client config (format: key=value) --><!-- producer configs are documented here: https://kafka.apache.org/documentation.html#newproducerconfigs --><!-- bootstrap.servers is the only mandatory producerConfig --><producerConfig>bootstrap.servers=${bootstrapServers}</producerConfig><!-- 如果kafka不可用則輸出到控制臺 --><appender-ref ref="STDOUT"/></appender><!-- 指定項目中的logger --><!--<logger name="org.springframework.test" level="INFO" ><appender-ref ref="kafka" /></logger>--><logger name="com.springcloudsite" level="INFO" ><appender-ref ref="kafka" /></logger><root level="info"><appender-ref ref="STDOUT" /></root></springProfile>
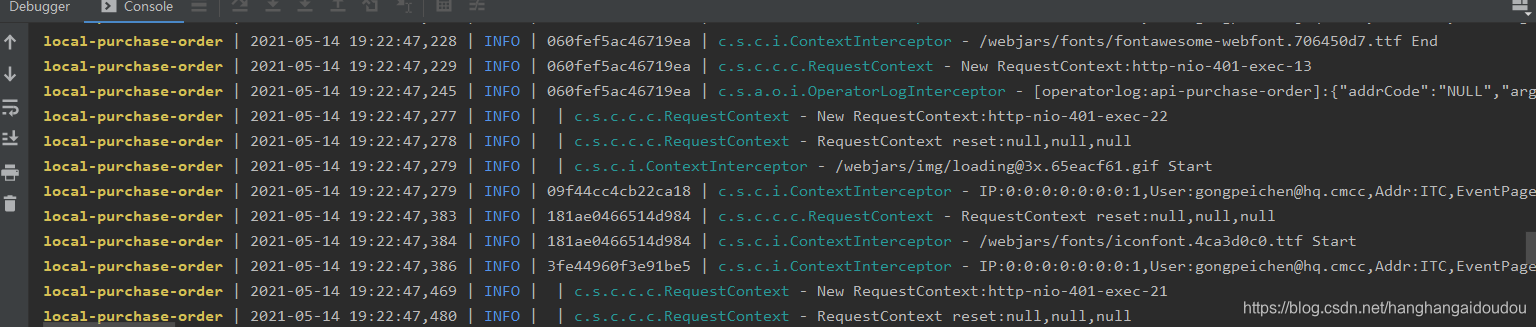
</configuration>正則配置說明? ??
? ? pattern:為正則表達
? ? %boldYellow(${module}) : 黃色的模塊名稱
? ? %d :日期時間
? ?%highlight(%-5level):高亮的日志級別,如info error trace登
? ?%X{TID} : traceID 追蹤使用的ID
? ?%cyan(%logger{15}) :簡寫類名路徑
? %msg %n :具體日志信息
打印出來的效果如下:
?
配置zk+kafka
1. 安裝JDK
1.1 安裝文件:http://www.oracle.com/technetwork/java/javase/downloads/index.html 下載JDK
1.2 安裝完成后需要添加以下的環境變量(右鍵點擊“我的電腦” -> "高級系統設置" -> "環境變量"?):
- JAVA_HOME:?C:\Program Files\Java\jdk1.8.0_171 (jdk的安裝路徑)
- Path: 在現有的值后面添加"; %JAVA_HOME%\bin"
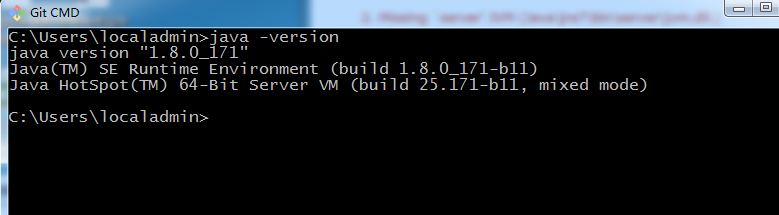
1.3 打開cmd運行 "java -version" 查看當前系統Java的版本:
2. 安裝ZOOKEEPER
Kafka的運行依賴于Zookeeper,所以在運行Kafka之前我們需要安裝并運行Zookeeper
2.1 下載安裝文件:?http://zookeeper.apache.org/releases.html
2.2 解壓文件?
2.3 打開zookeeper-3.4.13\conf,把zoo_sample.cfg重命名成zoo.cfg
2.4 從文本編輯器里打開zoo.cfg
2.5 把dataDir的值改成“./zookeeper-3.4.13/data”
2.6 添加如下系統變量:
- ZOOKEEPER_HOME: C:\Users\localadmin\CODE\zookeeper-3.4.13 (zookeeper目錄)
- Path: 在現有的值后面添加 ";%ZOOKEEPER_HOME%\bin;"
2.7 運行Zookeeper: 打開cmd然后執行 zkserver

cmd 窗口不要關閉
3. 安裝并運行KAFKA
3.1 下載安裝文件:?http://kafka.apache.org/downloads.html
3.2 解壓文件
3.3 打開kafka_2.11-2.0.0\config
3.4 從文本編輯器里打開 server.properties
3.5 把 log.dirs的值改成?“./logs”
3.6 打開cmd
3.7 進入kafka文件目錄: cd?C:\Users\localadmin\CODE\kafka_2.11-2.0.0(kafka目錄)
3.8 輸入并執行:? .\bin\windows\kafka-server-start.bat .\config\server.properties
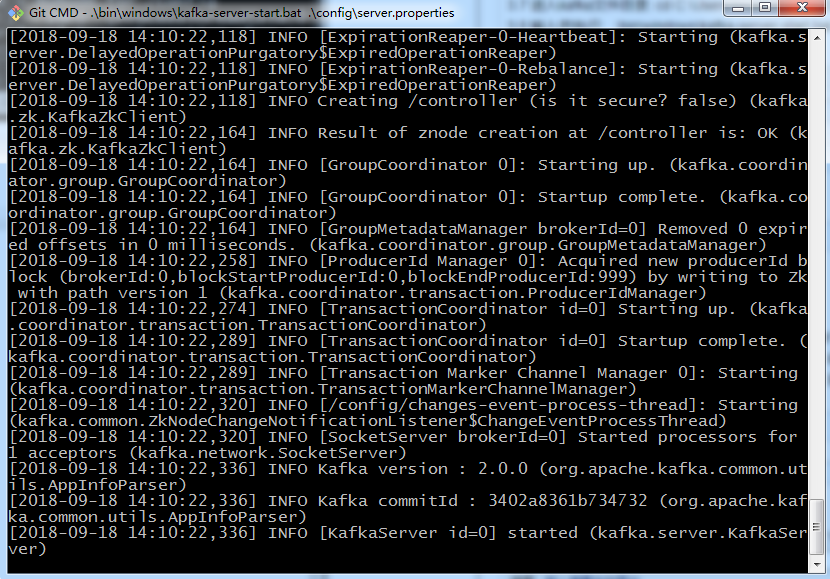
cmd 窗口不要關閉
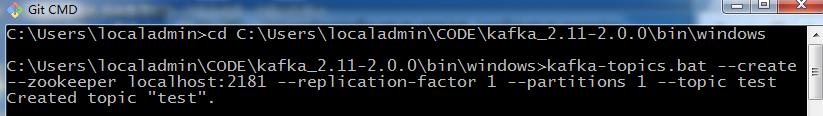
4. 創建TOPICS
4.1 打開cmd 并進入cd?C:\Users\localadmin\CODE\kafka_2.11-2.0.0\bin\windows
4.2 創建一個topic:?kafka-topics.bat --create --zookeeper localhost:2181 --replication-factor 1 --partitions 1 --topic test
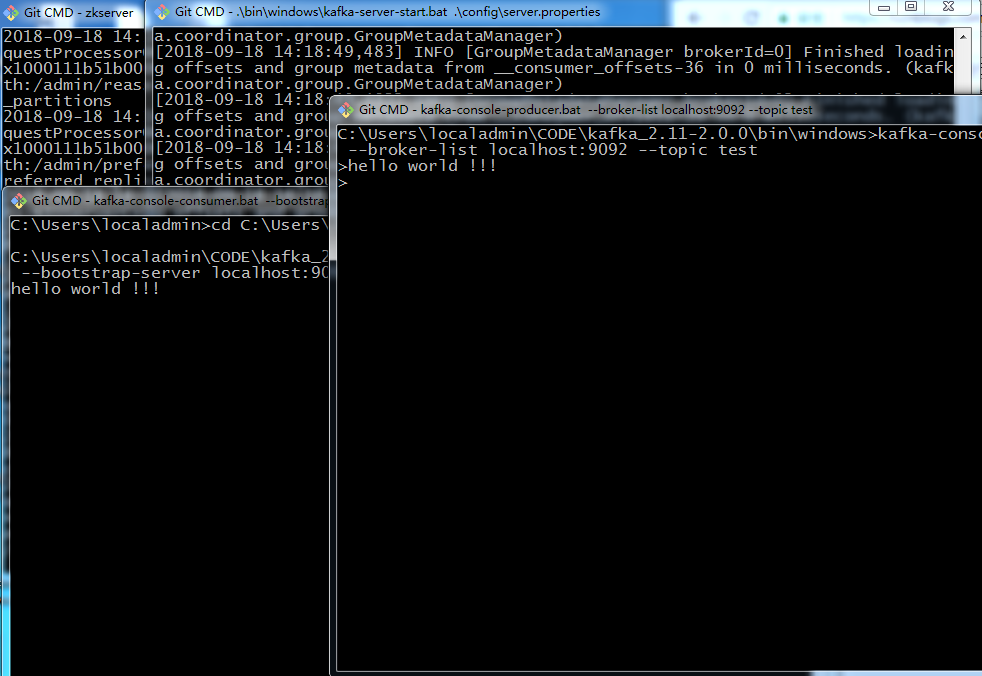
5. 打開一個PRODUCER:
cd C:\Users\localadmin\CODE\kafka_2.11-2.0.0\bin\windows
kafka-console-producer.bat --broker-list localhost:9092 --topic test
6. 打開一個CONSUMER:
cd?C:\Users\localadmin\CODE\kafka_2.11-2.0.0\bin\windows
kafka-console-consumer.bat --bootstrap-server localhost:9092 --topic test --from-beginning
7. 測試:
配置ELK
kibana.yml
# Kibana is served by a back end server. This setting specifies the port to use.
server.port: 5601# Specifies the address to which the Kibana server will bind. IP addresses and host names are both valid values.
# The default is 'localhost', which usually means remote machines will not be able to connect.
# To allow connections from remote users, set this parameter to a non-loopback address.
server.host: "localhost"# Enables you to specify a path to mount Kibana at if you are running behind a proxy.
# Use the `server.rewriteBasePath` setting to tell Kibana if it should remove the basePath
# from requests it receives, and to prevent a deprecation warning at startup.
# This setting cannot end in a slash.
#server.basePath: ""# Specifies whether Kibana should rewrite requests that are prefixed with
# `server.basePath` or require that they are rewritten by your reverse proxy.
# This setting was effectively always `false` before Kibana 6.3 and will
# default to `true` starting in Kibana 7.0.
#server.rewriteBasePath: false# Specifies the public URL at which Kibana is available for end users. If
# `server.basePath` is configured this URL should end with the same basePath.
#server.publicBaseUrl: ""# The maximum payload size in bytes for incoming server requests.
#server.maxPayloadBytes: 1048576# The Kibana server's name.  This is used for display purposes.
#server.name: "your-hostname"# The URLs of the Elasticsearch instances to use for all your queries.
elasticsearch.hosts: ["http://localhost:9200"]# Kibana uses an index in Elasticsearch to store saved searches, visualizations and
# dashboards. Kibana creates a new index if the index doesn't already exist.
#kibana.index: ".kibana"# The default application to load.
#kibana.defaultAppId: "home"# If your Elasticsearch is protected with basic authentication, these settings provide
# the username and password that the Kibana server uses to perform maintenance on the Kibana
# index at startup. Your Kibana users still need to authenticate with Elasticsearch, which
# is proxied through the Kibana server.
#elasticsearch.username: "kibana_system"
#elasticsearch.password: "pass"# Enables SSL and paths to the PEM-format SSL certificate and SSL key files, respectively.
# These settings enable SSL for outgoing requests from the Kibana server to the browser.
#server.ssl.enabled: false
#server.ssl.certificate: /path/to/your/server.crt
#server.ssl.key: /path/to/your/server.key# Optional settings that provide the paths to the PEM-format SSL certificate and key files.
# These files are used to verify the identity of Kibana to Elasticsearch and are required when
# xpack.security.http.ssl.client_authentication in Elasticsearch is set to required.
#elasticsearch.ssl.certificate: /path/to/your/client.crt
#elasticsearch.ssl.key: /path/to/your/client.key# Optional setting that enables you to specify a path to the PEM file for the certificate
# authority for your Elasticsearch instance.
#elasticsearch.ssl.certificateAuthorities: [ "/path/to/your/CA.pem" ]# To disregard the validity of SSL certificates, change this setting's value to 'none'.
#elasticsearch.ssl.verificationMode: full# Time in milliseconds to wait for Elasticsearch to respond to pings. Defaults to the value of
# the elasticsearch.requestTimeout setting.
#elasticsearch.pingTimeout: 1500# Time in milliseconds to wait for responses from the back end or Elasticsearch. This value
# must be a positive integer.
elasticsearch.requestTimeout: 30000# List of Kibana client-side headers to send to Elasticsearch. To send *no* client-side
# headers, set this value to [] (an empty list).
#elasticsearch.requestHeadersWhitelist: [ authorization ]# Header names and values that are sent to Elasticsearch. Any custom headers cannot be overwritten
# by client-side headers, regardless of the elasticsearch.requestHeadersWhitelist configuration.
#elasticsearch.customHeaders: {}# Time in milliseconds for Elasticsearch to wait for responses from shards. Set to 0 to disable.
#elasticsearch.shardTimeout: 30000# Logs queries sent to Elasticsearch. Requires logging.verbose set to true.
#elasticsearch.logQueries: false# Specifies the path where Kibana creates the process ID file.
#pid.file: /run/kibana/kibana.pid# Enables you to specify a file where Kibana stores log output.
#logging.dest: stdout# Set the value of this setting to true to suppress all logging output.
#logging.silent: false# Set the value of this setting to true to suppress all logging output other than error messages.
#logging.quiet: false# Set the value of this setting to true to log all events, including system usage information
# and all requests.
#logging.verbose: false# Set the interval in milliseconds to sample system and process performance
# metrics. Minimum is 100ms. Defaults to 5000.
#ops.interval: 5000# Specifies locale to be used for all localizable strings, dates and number formats.
# Supported languages are the following: English - en , by default , Chinese - zh-CN .
#i18n.locale: "en"
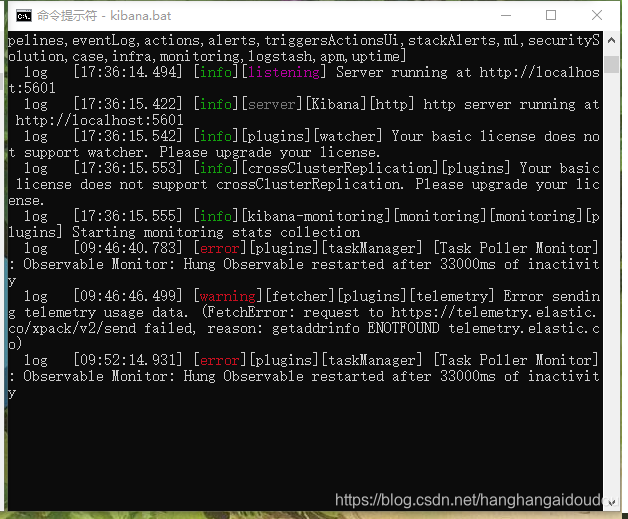
然后到對應bin目錄下啟動,直接點擊?kibana.bat啟動即可,或者在CMD命令啟動
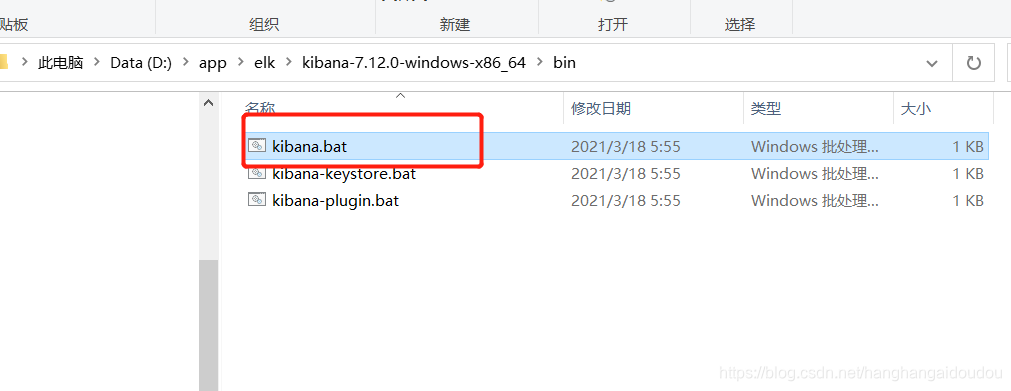
之后是啟動效果
配置elasticsearch.yml
# ======================== Elasticsearch Configuration =========================
#
# NOTE: Elasticsearch comes with reasonable defaults for most settings.
#       Before you set out to tweak and tune the configuration, make sure you
#       understand what are you trying to accomplish and the consequences.
#
# The primary way of configuring a node is via this file. This template lists
# the most important settings you may want to configure for a production cluster.
#
# Please consult the documentation for further information on configuration options:
# https://www.elastic.co/guide/en/elasticsearch/reference/index.html
#
# ---------------------------------- Cluster -----------------------------------
#
# Use a descriptive name for your cluster:
#
#cluster.name: my-application
#
# ------------------------------------ Node ------------------------------------
#
# Use a descriptive name for the node:
#
#node.name: node-1
#
# Add custom attributes to the node:
#
#node.attr.rack: r1
#
# ----------------------------------- Paths ------------------------------------
#
# Path to directory where to store the data (separate multiple locations by comma):
#
#path.data: /path/to/data
#
# Path to log files:
#
#path.logs: /path/to/logs
#
# ----------------------------------- Memory -----------------------------------
#
# Lock the memory on startup:
#
#bootstrap.memory_lock: true
#
# Make sure that the heap size is set to about half the memory available
# on the system and that the owner of the process is allowed to use this
# limit.
#
# Elasticsearch performs poorly when the system is swapping the memory.
#
# ---------------------------------- Network -----------------------------------
#
# By default Elasticsearch is only accessible on localhost. Set a different
# address here to expose this node on the network:
#
cluster.name: "docker-cluster"
node.name: "node-1"
node.master: true
network.host: 0.0.0.0#xpack.license.self_generated.type: trial
#xpack.security.enabled: true
#xpack.monitoring.collection.enabled: true #
# By default Elasticsearch listens for HTTP traffic on the first free port it
# finds starting at 9200. Set a specific HTTP port here:
#
http.port: 9200
#
# For more information, consult the network module documentation.
#
# --------------------------------- Discovery ----------------------------------
#
# Pass an initial list of hosts to perform discovery when this node is started:
# The default list of hosts is ["127.0.0.1", "[::1]"]
#
#discovery.seed_hosts: ["host1", "host2"]
#
# Bootstrap the cluster using an initial set of master-eligible nodes:
#
cluster.initial_master_nodes: ["node-1"]
#
# For more information, consult the discovery and cluster formation module documentation.
#
# ---------------------------------- Various -----------------------------------
#
# Require explicit names when deleting indices:
#
#action.destructive_requires_name: true
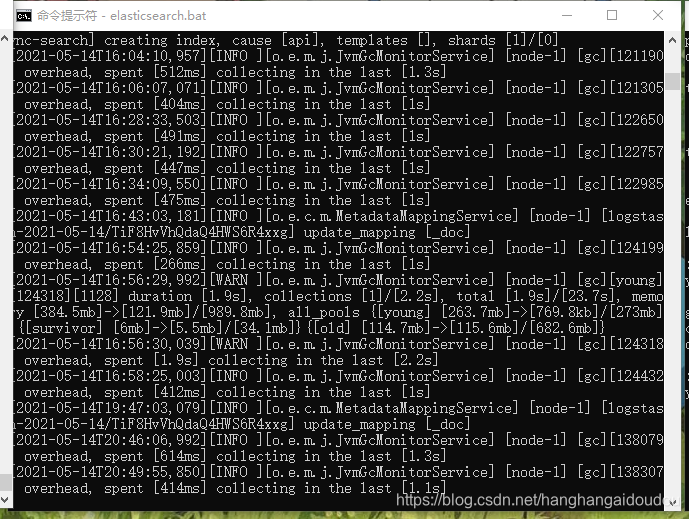
啟動bin目錄下的elasticsearch.bat
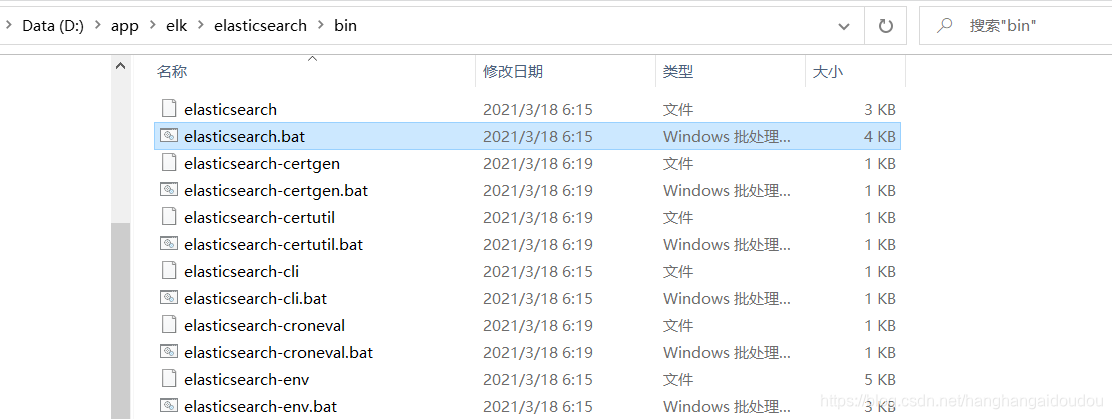
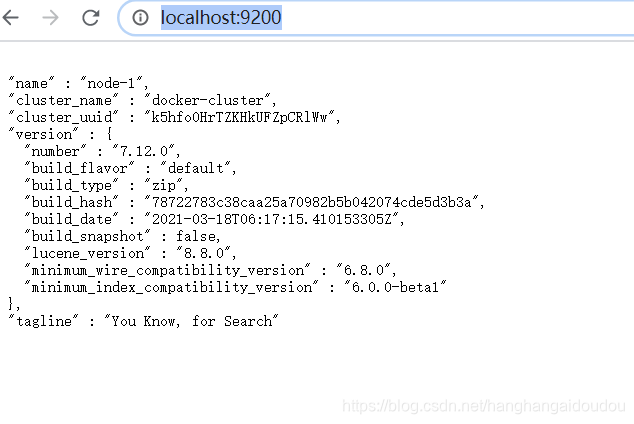
以下是啟動效果
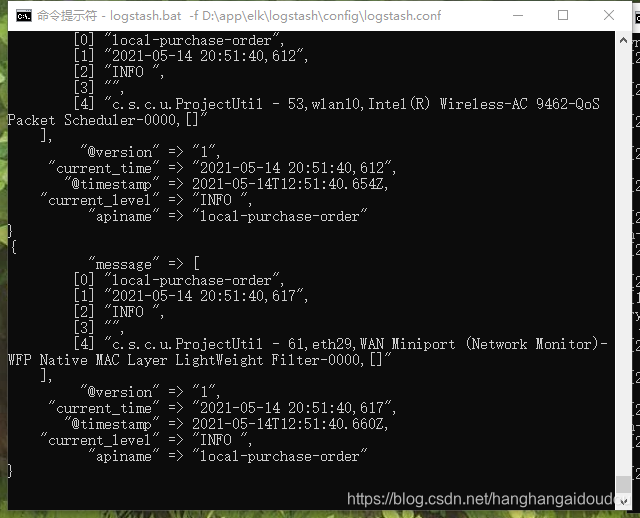
配置logstash.conf
# Sample Logstash configuration for creating a simple
# Beats -> Logstash -> Elasticsearch pipeline.input {kafka {bootstrap_servers => "localhost:9092"topics => ["test"]group_id => "test"}
}filter { mutate {split => { "message" => "|" }}if [message][0] {mutate {                add_field =>   {"apiname" => "%{[message][0]}"}}}if [message][1] {mutate {                add_field =>   {"current_time" => "%{[message][1]}"}}} if [message][2] {mutate {                add_field =>   {"current_level" => "%{[message][2]}"}}}  	if [message][3] {mutate {                add_field =>   {"traceid" => "%{[message][3]}"}}}}output {elasticsearch {hosts => ["http://localhost:9200"]#index => "local-purchase-order | %{+YYYY-MM-dd}"index => "logstash-%{+YYYY-MM-dd}"#template_name => "logstash"#template_overwrite => true#index => "%{[@metadata][beat]}-%{[@metadata][version]}-%{+YYYY.MM.dd}"#user => "elastic"#password => "changeme"}stdout{codec => rubydebug}
}
配置logstash.yml
#/usr/share/logstash/config/logstash.yml
#jvm.options  log4j2.properties  logstash-sample.conf  logstash.yml  pipelines.yml  startup.options
http.host: "0.0.0.0"
# [ "http://elasticsearch:9200" ]
xpack.monitoring.elasticsearch.hosts: ${ELASTICSEARCH_URL}
啟動使用命令
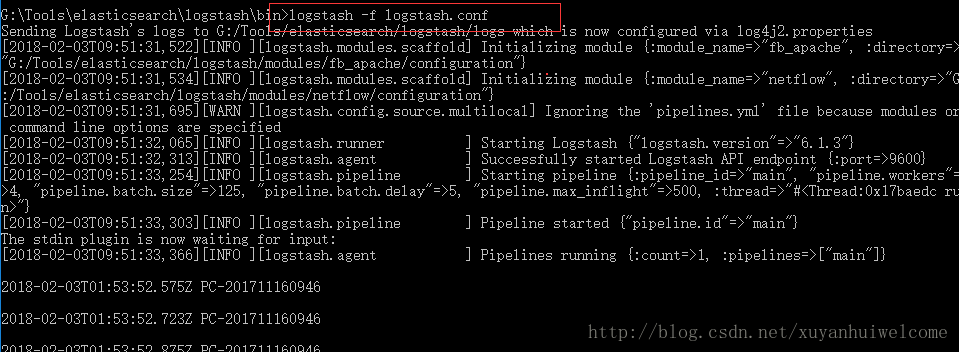
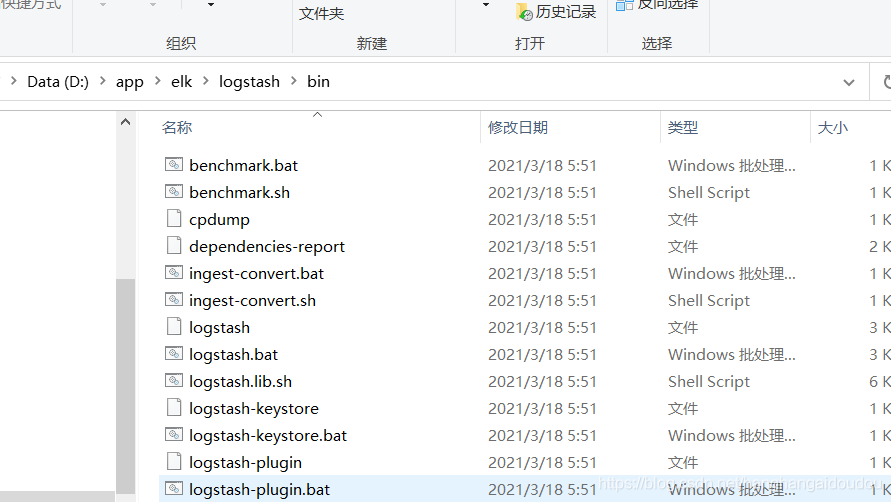
可以進到bin下
D:\app\elk\logstash\bin
輸入命令:logstash -f D:\app\elk\logstash\config\logstash.conf
最后打開地址
http://localhost:9600/
http://localhost:9200/
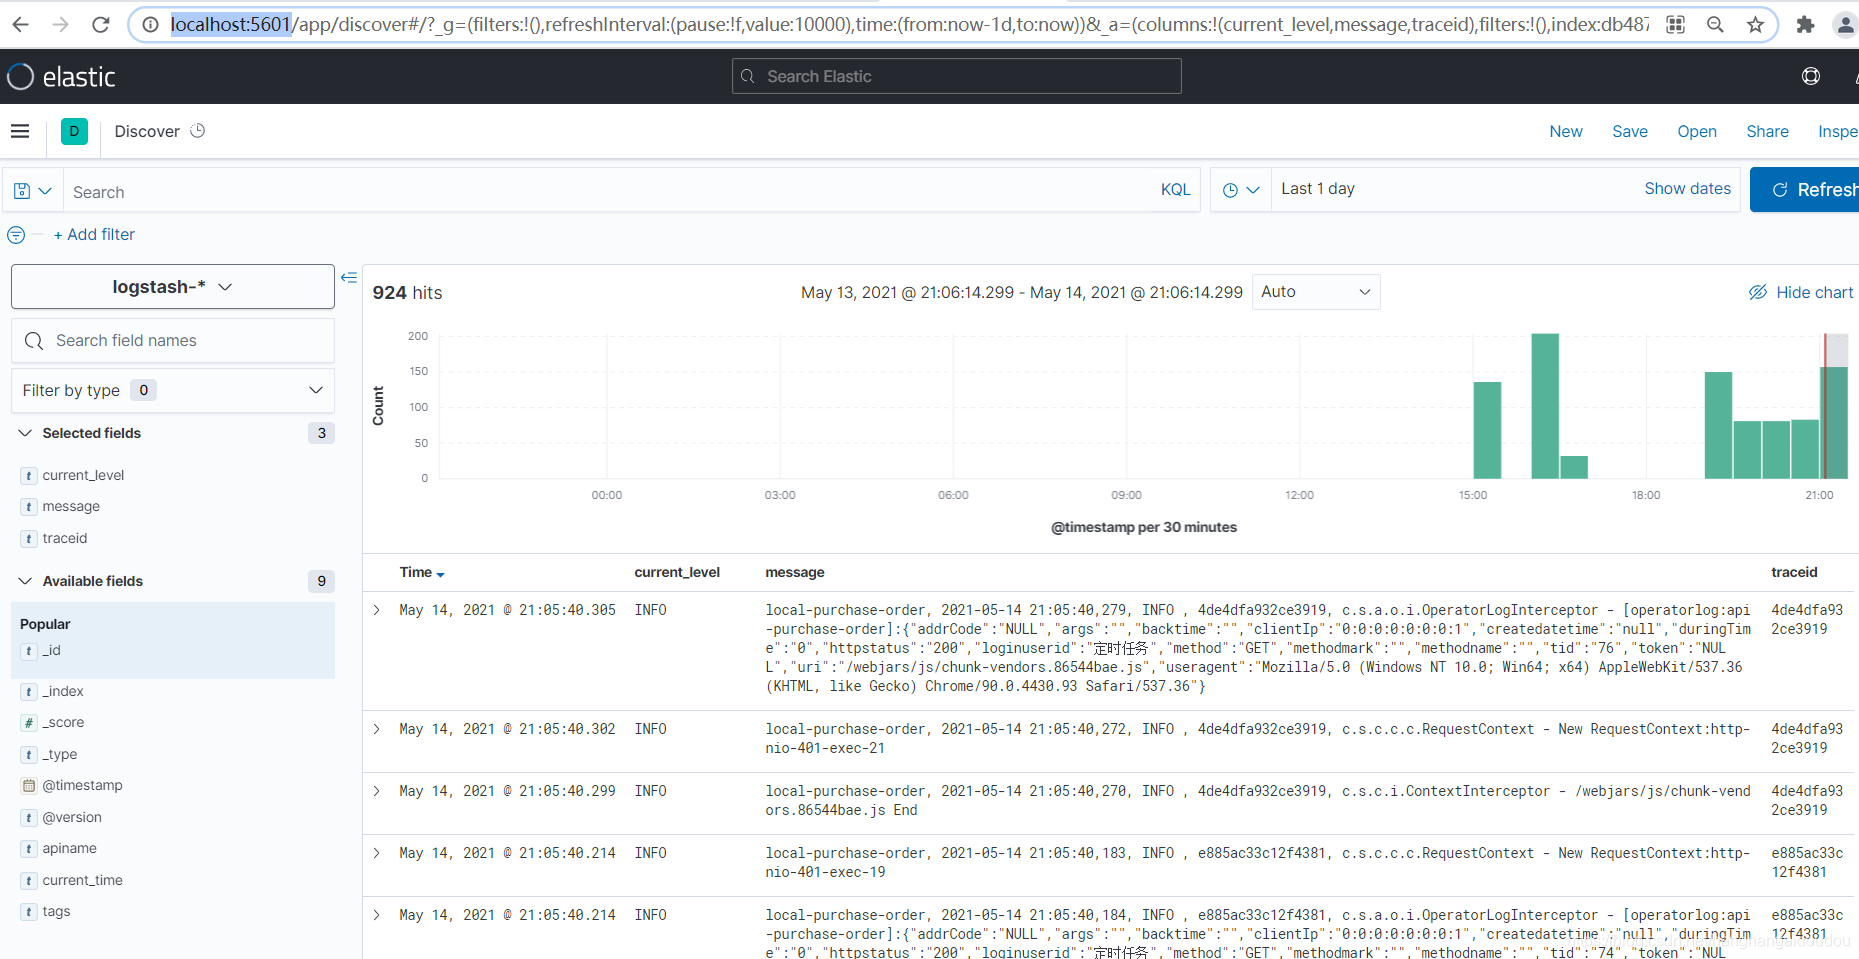
http://localhost:5601/
分別驗證結果

?
?
?


![Unity3D熱更新之LuaFramework篇[06]--Lua中是怎么實現腳本生命周期的](http://pic.xiahunao.cn/Unity3D熱更新之LuaFramework篇[06]--Lua中是怎么實現腳本生命周期的)


