IBM JVM概述
正如您可能從其他文章中看到的那樣,IBM JVM在某些方面與HotSpot JVM不同,因為它沒有PermGen內存空間。 從垃圾回收的角度來看,它確實為您提供了可以利用多物理核心計算機的高級算法; 與HotSpot JVM類似。
從故障診斷的角度來看,IBM為您提供了許多工具。 包括從其JVM實現中獲得的開箱即用的Thread Dump和Heap Dump生成功能。
例如,IBM JVM線程轉儲特別強大,因為它為您提供了有關JVM的額外數據,例如活動的JVM環境變量,GC策略,每個活動的類加載器中的已加載類等。我們將在本部分中對此進行更詳細的探討。我們的線程轉儲培訓計劃的4 。
IBM VM –默認GC行為
現在回到我們的主要主題,了解IBM JVM垃圾收集器(版本1.5和1.6)的默認行為非常重要。 默認情況下,使用終身記憶只例如,它不會創建一個單獨的YoungGen(幼兒園)空間中創建了Java堆空間。 這意味著任何內存分配都將進入租用空間(短期和長期對象),該空間隨后由默認收集器(通過Full GC)收集。
在下面找到詳細的GC快照,其中顯示了默認的GC內存故障,并帶有解釋:
<af type="tenured" id="5" timestamp="Mar 01 13:40:30 2012" intervalms="0.000"><minimum requested_bytes="48" /><time exclusiveaccessms="0.106" meanexclusiveaccessms="0.106" threads="0" lastthreadtid="0x000000011A846B00" /><tenured freebytes="20131840" totalbytes="2013265920" percent="0" ><soa freebytes="0" totalbytes="1993134080" percent="0" /><loa freebytes="20131840" totalbytes="20131840" percent="100" /></tenured><gc type="global" id="8" totalid="2492" intervalms="2017588.587"><finalization objectsqueued="199" /><timesms mark="808.286" sweep="9.341" compact="0.000" total="818.292" /><tenured freebytes="1362331024" totalbytes="2013265920" percent="67" ><soa freebytes="1344212368" totalbytes="1995147264" percent="67" /><loa freebytes="18118656" totalbytes="18118656" percent="100" /></tenured></gc><tenured freebytes="1362330976" totalbytes="2013265920" percent="67" ><soa freebytes="1344212320" totalbytes="1995147264" percent="67" /><loa freebytes="18118656" totalbytes="18118656" percent="100" /></tenured><time totalms="818.750" /></af>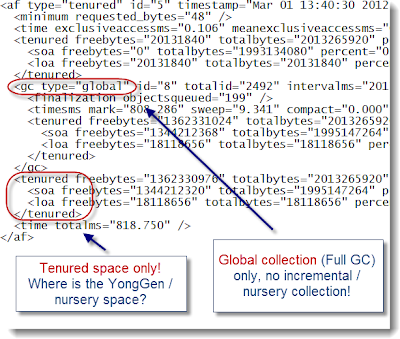
好的,默認的IBM JVM GC策略是不同的……問題是什么?
此默認JVM策略的問題在于,所有Java對象都被復制到租用空間并通過全局集合(完整GC)進行收集。 對于許多Java EE應用程序,短期對象與長期對象的比率要高得多。 這意味著您的JVM將需要執行很多主要的收集工作,以清理短期對象。 結果:Full GC的頻率增加,JVM暫停時間增加,CPU利用率增加和性能下降!
這正是我們在使用默認GC策略將JVM HotSpot 1.5(使用增量和并行GC)遷移到IBM JVM 1.6之后執行負載測試時觀察到的結果。 根據上述說明,重度GC過程被確定為根本原因。
請解決!
好消息是,IBM JVM 從版本1.5開始引入了世代和并發GC收集器 。 該GC政策正是提供了我們想要的:
- 它確實將Java Heap空間在苗圃空間和保育空間之間進行了劃分
- 托兒所(YoungGen)空間對象通過清除劑GC收集器單獨收集
- 通過全局GC收集器收集長期空間對象
- GC收集器是并發的,并且可以利用任何多物理核計算機
結果:
- 降低主要采集頻率(全GC)
- 減少了全GC消耗的時間和暫停時間
- 增加JVM吞吐量
- 提高應用程序的性能和容量
您可以通過在下面添加此JVM參數來啟用它:
-Xgcpolicy:gencon在啟用此GC策略后,在下面的詳細GC日志中可以找到什么:
<af type="nursery" id="15" timestamp="Mar 08 05:34:06 2012" intervalms="1289096.227"><minimum requested_bytes="40" /><time exclusiveaccessms="0.085" meanexclusiveaccessms="0.085" threads="0" lastthreadtid="0x0000000118113900" /><refs soft="18043" weak="204057" phantom="27" dynamicSoftReferenceThreshold="32" maxSoftReferenceThreshold="32" /><nursery freebytes="0" totalbytes="530716672" percent="0" /><tenured freebytes="1887422016" totalbytes="2013265920" percent="93" ><soa freebytes="1786758720" totalbytes="1912602624" percent="93" /><loa freebytes="100663296" totalbytes="100663296" percent="100" /></tenured><gc type="scavenger" id="15" totalid="15" intervalms="1289097.271"><flipped objectcount="1486449" bytes="129908000" /><tenured objectcount="1176" bytes="184144" /><finalization objectsqueued="3082" /><scavenger tiltratio="73" /><nursery freebytes="364304408" totalbytes="495208448" percent="73" tenureage="10" /><tenured freebytes="1886766656" totalbytes="2013265920" percent="93" ><soa freebytes="1786103360" totalbytes="1912602624" percent="93" /><loa freebytes="100663296" totalbytes="100663296" percent="100" /></tenured><time totalms="233.886" /></gc><nursery freebytes="364238872" totalbytes="495208448" percent="73" /><tenured freebytes="1886766656" totalbytes="2013265920" percent="93" ><soa freebytes="1786103360" totalbytes="1912602624" percent="93" /><loa freebytes="100663296" totalbytes="100663296" percent="100" /></tenured><refs soft="17992" weak="5344" phantom="27" dynamicSoftReferenceThreshold="32" maxSoftReferenceThreshold="32" /><time totalms="236.858" /></af>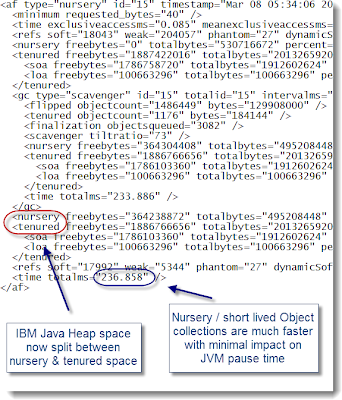
請記住,您的應用程序仍可能無法從該GC策略中受益(長壽命對象等會占用更大的空間),因此,我對您的建議是始終進行盡職調查并執行適當的容量規劃和負載測試您的應用程序,然后再執行任何主要的調整建議。
結論
我希望本文能幫助您了解默認的IBM JVM 1.5 / 1.6 GC策略以及Java EE應用程序如何從該GC策略gencon調整建議中受益。
參考: IBM JVM調優–來自我們JCG合作伙伴 Pierre-Hugues Charbonneau的gencon GC策略 ,位于Java EE支持模式和Java教程博客。
翻譯自: https://www.javacodegeeks.com/2012/04/ibm-jvm-tuning-gencon-gc-policy.html


——裝飾器模式)

方案_MySQL5.6主從復制(讀寫分離)方案)


