目錄
一、環境
二、Node_exporter部署
三、Prometheus部署
四、Grafana部署
五、驗證、使用
一、環境
系統使用CentOS7虛擬機。
監控三臺服務器:
192.168.114.10 Node1? ? ? ? ? ? ? ? #部署Prometheus、node_exporter、Grafana
192.168.114.20 Node2???????????????? #部署node_exporter
192.168.114.30 Node3???????????????? #部署node_exporter
????????在運維中,Prometheus和Grafana的組合是監控系統性能和資源利用率的理想方案,能夠提供全面的數據收集、存儲、可視化及告警功能。
關閉防火墻,關閉核心防護。設置時鐘同步,配置hosts文件。
時鐘同步設置中,我這里是在聯網的環境下,如果沒有網絡,請參考我前面的筆記:無網絡下,linux服務器實現時鐘同步
[root@Node1 ~]#:systemctl stop firewalld
[root@Node1 ~]#:setenforce 0
[root@Node1 ~]#:ntpdate ntp.aliyun.com
19 Aug 11:29:59 ntpdate[3664]: step time server 203.107.6.88 offset -28799.263186 sec
[root@Node1 ~]#:hwclock --systohc    #寫入硬件時鐘。
#配置hosts文件。
[root@Node1 ~]#:vim /etc/hosts
127.0.0.1   localhost localhost.localdomain localhost4 localhost4.localdomain4
::1         localhost localhost.localdomain localhost6 localhost6.localdomain6
192.168.114.10 Node1
192.168.114.20 Node2
192.168.114.30 Node3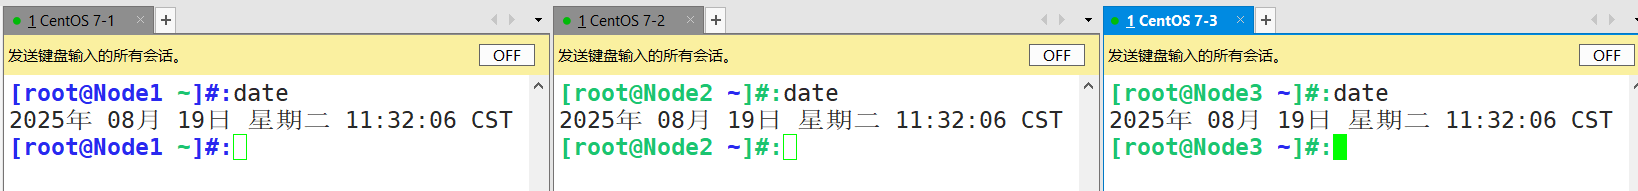
二、Node_exporter部署
? ? ? ? 在部署Prometheus時,通常還需要部署Node_exporter,這是由于Node Exporter是Prometheus生態中用于采集主機系統指標的核心組件,他負責將服務器的底層硬件和操作系統級指標(如CPU、內存、磁盤、網絡等)轉換為Prometheus可識別的格式,供Prometheus抓取、存儲和分析,從而實現對服務器運行狀態的實時監控。
? ? ? ? 可從node-exporter官網下載指定版本的安裝包:Node_exporter官網
? ? ? ? 這里下載的版本:node_exporter-1.8.2.linux-amd64.tar.gz,要監控的服務器都需部署安裝該服務。
將安裝包拷貝到/opt下,解壓到/usr/local/下。安裝node_exporter。
[root@Node1 opt]#:ls
node_exporter-1.8.2.linux-amd64.tar.gz
[root@Node1 opt]#:tar xf node_exporter-1.8.2.linux-amd64.tar.gz -C /usr/local/
更改為node_exporter名。賦予777權限,并查看版本為1.8.2。
[root@Node1 opt]#:cd /usr/local/
[root@Node1 local]#:ls
bin  etc  games  include  lib  lib64  libexec  node_exporter-1.8.2.linux-amd64  sbin  share  src
[root@Node1 local]#:mv node_exporter-1.8.2.linux-amd64/ node_exporter
[root@Node1 local]#:chmod 777 -R node_exporter/
[root@Node1 local]#:ls node_exporter/
LICENSE  node_exporter  NOTICE
[root@Node1 local]#:node_exporter/node_exporter --version
node_exporter, version 1.8.2 (branch: HEAD, revision: f1e0e8360aa60b6cb5e5cc1560bed348fc2c1895)build user:       root@03d440803209build date:       20240714-11:53:45go version:       go1.22.5platform:         linux/amd64tags:             unknown
[root@Node1 local]#:
????????在生產環境中,通常設置systemd管理服務,并設置開機自啟。
[root@Node1 local]#:vim /etc/systemd/system/node-exporter.service
[Unit]
Description=Prometheus Node Exporter
After=network.target
[Service]
ExecStart=/usr/local/node_exporter/node_exporter
[Install]
WantedBy=multi-user.target
[root@Node1 ~]#:
[root@Node1 ~]#:systemctl daemon-reload
[root@Node1 ~]#:systemctl start node-exporter.service
[root@Node1 ~]#:systemctl enable node-exporter.service
Created symlink from /etc/systemd/system/multi-user.target.wants/node-exporter.service to /etc/systemd/system/node-exporter.service.
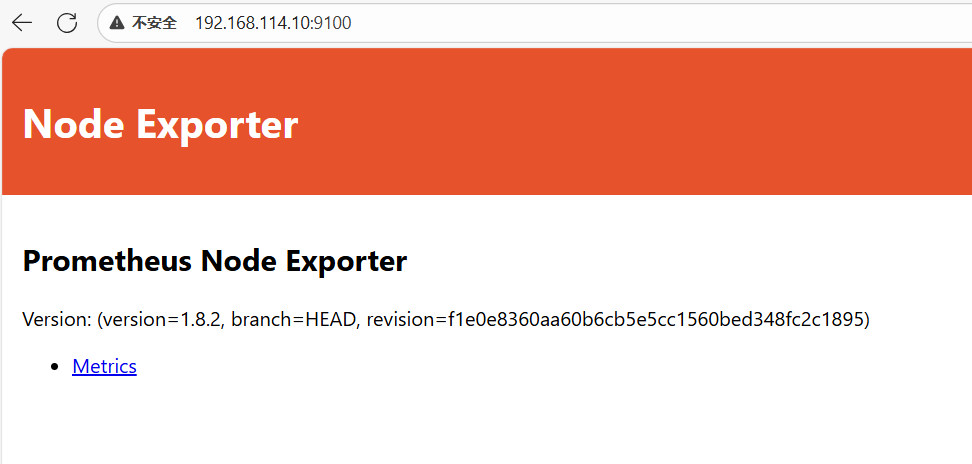
[root@Node1 ~]#:三臺服務器都需要安裝node_exporter服務,配置完成并設置開機自啟后查看端口是否啟來。端口為9100
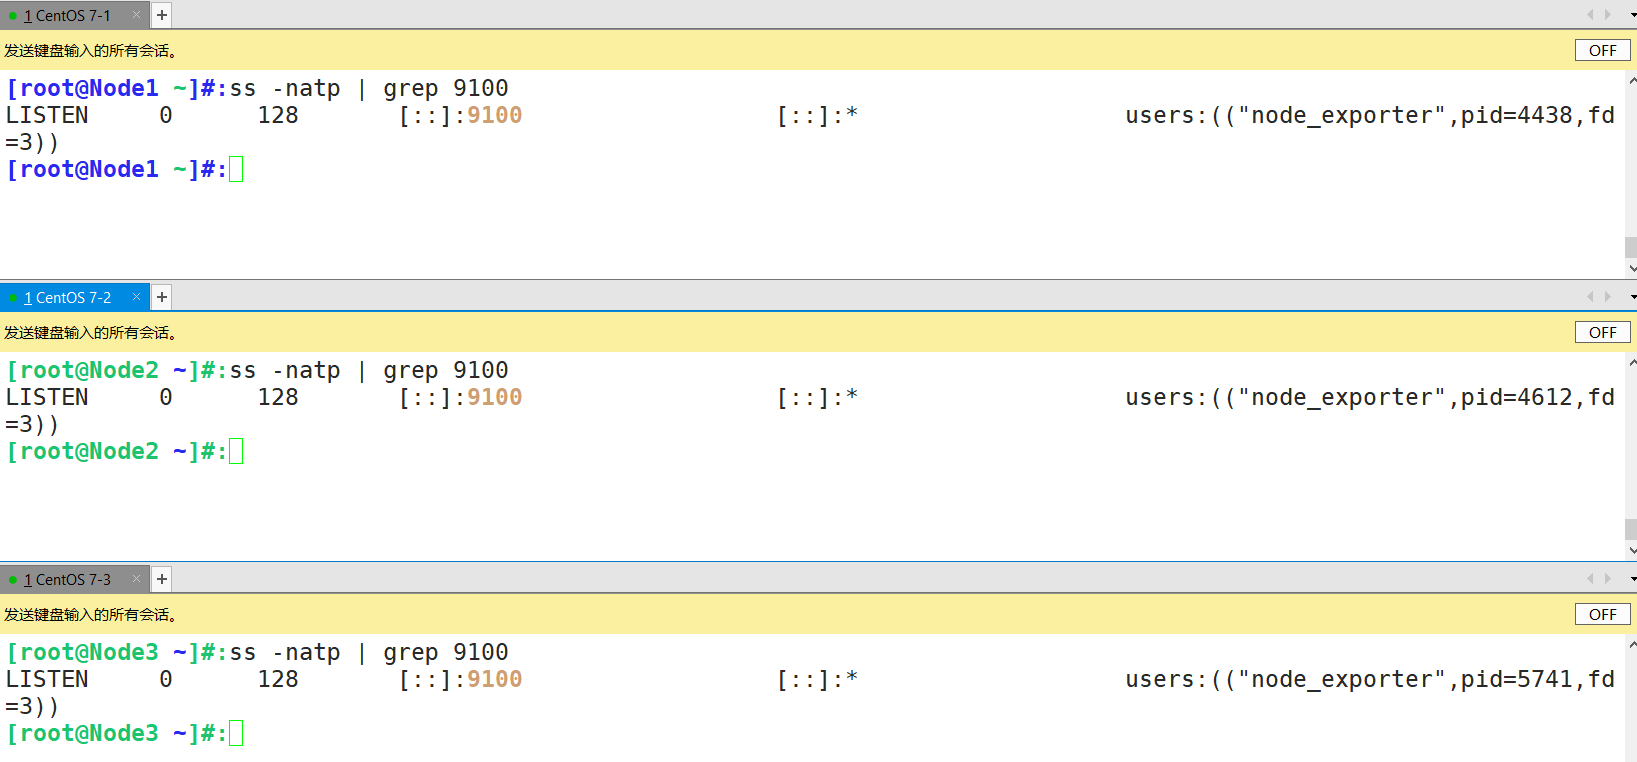
在瀏覽器訪問各自服務器ip:端口。能看到該頁面即為部署成功。
三、Prometheus部署
????????官網地址:Prometheus官網
????????這里下載版本:prometheus-2.53.2.linux-amd64.tar.gz,將該安裝包放在/opt下,并解壓到/usr/local/下。
[root@Node1 opt]#:ls
node_exporter-1.8.2.linux-amd64.tar.gz  prometheus-2.53.2.linux-amd64.tar.gz
[root@Node1 opt]#:tar xf prometheus-2.53.2.linux-amd64.tar.gz -C /usr/local/
????????進入/usr/local/下改名為prometheus,并賦予777權限。
root@Node1 opt]#:cd /usr/local/
[root@Node1 local]#:ls
bin  etc  games  include  lib  lib64  libexec  node_exporter  prometheus-2.53.2.linux-amd64  sbin  share  src
[root@Node1 local]#:mv prometheus-2.53.2.linux-amd64/ prometheus
[root@Node1 local]#:chmod 777 -R prometheus
????????進入prometheus家目錄下,修改主要配置文件prometheus.yml文件,指定任務標簽和監控ip,要監控那些服務器。
[root@Node1 local]#:cd prometheus/
[root@Node1 prometheus]#:ls
console_libraries  consoles  LICENSE  NOTICE  prometheus  prometheus.yml  promtool
[root@Node1 prometheus]#:vim prometheus.yml
......
scrape_configs:# The job name is added as a label `job=<job_name>` to any timeseries scraped from this config.- job_name: "prometheus"# metrics_path defaults to '/metrics'# scheme defaults to 'http'.static_configs:- targets: ["192.168.114.10:9090"]- job_name: "Grafana"static_configs:- targets: ['192.168.114.10:9100','192.168.114.20:9100','192.168.114.30:9100']    #node exporter地址
[root@Node1 prometheus]#:
#檢測yml配置文件。
[root@Node1 prometheus]#:./promtool check config prometheus.yml
Checking prometheus.ymlSUCCESS: prometheus.yml is valid prometheus config file syntax[root@Node1 prometheus]#:
prometheus同理也設置systemd管理,并開機自啟。
[root@Node1 prometheus]#:vim /etc/systemd/system/prometheus.service
[Unit]
Description=Prometheus Server
Documentation=https://prometheus.io/docs/introduction/overview/
After=network.target
[Service]
Restart=on-failure
WorkingDirectory=/usr/local/prometheus/
ExecStart=/usr/local/prometheus/prometheus --config.file=/usr/local/prometheus/prometheus.yml --web.enable-lifecycle
[Install]
WantedBy=multi-user.target
[root@Node1 prometheus]#:
[root@Node1 prometheus]#:systemctl daemon-reload
[root@Node1 prometheus]#:systemctl start prometheus.service
[root@Node1 prometheus]#:systemctl enable prometheus.service
Created symlink from /etc/systemd/system/multi-user.target.wants/prometheus.service to /etc/systemd/system/prometheus.service.
[root@Node1 prometheus]#:
查看端口,并訪問web頁面。
[root@Node1 prometheus]#:ss -natp | grep 9090
ESTAB      0      0      192.168.114.10:59894              192.168.114.10:9090                users:(("prometheus",pid=4855,fd=11))
LISTEN     0      128       [::]:9090                  [::]:*                   users:(("prometheus",pid=4855,fd=7))
ESTAB      0      0      [::ffff:192.168.114.10]:9090               [::ffff:192.168.114.10]:59894               users:(("prometheus",pid=4855,fd=12))
訪問到這個頁面表示部署成功。
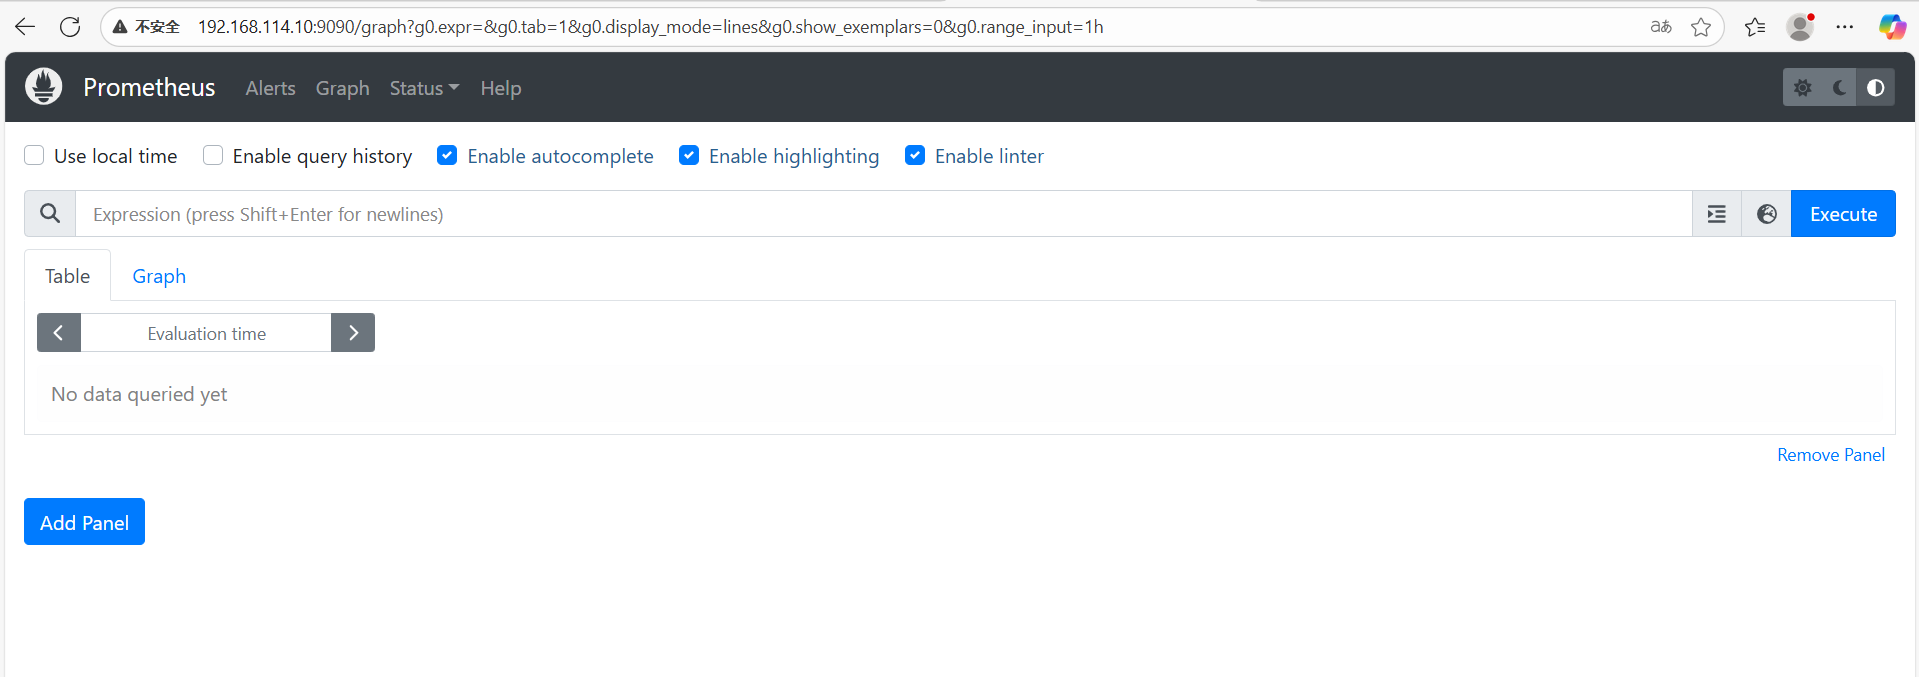
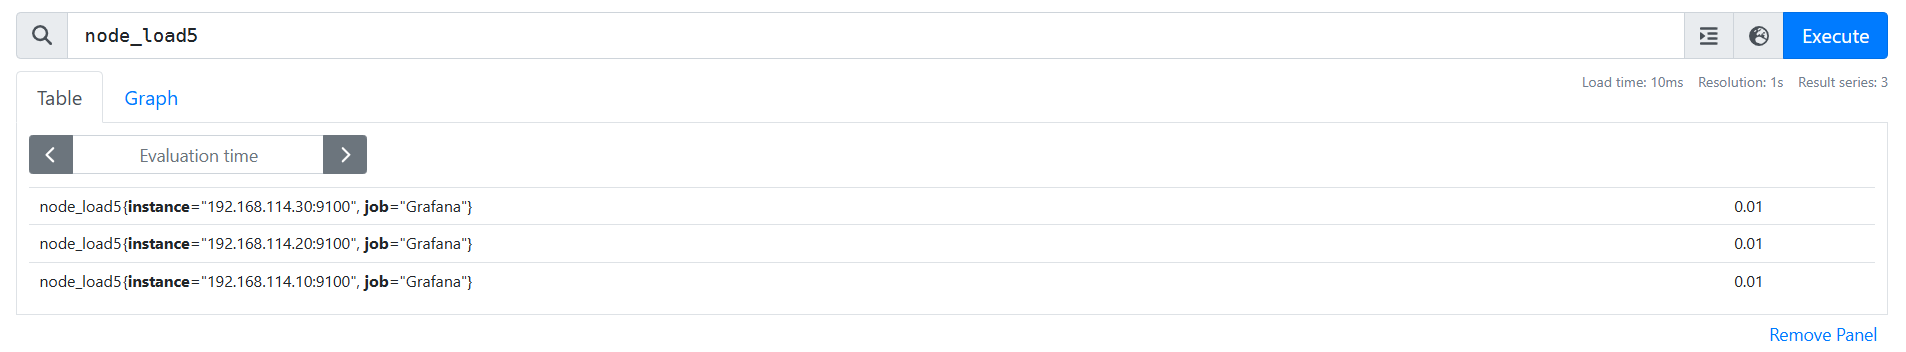
在搜索框中輸入PromQL語句,獲取監控曲線。點擊Graph可查看曲線。
node_load5:系統在過去5分鐘的平均負載。這個指標有助于了解系統的整體忙碌程序和性能表現。
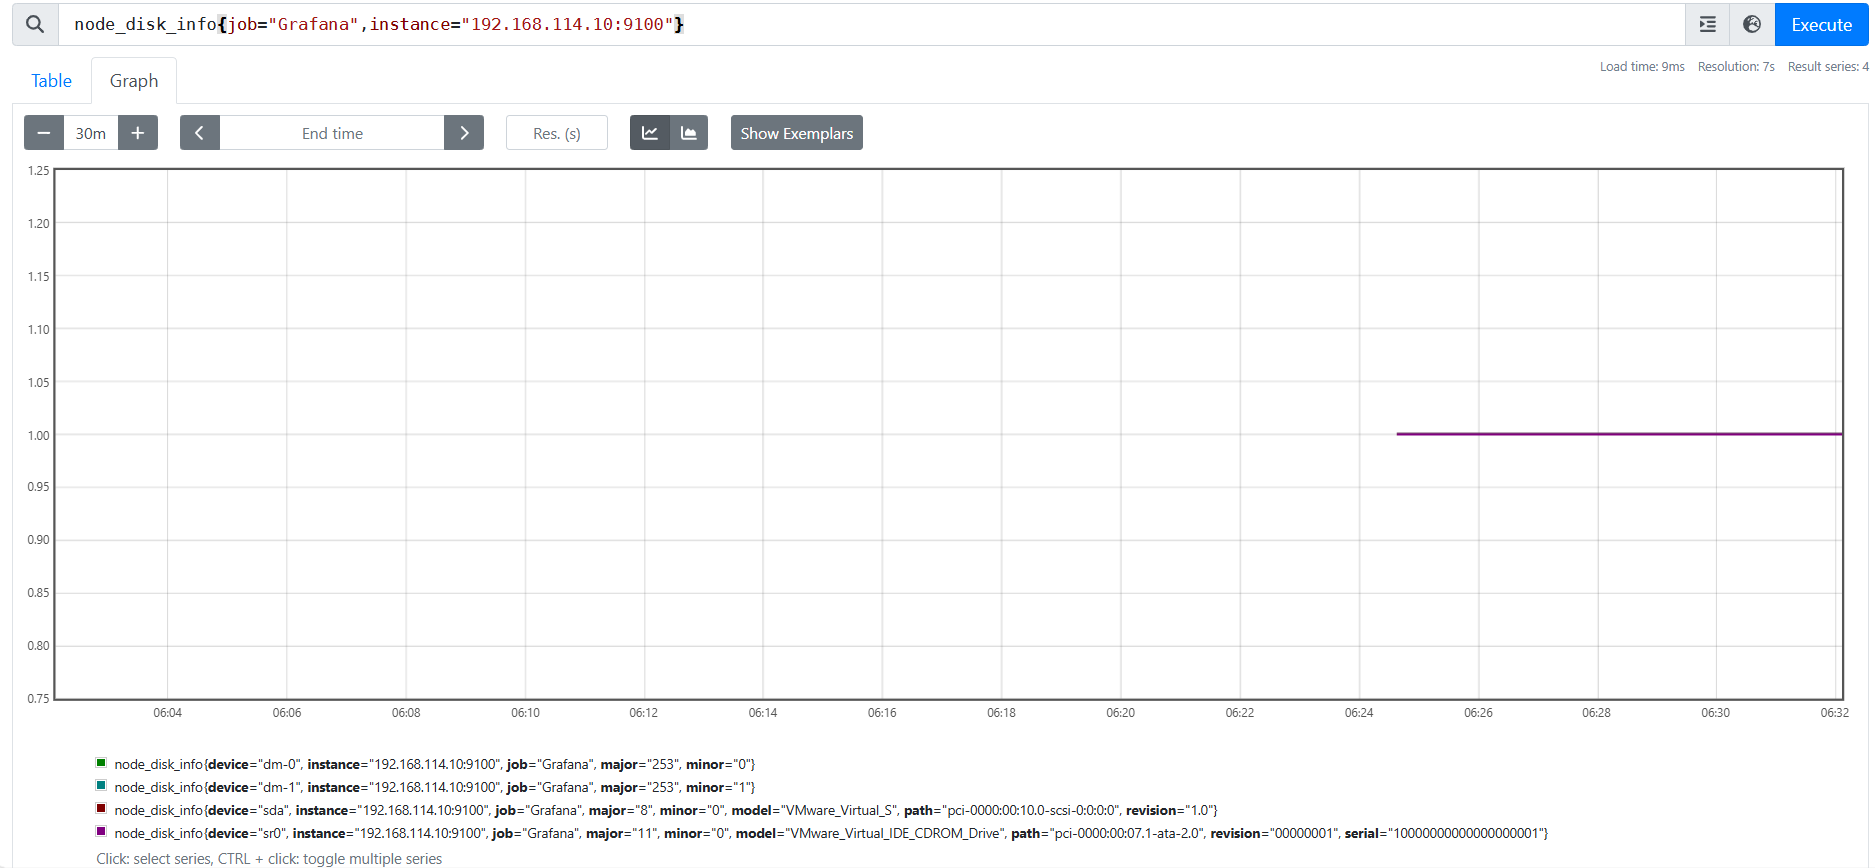
node_disk_info{job="Grafana",instance="192.168.114.10:9100"}
用于表示磁盤的信息,具體的指標因Node Exporter的版本和配置而已,一般來說,可能包含磁盤型號、大小、分區等信息。
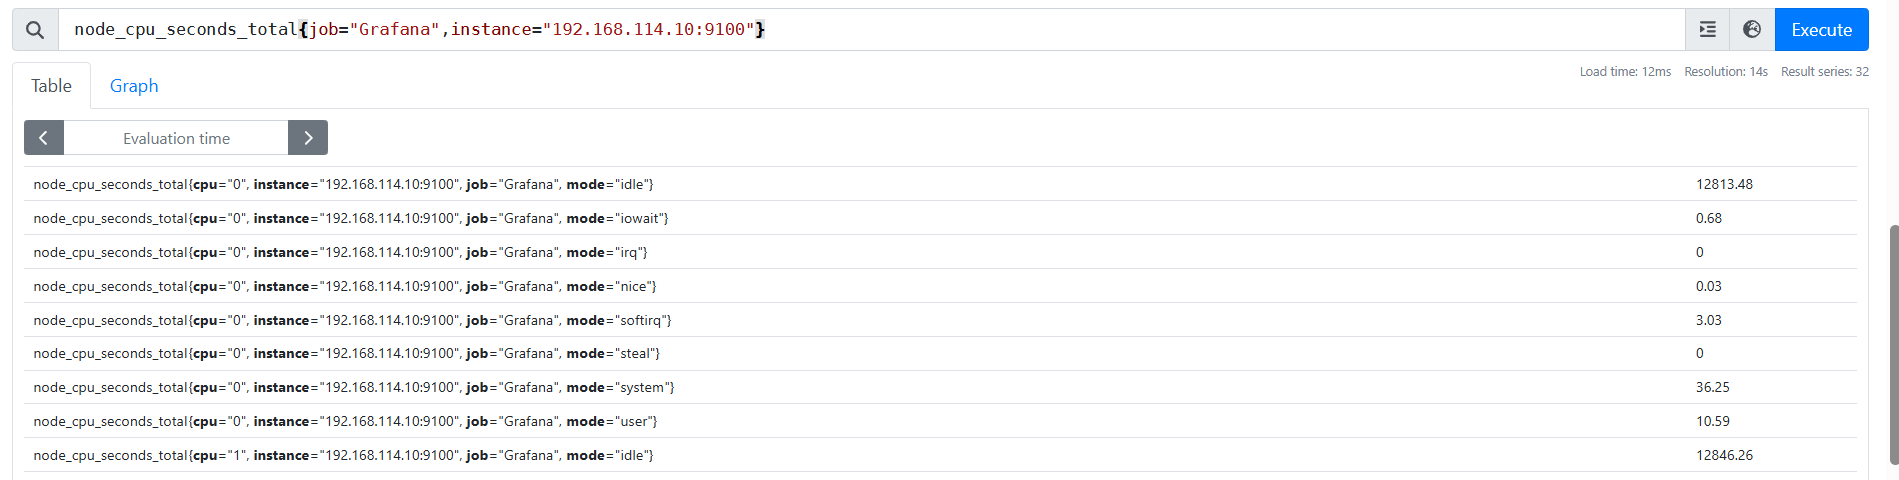
node_cpu_seconds_total{job="Grafana",instance="192.168.114.10:9100"}
表示cpu在各個狀態(如用戶態、系統態、空閑態等)下的消耗的總時間。這個指標是累計的,會隨著節點的CPU使用情況而不斷增長。
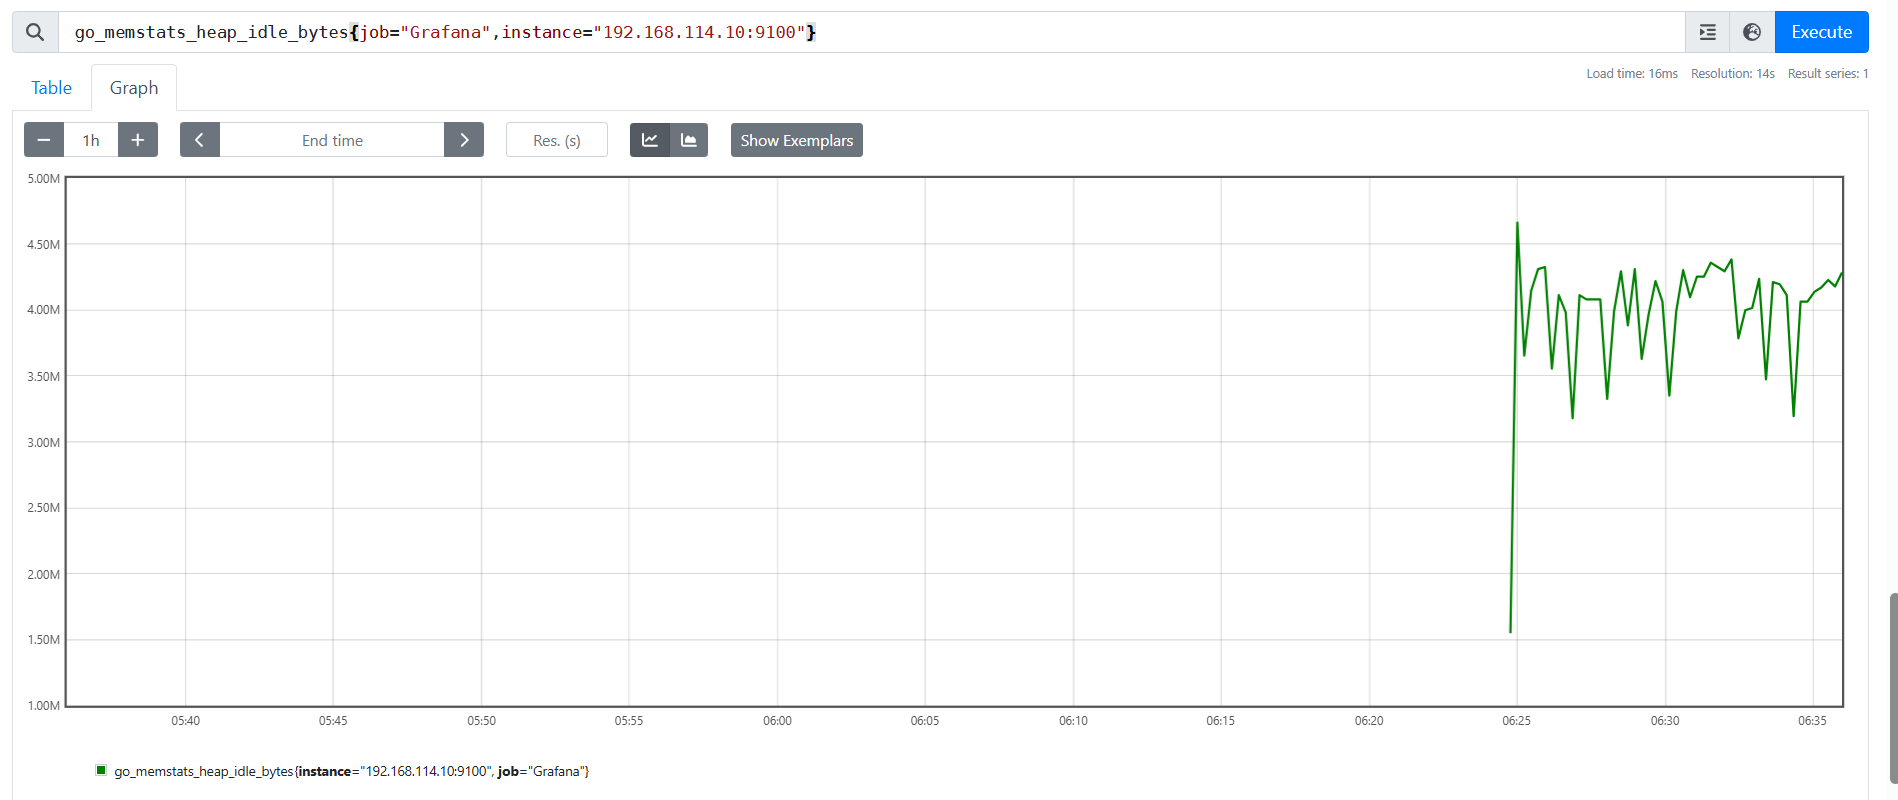
go_memstats_heap_idle_bytes{job="Grafana",instance="192.168.114.10:9100"}
表示GO程序堆內存中空閑的字節數,這個指標主要用于監控GO程序的內存使用情況。
四、Grafana部署
? ? ? ? Grafana官網:Grafana官網
? ? ? ? 為什么需要Grafana:有了Prometheus監控還需要Grafana,兩者定位不同,功能互補,Prometheus專注于高效的數據采集、存儲和查詢,而Grafana專注于數據可視化、交互分析和多數據源整合。
????????數據展示與交互:Prometheus的原生界面:提供基礎的查詢功能(通過PromQL執行臨時查詢)。支持簡單的圖表展示(如折線圖、表格),但缺乏自定義能力。無法創建復雜的儀表盤或動態交互界面。
Grafana的優勢:
????????豐富的可視化組件:支持折線圖、柱狀圖、熱力圖、儀表盤、表格等十種圖表類型。
????????動態交互:支持縮放、下鉆、聯動
????????自定義儀表盤:可靈活組合多個圖表,創建針對不同場景的監控大屏(如系統性能、業務指標)
多數據源整合:
????????Prometheus是Grafana的數據源之一
結論:
????????Prometheus是監控系統的大腦,負責數據采集、存儲和計算,而Grafana是監控系統的眼睛,負責將數據轉化為直觀的圖表和儀表盤。兩者結合,才能構建一個完整的、可觀測的監控系統。
? ? ? ? 這里下載版本:grafana-enterprise-12.0.2.linux-amd64.tar.gz,復制到/opt下。解壓到/usr/local下。
[root@Node1 opt]#:ls
grafana-enterprise-12.0.2.linux-amd64.tar.gz  prometheus-2.53.2.linux-amd64.tar.gz
node_exporter-1.8.2.linux-amd64.tar.gz
[root@Node1 opt]#:tar xf grafana-enterprise-12.0.2.linux-amd64.tar.gz -C /usr/local/
修改名稱為grafana。進入配置文件夾下。修改配置,默認端口后為3000。
[root@Node1 local]#:mv grafana-v12.0.2/ grafana
[root@Node1 local]#:cd grafana/
[root@Node1 grafana]#:ls
bin   Dockerfile  LICENSE    npm-artifacts  plugins-bundled  README.md  tools
conf  docs        NOTICE.md  packaging      public           storybook  VERSION
[root@Node1 grafana]#:cd conf/
[root@Node1 conf]#:ls
defaults.ini  ldap_multiple.toml  ldap.toml  provisioning  sample.ini
[root@Node1 conf]#:vim defaults.ini
......
[server]
# Protocol (http, https, h2, socket)
protocol = http# Minimum TLS version allowed. By default, this value is empty. Accepted values are: TLS1.2, TLS1.3. If nothing is set TLS1.2 would be taken
min_tls_version = ""# The ip address to bind to, empty will bind to all interfaces
http_addr = 0.0.0.0# The http port to use
http_port = 3000
......
#認證模塊,默認的用戶名和密碼:admin/admin
[security]
# disable creation of admin user on first start of grafana
disable_initial_admin_creation = false# default admin user, created on startup
admin_user = admin# default admin password, can be changed before first start of grafana, or in profile settings
admin_password = admin
......
查看版本信息:
[root@Node1 conf]#:cd ../bin/
[root@Node1 bin]#:ls
grafana  grafana-cli  grafana-server
[root@Node1 bin]#:./grafana --version
grafana version 12.0.2
[root@Node1 bin]#:
配置systemd管理,設置開機自啟。
[root@Node1 bin]#:pwd
/usr/local/grafana/bin
[root@Node1 bin]#:ls
grafana  grafana-cli  grafana-server
[root@Node1 grafana]#:vim /etc/systemd/system/grafana.service
[Unit]
Description=Grafana Server
Documentation=https://grafana.com/docs/
After=network.target[Service]
Restart=on-failure
WorkingDirectory=/usr/local/grafana
ExecStart=/usr/local/grafana/bin/grafana-server  --config=/usr/local/grafana/conf/defaults.ini[Install]
WantedBy=multi-user.target
[root@Node1 grafana]#:
[root@Node1 grafana]#:systemctl daemon-reload
[root@Node1 grafana]#:systemctl start grafana.service
[root@Node1 grafana]#:systemctl enable grafana.service
Created symlink from /etc/systemd/system/multi-user.target.wants/grafana.service to /etc/systemd/system/grafana.service.
[root@Node1 grafana]#:
查看端口:
[root@Node1 grafana]#:ss -natp | grep 3000
LISTEN 0 128 [::]:3000 [::]:* users:(("grafana",pid=5646,fd=17))
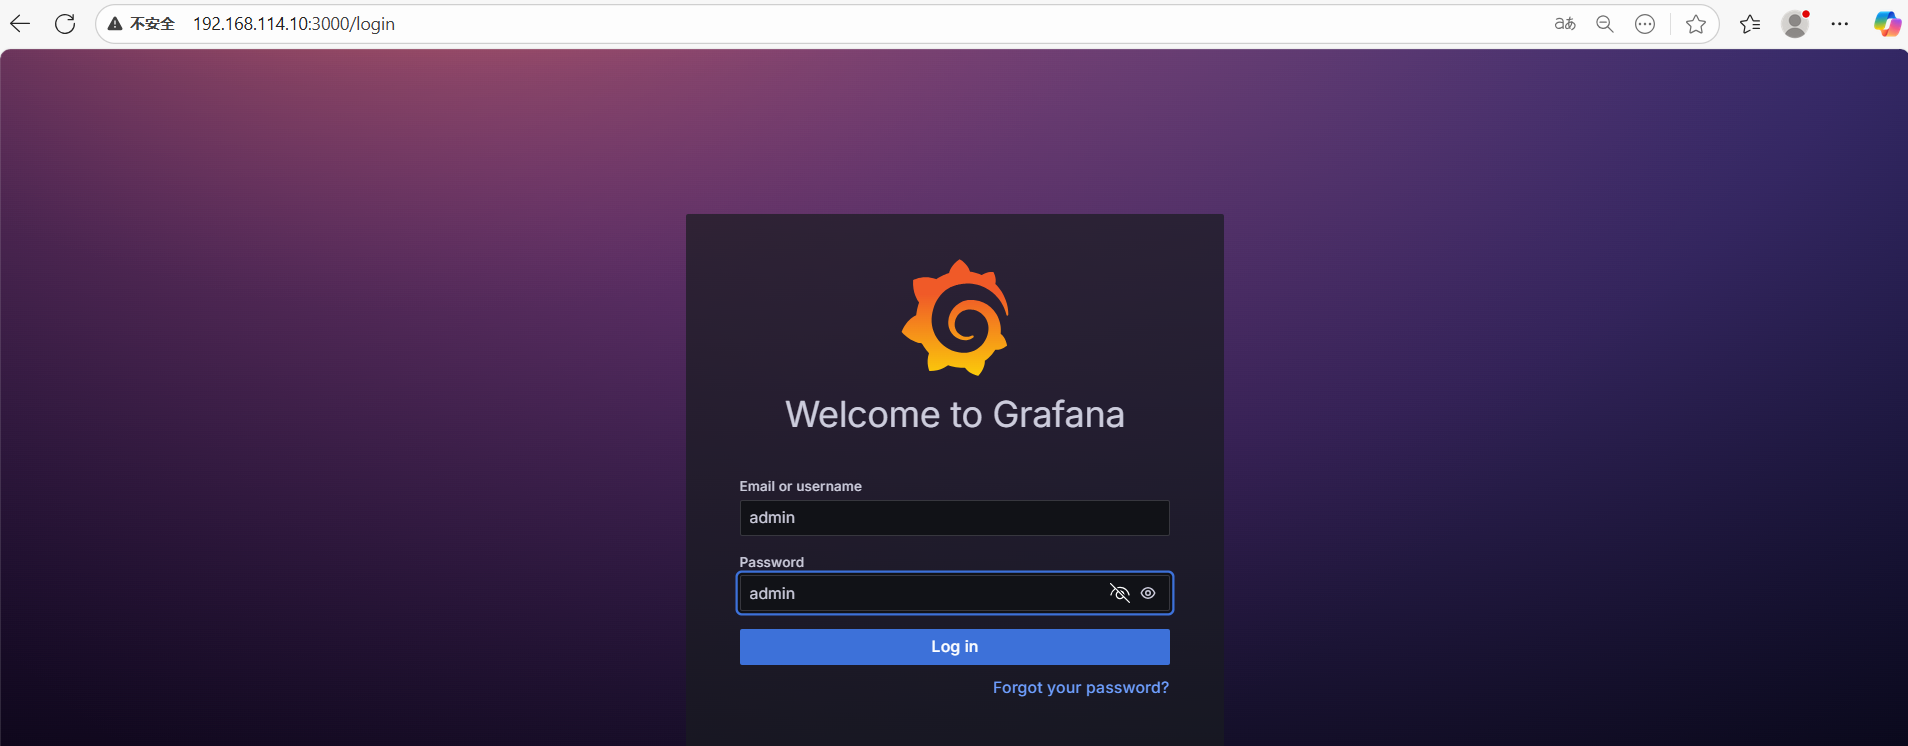
[root@Node1 grafana]#:登錄web端:輸入ip:3000
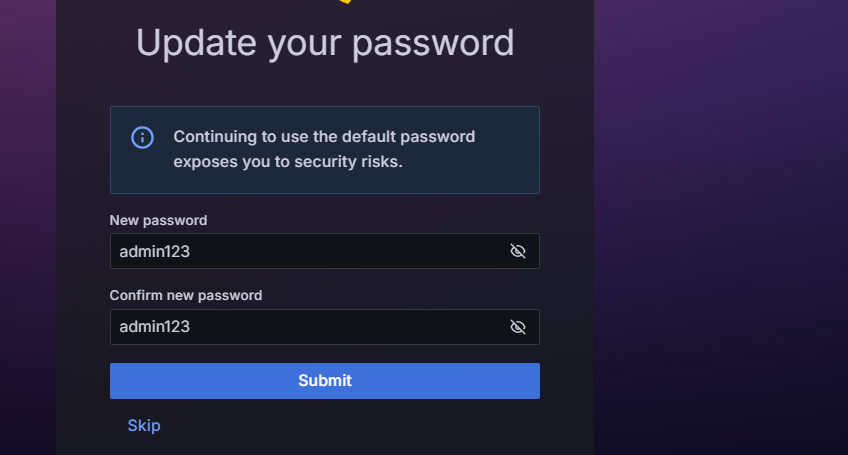
登陸后,需要修改密碼:
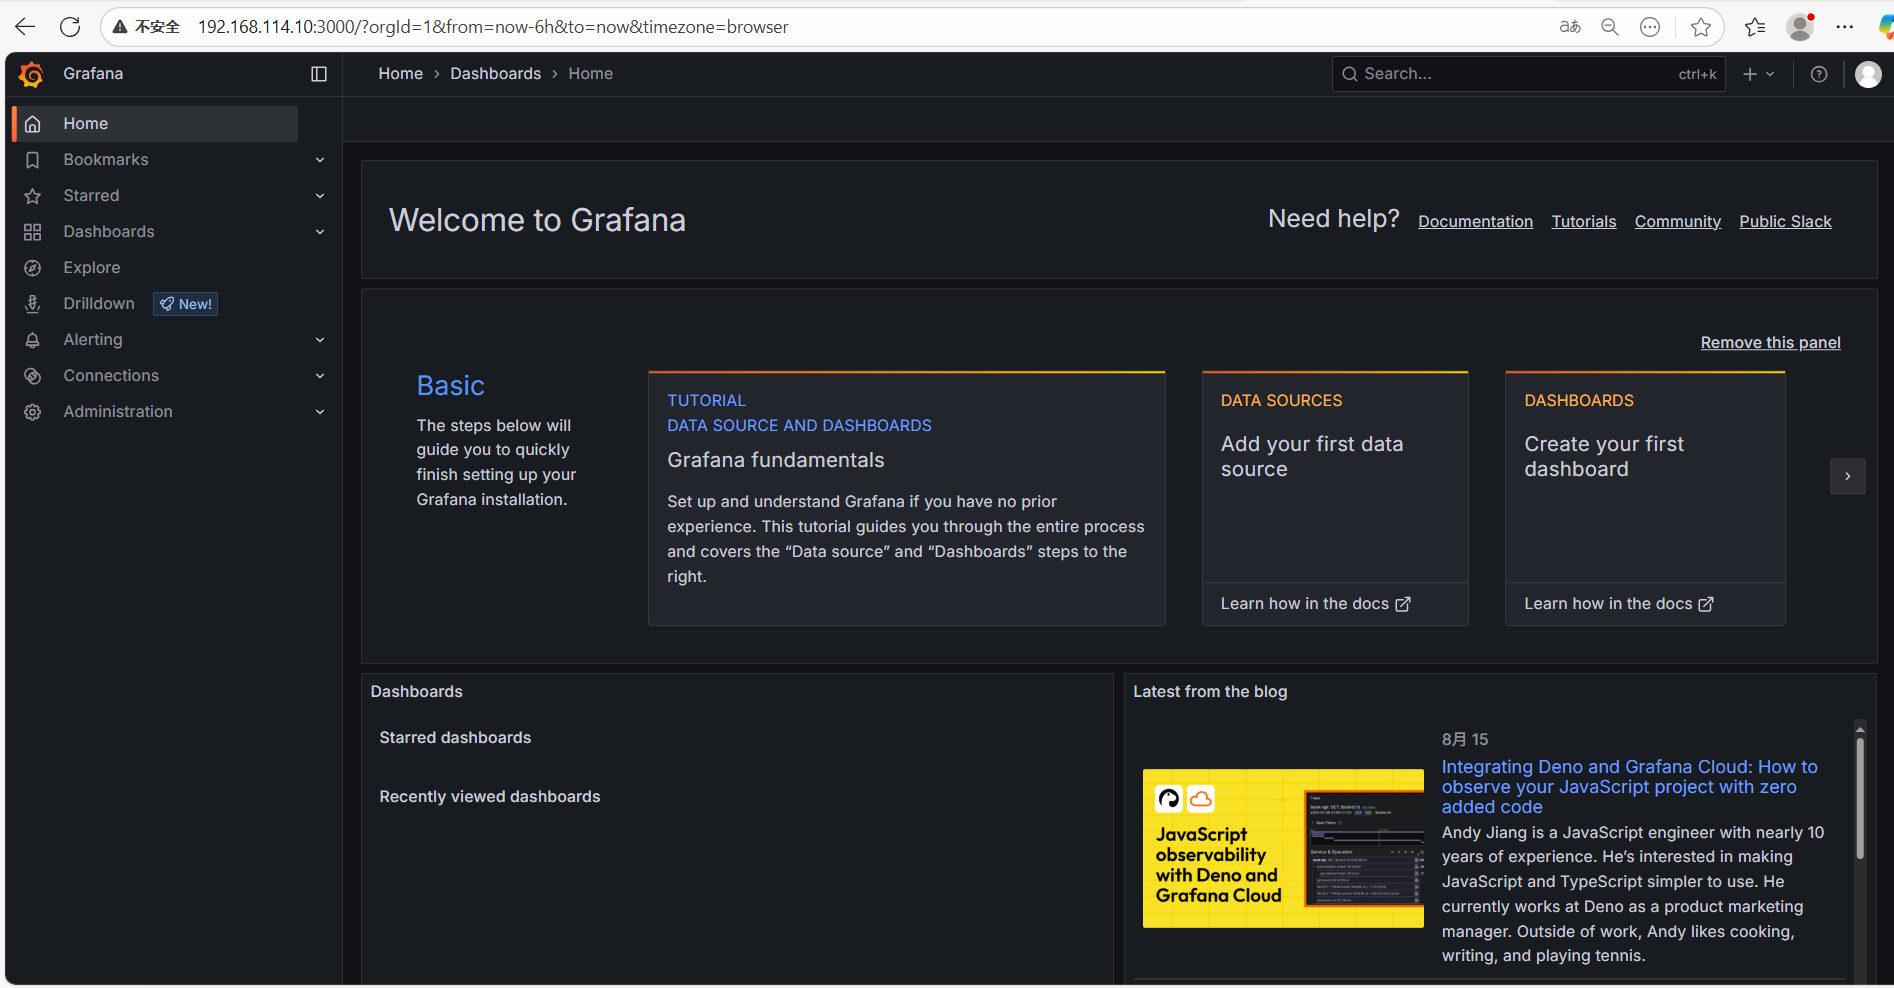
登錄成功,進入首頁。
五、驗證、使用
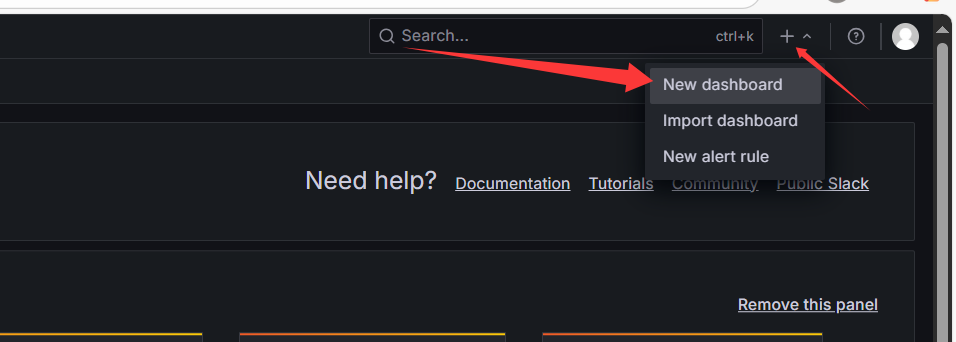
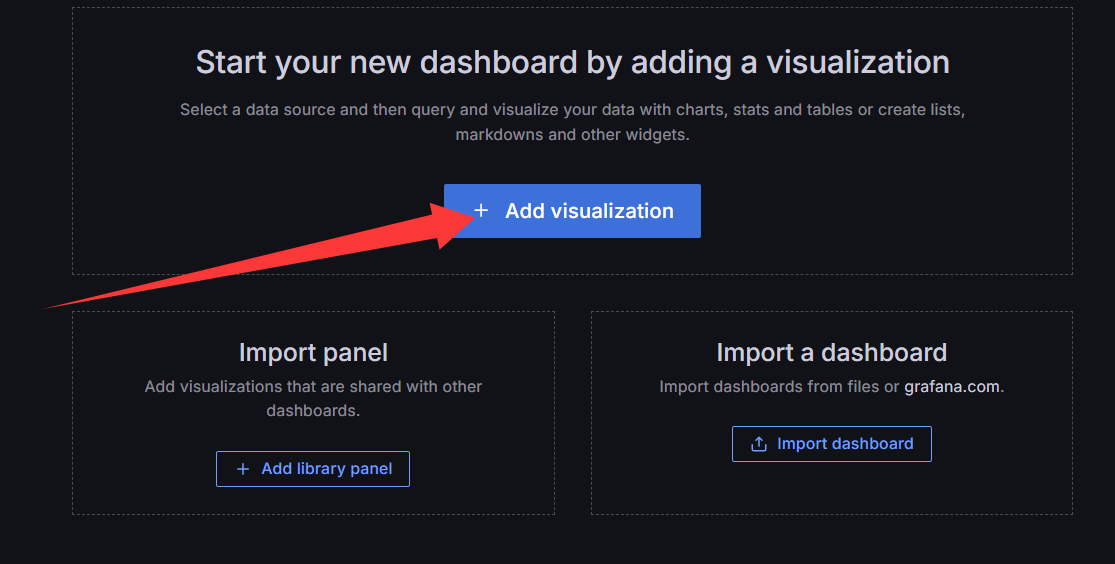
導入prometheus模板,點擊右上角+號,點擊New dashboard。
添加可視化界面。
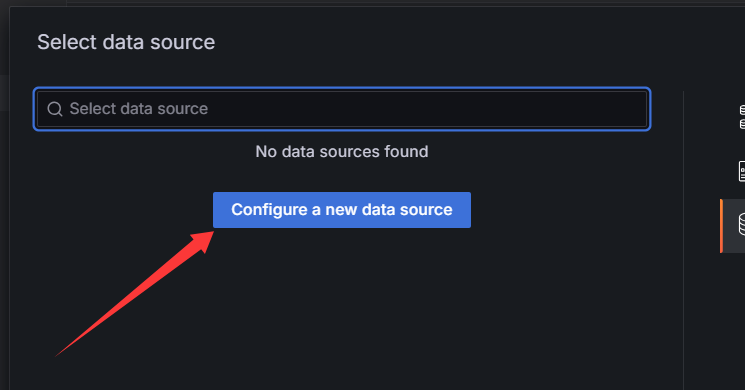
配置新的數據源
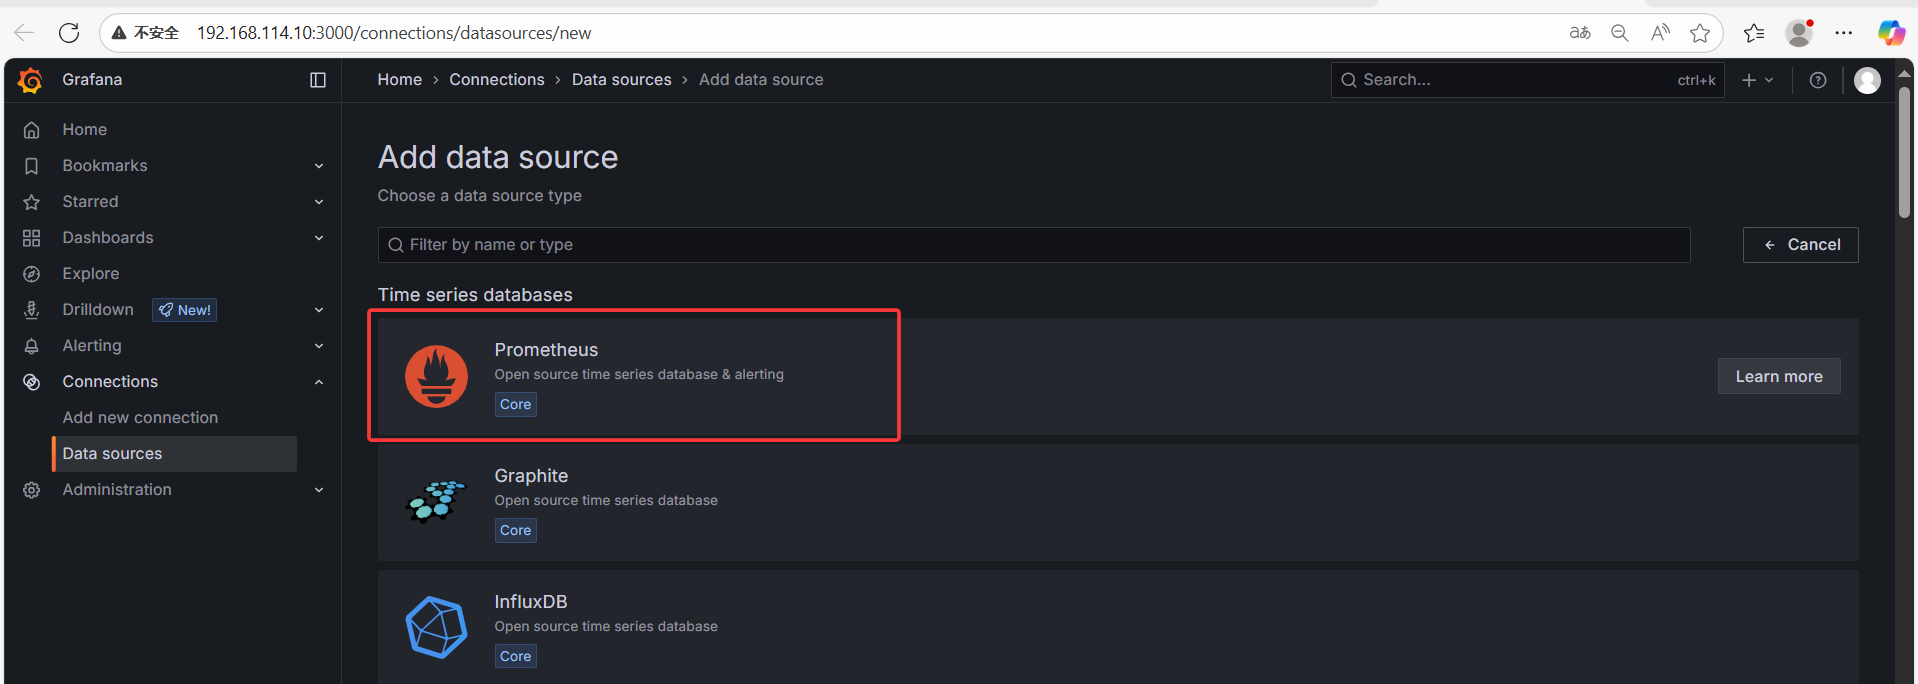
選擇Prometheus。
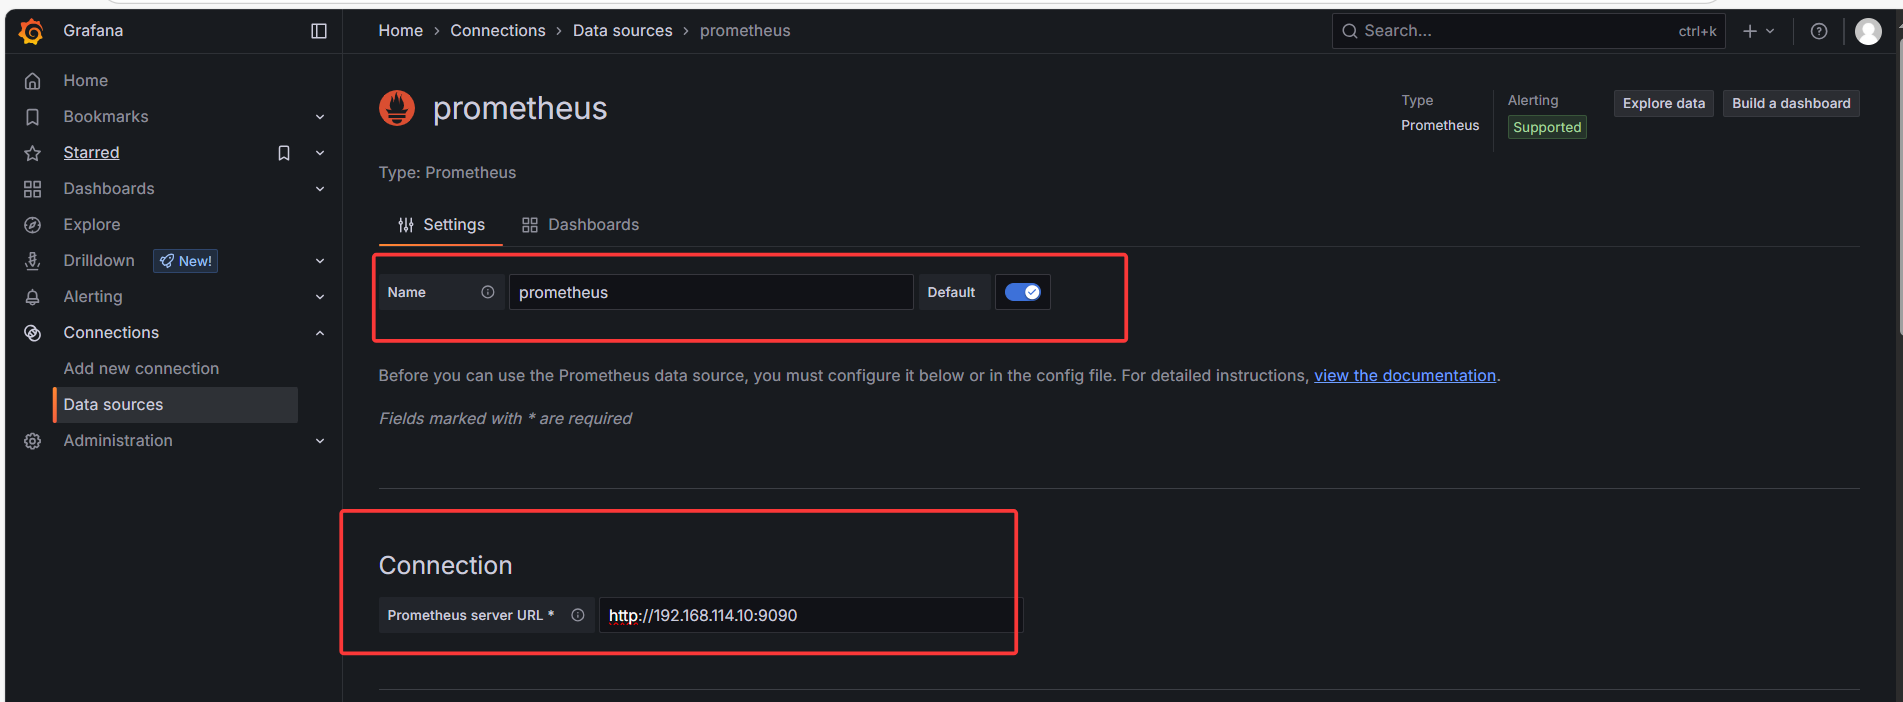
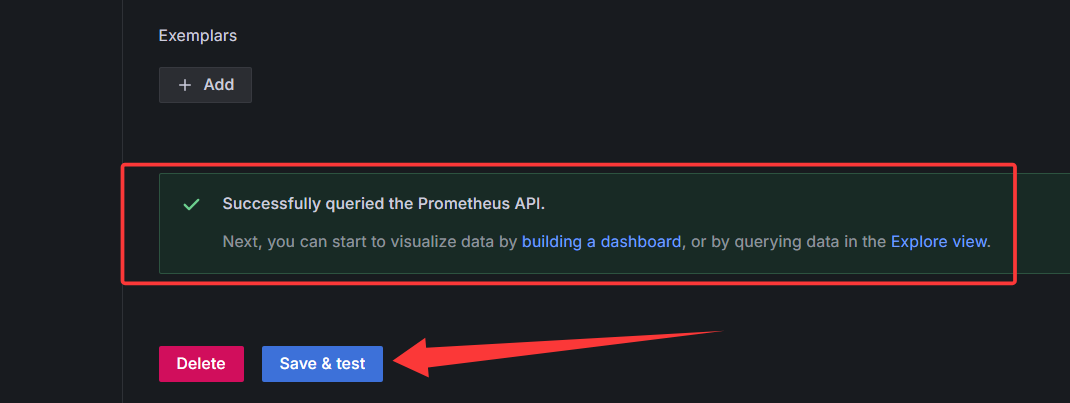
注意名稱和url地址。點擊保存。
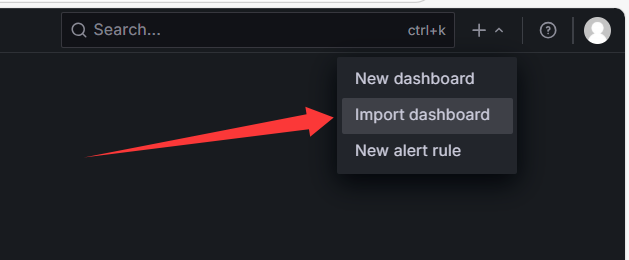
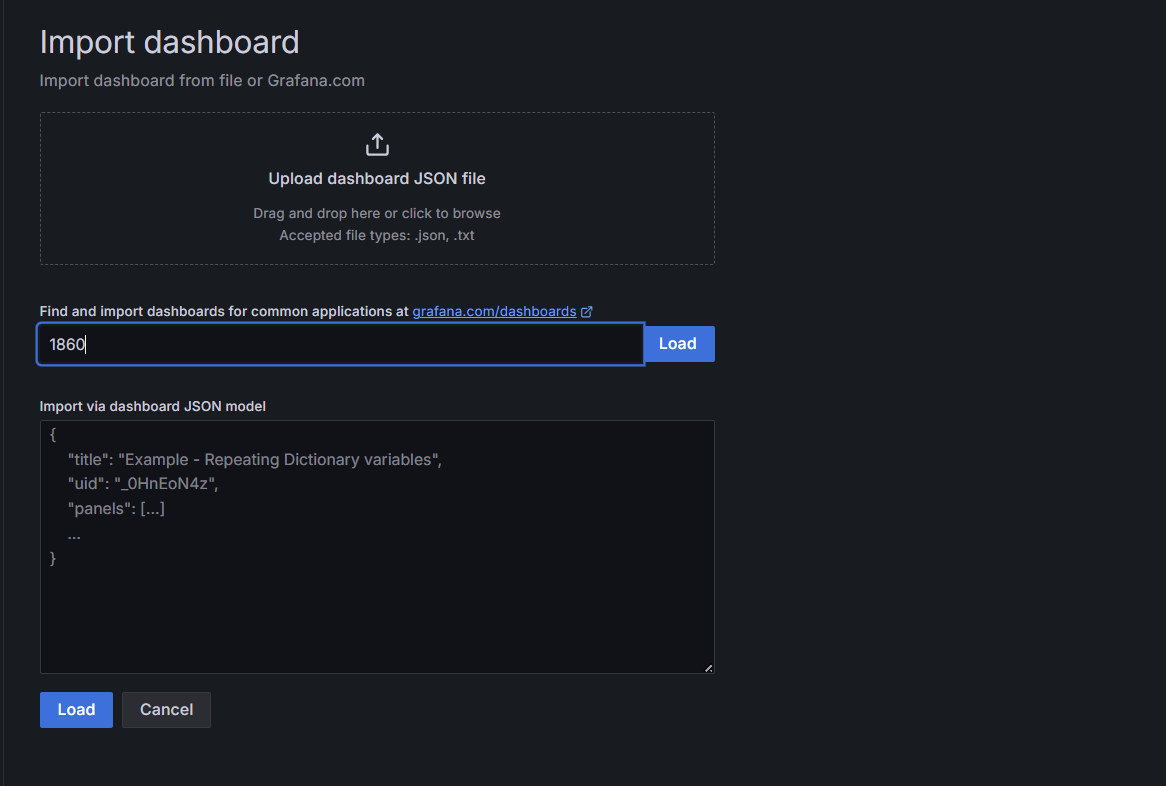
再次點擊右上角+號,點擊導入模板。
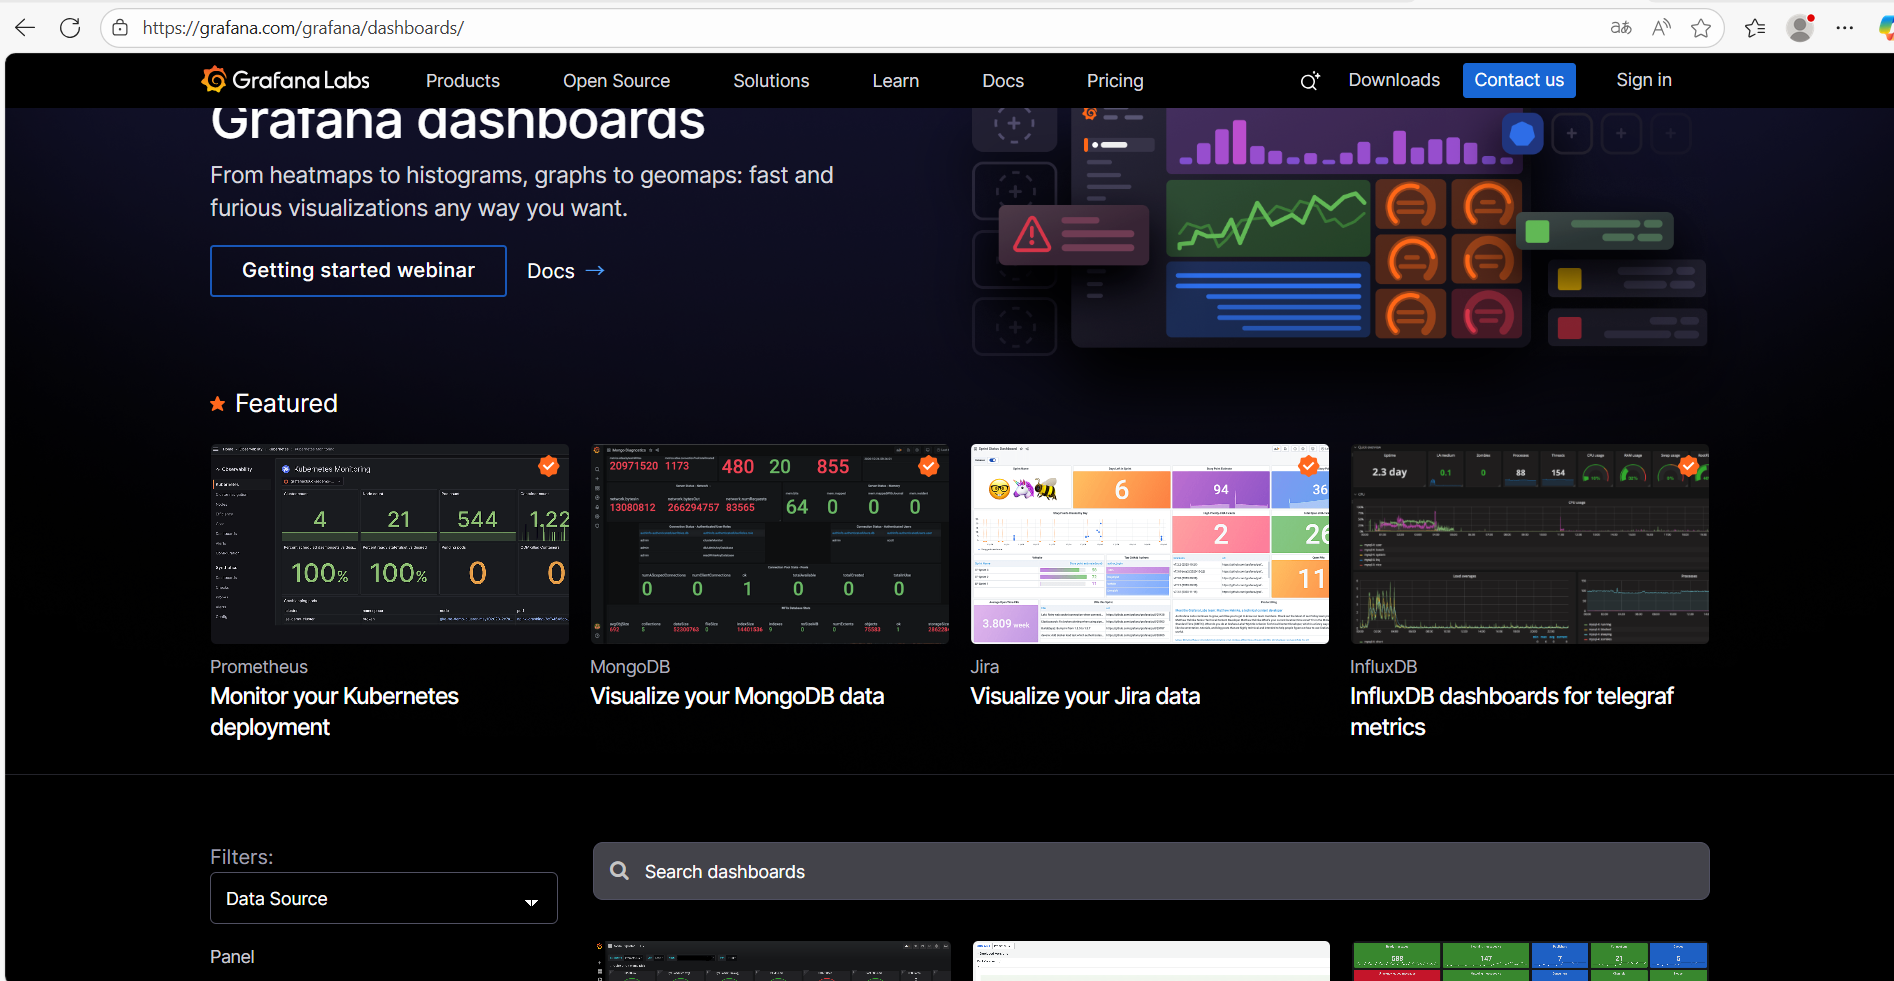
????????這里的模板是可視化的模板,具體模板官網也有專門的模板,只需要拿過來模板的id號,加載到我們的模板上即可使用。grafana界面:grafana可視化界面
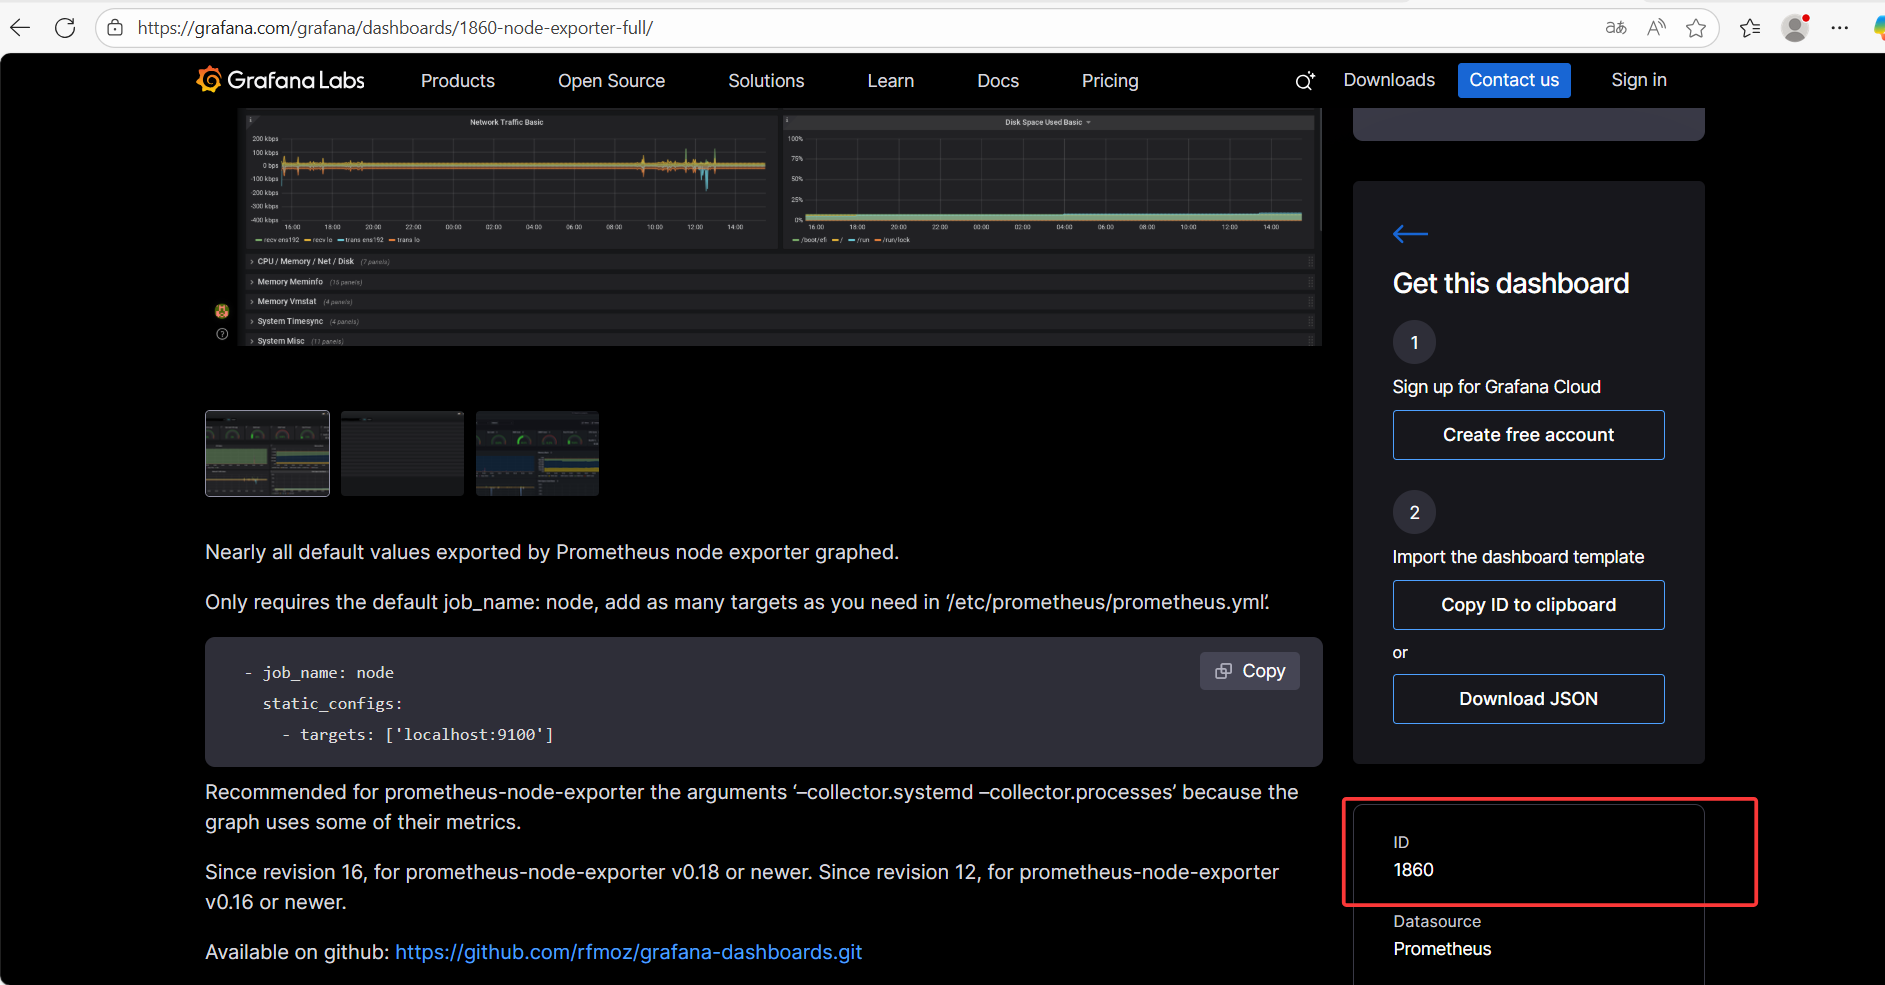
找到一個想要的界面點擊進去,找到id號,拿過來輸入到這里,點擊load.
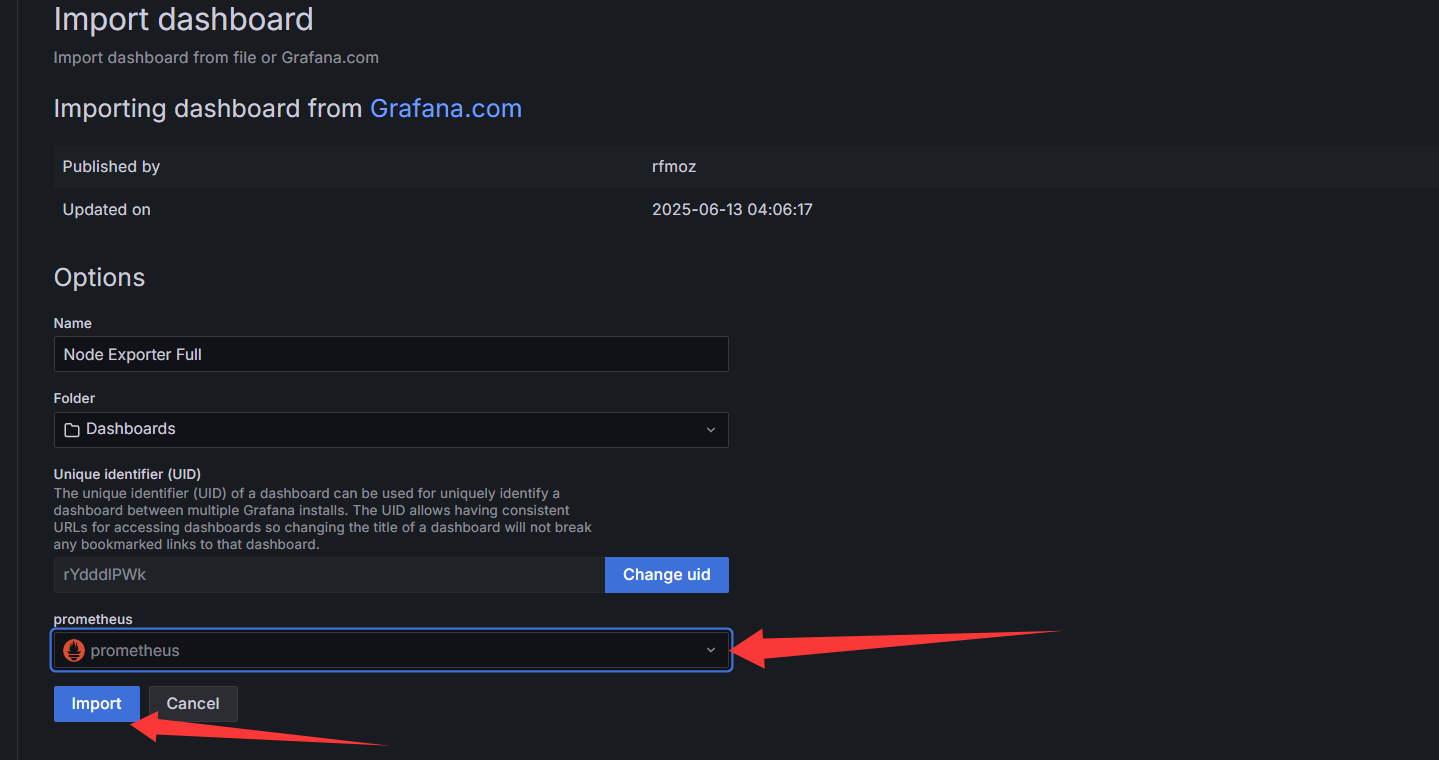
選擇我們創建的模板prometheus,點擊導入。
此時,可視化導入并使用完成。可以看到cpu指標4核,內存4g,
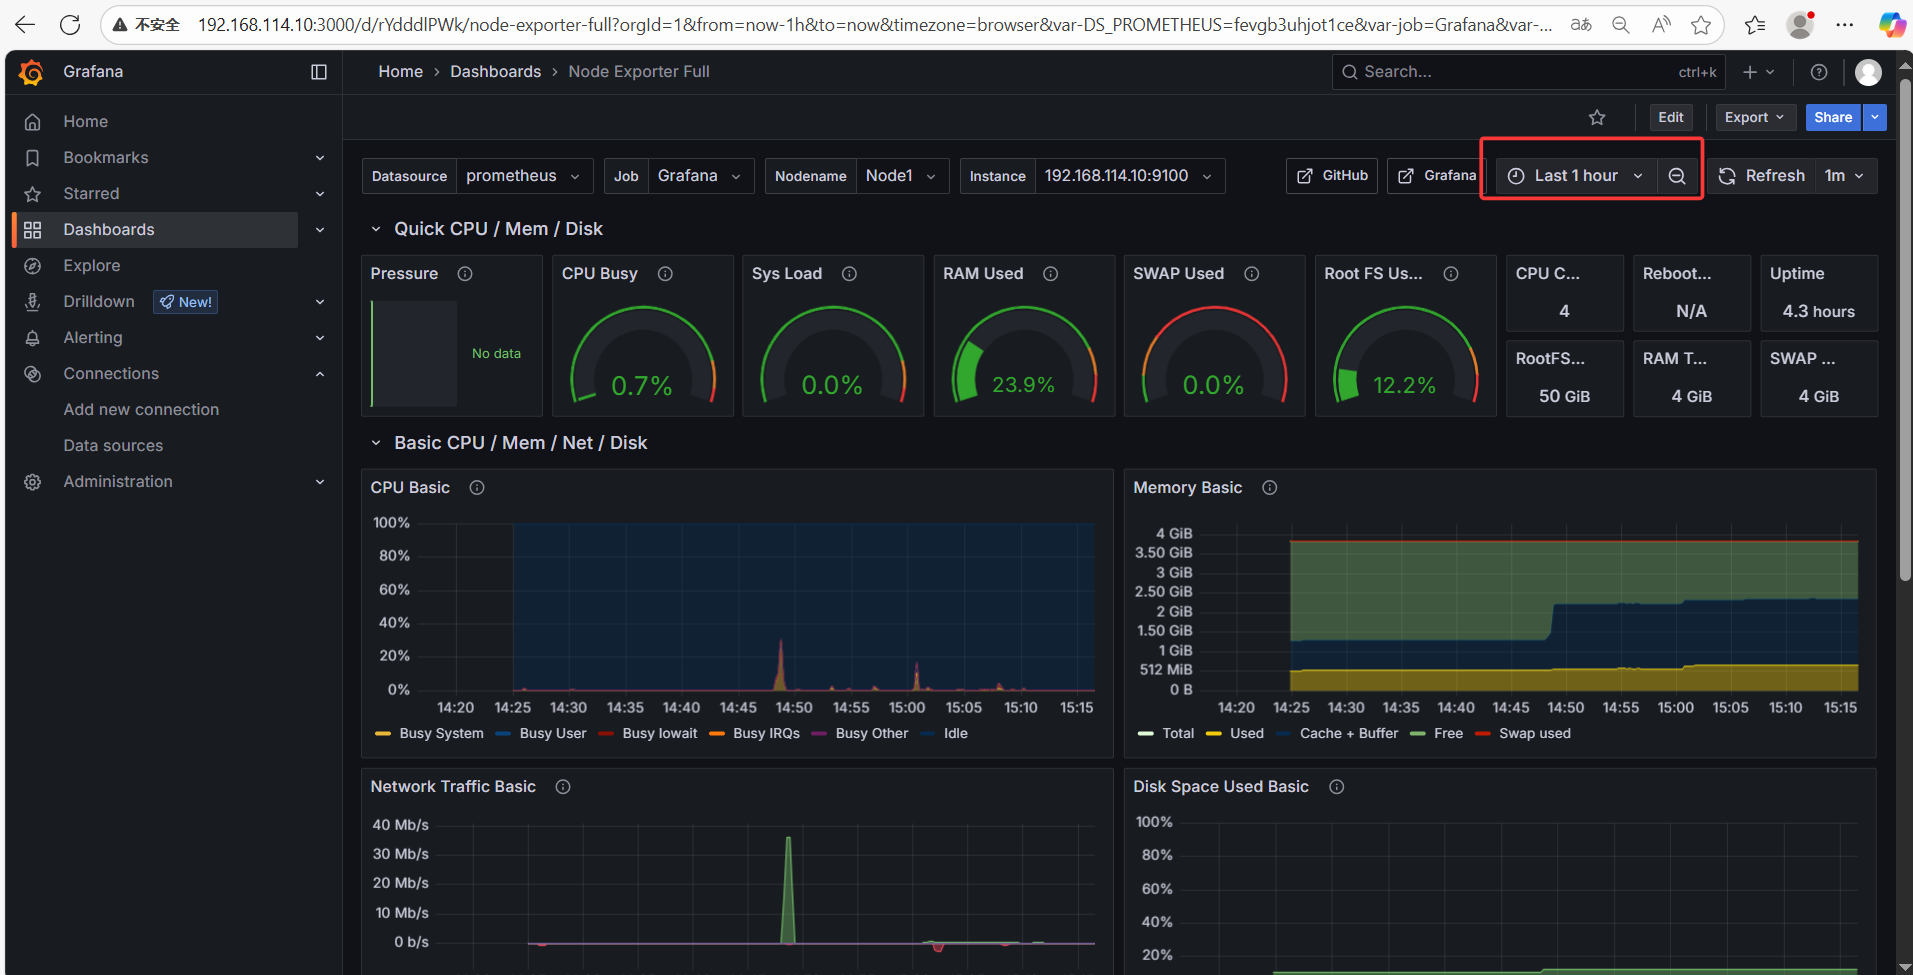
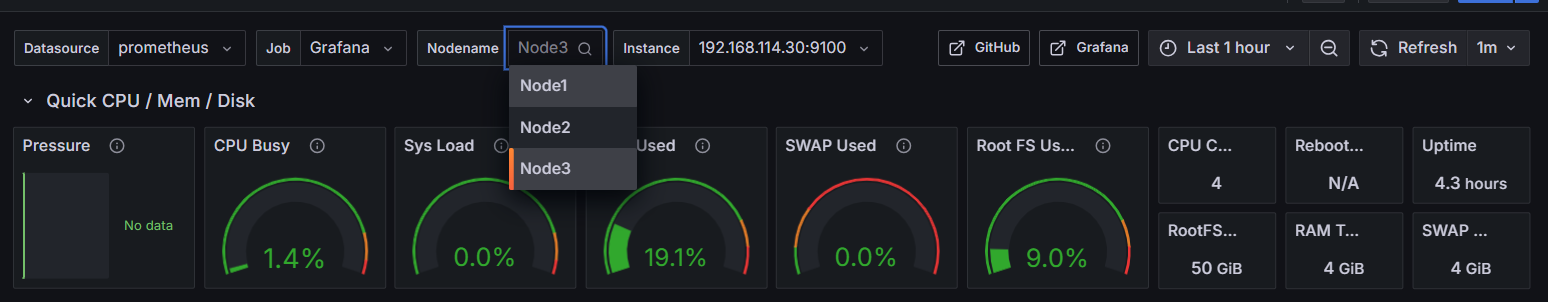
選擇要查看的節點。工作任務Grafana,監控最近1小時,刷新時間1分鐘。
---end---


)


)
)


![親測可用 [安卓]《神秘來電》V1.1無需登入無廣告離線打開即用手機模擬發起虛假來電免費版](http://pic.xiahunao.cn/親測可用 [安卓]《神秘來電》V1.1無需登入無廣告離線打開即用手機模擬發起虛假來電免費版)

)


