實時溫濕度監測系統
- 前言
- 項目目的
- 項目材料
- 項目步驟
- 模擬ESP32接線連接測試
- 搭建PC端ESP32拷錄環境
- 對ESP32進行拷錄
- PC端搭建桌面組件
- 本地數據接收
- 桌面小組件部分
- 實驗總結
前言
人生苦短,我用Python。
由于我在日常工作中經常使用Python,因此在進行該項目時,我首先考慮使用Python進行實現。在搜索電路板編程相關內容時,我發現Micropython是一個非常好的選擇,因為它使用簡單的語法能夠幫助新手快速掌握。因此,我決定使用Micropython來實現該項目。

項目目的
實時監控房間溫度,可以將其用作實時溫濕度查看的桌面插件,也可以將其用作溫濕度監控裝置。
要求ESP32所處房間需要有可連接的wifi。
項目材料
- ESP32 wifi 模塊
- HDT22 溫濕度傳感器
- 母對母接頭(買HDT22會送)
項目步驟
模擬ESP32接線連接測試
可使用我進行模擬的網站進行學習,點擊boot.py再點擊播放鍵即可運行:“Wokwi測試項目”
這個測試網站可以使用“Wokwi-GUEST”開放式wifi進行測試,實際使用中將wifi改為房間中的wifi和密碼即可。
并且該項目的兩個py文件就是我本地拷錄并且運行的代碼,代碼可以實現持續連接wifi和MQTT的功能,并且有呼吸燈和指示燈(這部分實際連接的時候可以注意到),還有一些數據傳輸的部分修飾。

能夠看到當前的結果就是代碼可以正常實現將溫濕度以及時間數據傳輸到MQTT公共服務端:MQTT開放端口

動手實踐時可以按照模擬的方式進行實際連接:

搭建PC端ESP32拷錄環境
安裝tonny并且快速入門可看這個前幾集和課件。
【Python+ESP32 快速上手(持續更新中)【 通俗易懂 】】 https://www.bilibili.com/video/BV1G34y1E7tE/?share_source=copy_web&vd_source=0d6fb1bf666097a8d32dc1f77cf20826
注意事項:
- 安裝驅動之后連接ESP32到電腦可能不顯示端口COM,可能是使用的數據線類型過舊,盡量更換數據線進行使用;
- Tonny運行的時候可能出現未連接情況,只需要點擊重啟后端,或者拔出等幾秒重新插入即可。

對ESP32進行拷錄
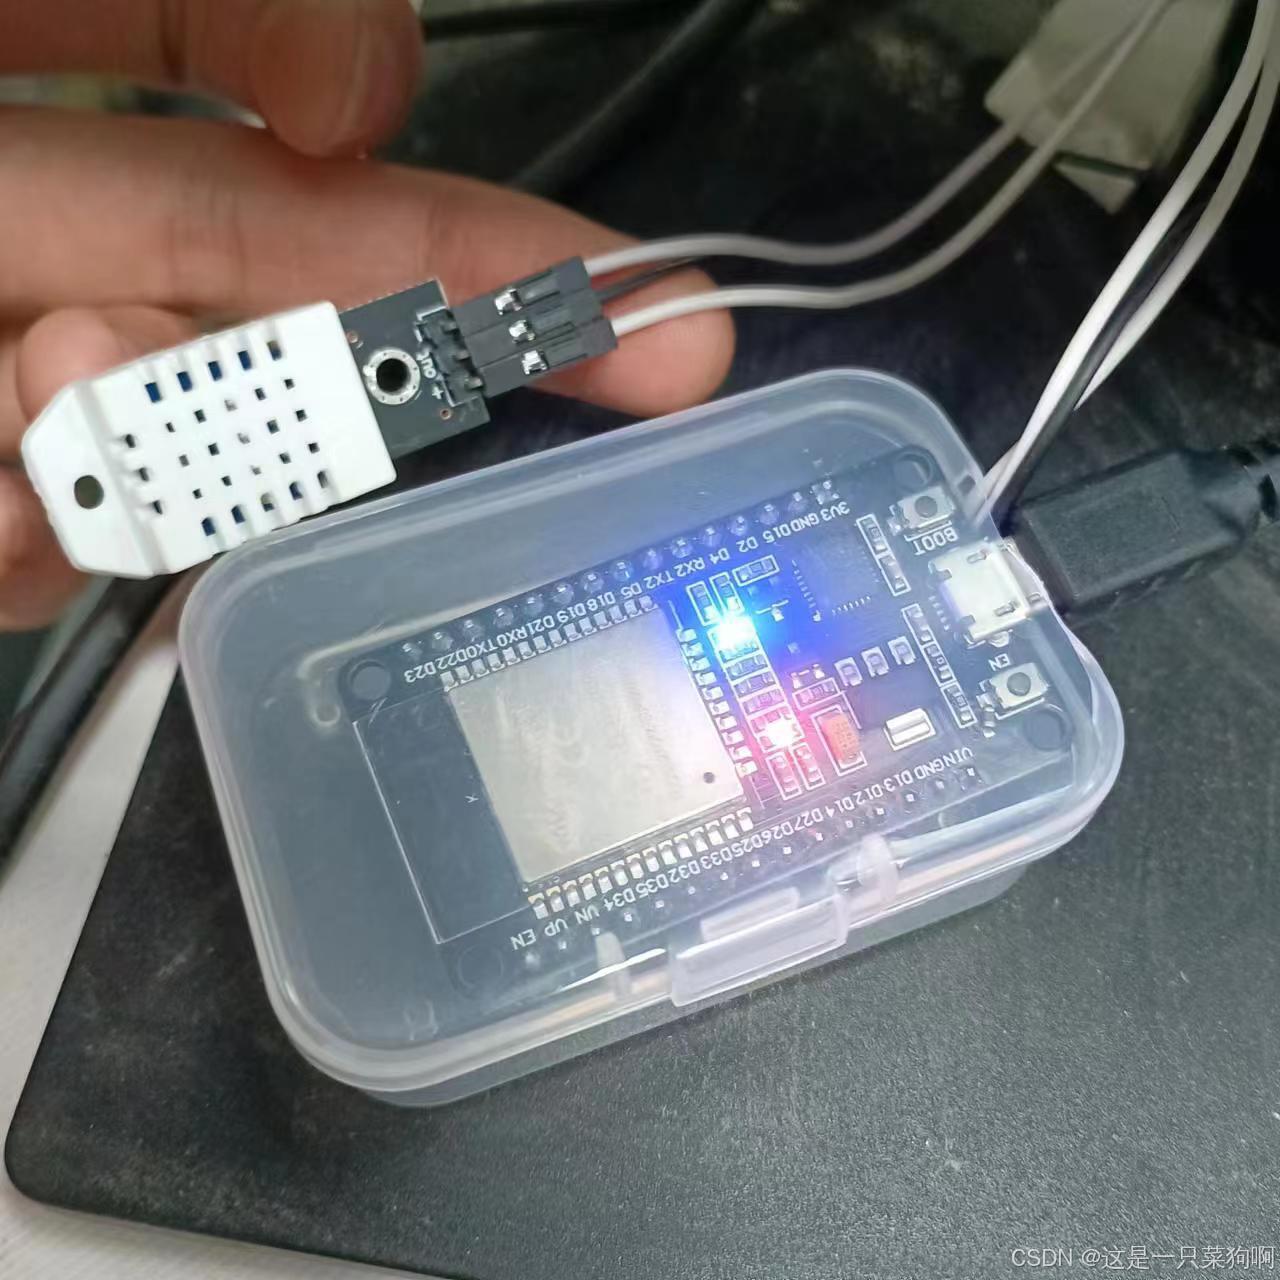
- 將模擬網站上的兩個代碼拷貝下來,修改TOPIC(盡量是唯一的,因為是公共端口,同時記得修改本地接收代碼里面的信息)以及wifi部分,上傳至ESP32中;
- 正確連接HDT22和ESP32;
- 給ESP32進行供電,當連接之后藍燈閃爍就是在上傳實時溫濕度,藍燈常亮就是MQTT端口暫時端口,藍燈不亮就是wifi也沒連上;
PC端搭建桌面組件
這部分是主要使用MQTTpython包進行本地數據接收以及tkinter創建桌面組件實現實時展示并且可以繪制折線圖。
本地數據接收
MQTT本地包進行實時數據接收,保存到當前目錄下的data.txt,可以自行修改,同時記得修改桌面組件讀取路徑。
import paho.mqtt.client as mqtt
import json# 當收到連接時的回調函數
def on_connect(client, userdata, flags, rc):print("Connected with result code " + str(rc))# 訂閱主題client.subscribe(topic)# 當接收到消息時的回調函數
def on_message(client, userdata, msg):print("Received message: " + msg.payload.decode())dict = json.loads(msg.payload.decode())# 將消息保存到文件、數據庫等with open("data.txt", "a") as file:file.write('\t'.join([dict["time"].replace("_"," "),str(dict["temp"]),str(dict["humidity"])])+"\n")# MQTT Broker的連接參數
broker = "broker.hivemq.com"
port = 1883  # 端口號
topic = "wokwi-weather"  # 訂閱的主題,記得修改這里
# 創建一個MQTT客戶端
client = mqtt.Client()# 設置回調函數
client.on_connect = on_connect
client.on_message = on_message# 連接到MQTT Broker
client.connect(broker, port, 60)# 開始循環,處理網絡流量和調用回調函數
client.loop_forever()
桌面小組件部分
還在不斷完善,因為也是剛學tkinter幾天沒有太掌握。

暫時可以實現實時讀取data數據最后并讀取全部數據繪制折線圖。
import tkinter as tk
from tkinter import ttk
from PIL import Image, ImageTk
import matplotlib.pyplot as plt
from matplotlib.backends.backend_tkagg import FigureCanvasTkAgg
import pandas as pddef line_plot():# Read the data from the filedata = pd.read_csv('data.txt', sep='\t', header=None, names=['Timestamp', 'Temperature', 'Humidity'])print("Data loaded for plotting.")# Create the figure with a single subplotfig, ax = plt.subplots(figsize=(12, 6))# Plot the temperaturetemperature_line, = ax.plot(data['Timestamp'], data['Temperature'], color='blue', label='Temperature')ax.set_xlabel('Timestamp')ax.set_ylim(20, 40)  # Set the y-axis limits for temperature to 20-40ax.set_ylabel('Temperature (°C)', color='blue')ax.tick_params('y', colors='blue')# Create a twin y-axis for the humidityax2 = ax.twinx()humidity_line, = ax2.plot(data['Timestamp'], data['Humidity'], color='green', label='Humidity')ax2.set_ylabel('Humidity (%)', color='green')ax2.set_ylim(20, 80)  # Set the y-axis limits for humidity to 20-80ax2.tick_params('y', colors='green')# Set the title and gridax.set_title('Temperature and Humidity over Time')ax.grid()# Add a legendlines = [temperature_line, humidity_line]labels = [l.get_label() for l in lines]ax.legend(lines, labels, loc='upper left')# Display 20 evenly spaced x-axis labelsnum_ticks = 20start = 0end = len(data['Timestamp'])tick_locations = [start + i * (end - start) / (num_ticks - 1) for i in range(num_ticks)]# def split_timestamp(ts):#     return "-".join(":".join(ts.split(":")[:-1]).split("-")[:])# tick_locations = tick_locations.apply(split_timestamp)tick_locations = [int(loc) for loc in tick_locations]ax.set_xticks(tick_locations)plt.setp(ax.get_xticklabels(), rotation=30)plt.tight_layout()# Display the plotreturn figclass AutoHideWindow:def __init__(self, root):self.root = rootself.root.geometry("320x130-100+100")self.root.overrideredirect(True)self.root.wm_attributes("-topmost", True)self.root.wm_attributes("-alpha", 0.9)self.is_hidden = Falseself.screen_width = self.root.winfo_screenwidth()self.screen_height = self.root.winfo_screenheight()self.hidden_window = Noneself.line_chart_window = Noneself.line_chart_open = False  # Track if the line chart window is openself.create_main_interface()self.create_line_chart_window()self.root.bind("<Configure>", self.check_position)self.root.bind("<Enter>", self.show_full_window)self.root.bind("<Escape>", self.hide_window)self.root.bind("<Return>", self.show_full_window)self.root.bind("<ButtonPress-1>", self.start_move)self.root.bind("<B1-Motion>", self.on_move)self.x_offset = 0self.y_offset = 0self.update_data()def create_main_interface(self):self.main_frame = ttk.Frame(self.root)self.main_frame.pack(fill=tk.BOTH, expand=True)self.gif_label = tk.Label(self.main_frame)self.gif_label.grid(row=0, column=1, rowspan=4, padx=5, pady=5, sticky=tk.W)self.load_gif("功德加一+(1).gif")self.numbers_label = ttk.Frame(self.main_frame)self.numbers_label.grid(row=0, column=0, rowspan=3, padx=10, pady=10)self.number0_label = tk.Label(self.numbers_label, width=20, height=1, bg='green', fg='white', font="Arial 10 bold", text=" ", relief=tk.FLAT, anchor=tk.W)self.number0_label.grid(column=0, row=0, sticky=tk.E)self.number1_label = tk.Label(self.numbers_label, width=20, height=1, bg='white', fg='black', font="Arial 10", text="溫度:", relief=tk.FLAT, anchor=tk.W)self.number1_label.grid(column=0, row=1, sticky=tk.E, ipady=3)self.number2_label = tk.Label(self.numbers_label, width=20, height=1, bg='white', fg='black', font="Arial 10", text="濕度:", relief=tk.FLAT, anchor=tk.W)self.number2_label.grid(column=0, row=2, sticky=tk.E, ipady=3)self.button = ttk.Button(self.main_frame, text="溫濕度折線圖", command=self.show_line_chart_window)self.button.grid(column=0, row=3, sticky=tk.E)def load_gif(self, path):self.gif = Image.open(path)self.gif_frames = []try:while True:self.gif_frames.append(ImageTk.PhotoImage(self.gif.copy()))self.gif.seek(len(self.gif_frames))except EOFError:passself.current_frame = 0self.update_gif()def update_gif(self):self.gif_label.configure(image=self.gif_frames[self.current_frame])self.current_frame = (self.current_frame + 1) % len(self.gif_frames)self.root.after(100, self.update_gif)def create_line_chart_window(self):x, y = self.root.winfo_x(), self.root.winfo_y()width, height = 10, self.root.winfo_height()self.line_chart_window = tk.Toplevel(self.root)self.line_chart_window.geometry(f"320x500+{x}+{y}")self.line_chart_window.withdraw()# Bind the close event of the window to a method that resets the open statusself.line_chart_window.protocol("WM_DELETE_WINDOW", self.close_line_chart_window)def check_position(self, event=None):if self.is_hidden:returnx, y = self.root.winfo_x(), self.root.winfo_y()width, height = self.root.winfo_width(), self.root.winfo_height()if x <= 0 or x + width >= self.screen_width:self.hide_window()def hide_window(self, event=None):if self.hidden_window or self.is_hidden:returnx, y = self.root.winfo_x(), self.root.winfo_y()width, height = 10, self.root.winfo_height()self.hidden_window = tk.Toplevel(self.root)self.hidden_window.geometry(f"{width}x{height}+{x}+{y}")self.hidden_window.overrideredirect(True)self.hidden_window.bind("<Enter>", self.show_full_window)def show_full_window(self, event=None):if self.hidden_window:self.hidden_window.destroy()self.hidden_window = Noneself.root.deiconify()self.is_hidden = Falsedef show_line_chart_window(self):if self.line_chart_open:self.line_chart_window.deiconify()  # Show existing windowself.create_line_chart(self.line_chart_window)  # Redraw the chartelse:self.create_line_chart(self.line_chart_window)self.line_chart_window.deiconify()self.line_chart_open = True  # Update the open statusdef close_line_chart_window(self):if self.line_chart_open:self.line_chart_window.withdraw()  # Hide the windowself.line_chart_open = False  # Update the open statusdef start_move(self, event):self.x_offset = event.xself.y_offset = event.ydef on_move(self, event):x = self.root.winfo_pointerx() - self.x_offsety = self.root.winfo_pointery() - self.y_offsetself.root.geometry(f"+{x}+{y}")def update_data(self, file="data.txt"):try:with open(file, "r") as file:lines = file.readlines()if lines:last_line = lines[-1]lasttime, temperate0, humi = last_line.split('\t')temperate = temperate0.strip("℃ ")self.number0_label.config(text=f"時間:{' '.join(lasttime.split('_'))}")self.number1_label.config(text=f"溫度:{temperate}℃")self.number2_label.config(text=f"濕度:{humi.strip()}%")except Exception as e:print(f"讀取文件出錯: {e}")self.root.after(10000, self.update_data)def create_line_chart(self, window):fig = line_plot()canvas = FigureCanvasTkAgg(fig, master=window)canvas.draw()canvas.get_tk_widget().pack(fill=tk.BOTH, expand=True)if __name__ == "__main__":root = tk.Tk()app = AutoHideWindow(root)root.mainloop()
這兩個代碼要同時運行就可以實現實時接收數據和實時組件展示,只開第一個就可以實時接收數據。
實驗總結
是一次很好的學習電路板模塊的小項目,也可作為中學生實踐課程項目。
希望大家多多交流討論啊,本人也是新手,希望有更簡單高效的解決方案。
287)
)


