基于儀表盤類型的自定義表盤
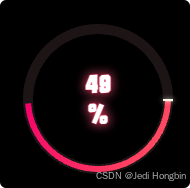
上圖為3層結構組成
- 正常一個儀表盤配置
- 要在外圈和內圈之間制造一條縫隙間隔 再創建一個儀表盤配置 背景透明 進度條拉滿 進度條顏色和數據的背景相同
- 開始處的線 又一個儀表盤配置 數值固定一個比較小的值
<!DOCTYPE html>
<html><head><meta charset="utf-8" /><script src="https://cdn.jsdelivr.net/npm/echarts@5"></script><style>#main {width: 200px;height: 200px;margin: 100px auto;}</style><style>/* 在 CSS 文件中定義自定義字體 */@font-face {font-family: "MyCustomFont"; /* 自定義字體名稱 */src: url("public/只含數字.ttf");font-weight: normal;font-style: normal;}</style></head><body><div id="main"></div><script>var chart = echarts.init(document.getElementById("main"));const bgColor = "#1F1316";chart.setOption({backgroundColor: "black",series: [{type: "gauge",startAngle: 0,endAngle: 360,itemStyle: {// shadowColor: "#fff",// shadowBlur: 10,},progress: {show: true,width: 8,// roundCap: true,overlap: true,itemStyle: {// borderColor: "#fff",// borderWidth: 1,// opacity: 1,// borderType: [5, 10],// borderDashOffset: 5,color: {type: "linear",x: 0,y: 0,x2: 1,y2: 1,colorStops: [{ offset: 0, color: "#f20075" }, // 漸變起始色{ offset: 1, color: "#ff6666" }, // 漸變結束色],},// shadowColor: "#f20075",// shadowBlur: 10,},},axisLine: {lineStyle: {width: 10,// color: [[1, "#1F1016"]], // 背景圓環color: [[1, bgColor]], // 背景圓環},},pointer: {show: false,},axisTick: {show: false,},splitLine: {show: false,},axisLabel: {show: false,},detail: {valueAnimation: true,formatter: "{value}\n%",fontSize: 24,fontFamily: "MyCustomFont",color: "#fff",textShadowColor: "#CB3359",textShadowBlur: 10,textBorderColor: "#CB3359",textBorderWidth: 1,offsetCenter: [0, "0%"],},data: [{value: 49,},],z: 1,},// 緊貼外圈與背景同色 利用遮蔽下層顏色產生間隔效果{type: "gauge",startAngle: 0,endAngle: 360,itemStyle: {color: "",},progress: {show: true,width: 2,itemStyle: {color: bgColor,},},pointer: {show: false,},axisLine: {show: false,},axisTick: {show: false,},splitLine: {show: false,},axisLabel: {show: false,},detail: {show: false,},data: [{value: 100,},],z: 2,},// 開始處齊點{type: "gauge",startAngle: 0,endAngle: 360,itemStyle: {color: "",},progress: {show: true,width: 10,itemStyle: {// borderColor: "#fffae5",// borderWidth: 1,// borderType: [5, 10],// borderDashOffset: 5,color: "#fffae5",shadowColor: "#fff",shadowBlur: 5,},},pointer: {show: false,},axisLine: {show: false,},axisTick: {show: false,},splitLine: {show: false,},axisLabel: {show: false,},detail: {show: false,},data: [{value: 0.5,},],z: 3,},],});</script></body>
</html>刪邊?鄰接矩陣/鏈表/十字鏈對比)


)


