作者:來自 Elastic?Jeffrey Rengifo?及?Tomás Murúa
使用 LLM 處理圖像并將其轉換為 Kibana 儀表板。
想獲得 Elastic 認證?了解下一次 Elasticsearch Engineer 培訓的舉辦時間!
Elasticsearch 擁有眾多新功能,幫助你為你的使用場景構建最佳搜索解決方案。深入我們的示例筆記本了解更多,立即開始免費云試用,或在本地機器上嘗試 Elastic。
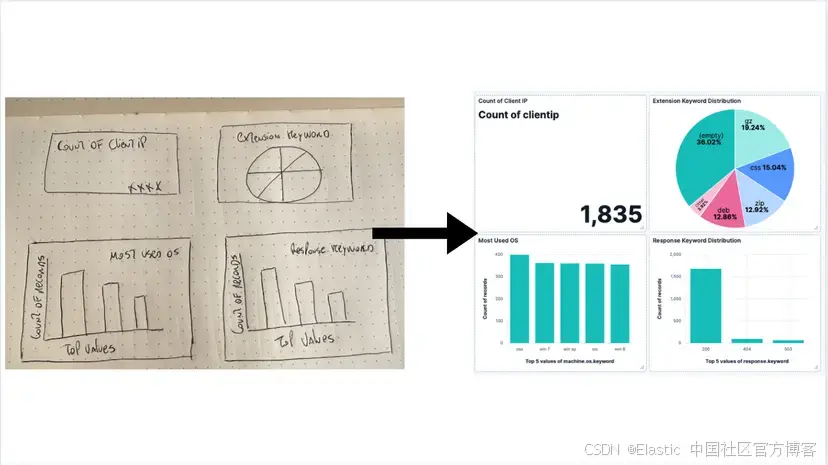
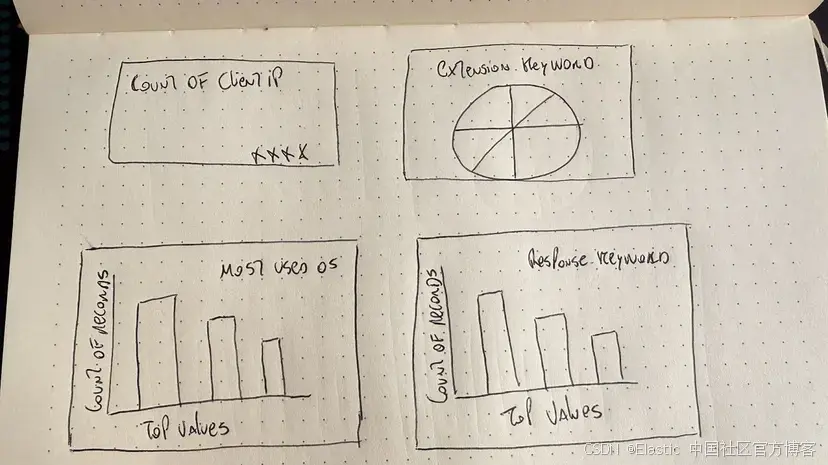
Kibana Lens 使儀表板創建變得拖放簡單,但當你需要幾十個面板時,點擊次數會累積。如果你可以畫一個儀表板草圖,截圖,然后讓 LLM 為你完成整個過程,會怎么樣?
在這篇文章中,我們將實現這個目標。我們將創建一個應用程序,接受儀表板圖像,分析我們的映射,然后生成一個儀表板,無需我們手動操作 Kibana!
步驟:
- 背景與應用工作流程
- 準備數據
- LLM 配置
- 應用功能
背景與應用工作流程
第一個想法是讓 LLM 生成整個 NDJSON 格式的 Kibana 保存對象,然后將其導入到 Kibana。
我們嘗試了以下模型:
- Gemini 2.5 pro
- GPT o3 / o4-mini-high / 4.1
- Claude 4 sonnet
- Grok 3
- Deepseek ( Deepthink R1 )
至于提示詞,我們從最簡單的開始:
You are an Elasticsearch Saved-Object generator (Kibana 9.0).
INPUTS
=====
1. PNG screenshot of a 4-panel dashboard (attached).
2. Index mapping (below) – trimmed down to only the fields present in the screenshot.
3. Example NDJSON of *one* metric visualization (below) for reference.TASK
====
Return **only** a valid NDJSON array that recreates the dashboard exactly:
* 2 metric panels (Visits, Unique Visitors)
* 1 pie chart (Most used OS)
* 1 vertical bar chart (State Geo Dest)
* Use index pattern `kibana_sample_data_logs`.
* Preserve roughly the same layout (2×2 grid).
* Use `panelIndex` values 1-4 and random `id` strings.
* Kibana version: 9.0
盡管我們嘗試了少樣本示例和關于如何構建每個可視化的詳細說明,但沒有成功。如果你對這個實驗感興趣,可以在這里找到詳細信息。
使用這種方法的結果是,在嘗試將 LLM 生成的文件上傳到 Kibana 時,看到以下消息:
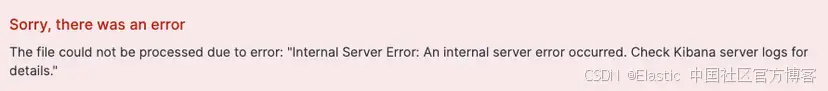
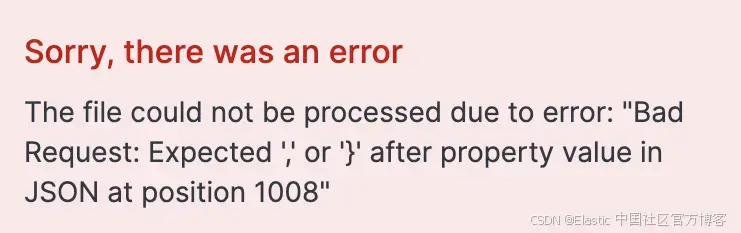
這意味著生成的 JSON 無效或格式錯誤。最常見的問題是 LLM 生成了不完整的 NDJSON、虛構參數,或者無論我們如何強制要求,都返回常規 JSON 而不是 NDJSON。
受這篇文章的啟發 —— 其中搜索模板比 LLM 自由生成效果更好——我們決定為 LLM 提供模板,而不是要求它生成完整的 NDJSON 文件,然后我們在代碼中使用 LLM 提供的參數來創建正確的可視化。這種方法沒有讓人失望,而且是可預測和可擴展的,因為現在代碼承擔了主要工作,而不是 LLM。
應用工作流程如下:
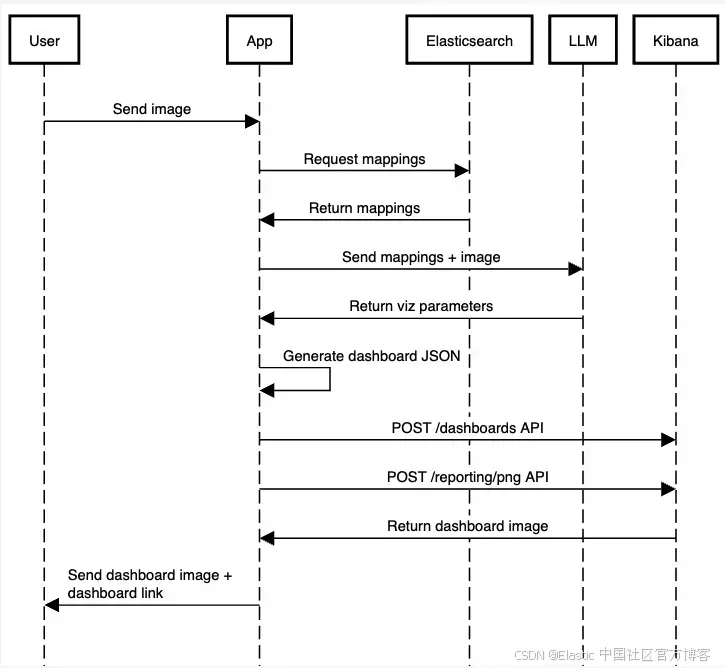
我們將為了簡化省略一些代碼,但你可以在這個筆記本中找到完整應用的有效代碼。
前提條件
在開始開發之前,你需要以下內容:
- Python 3.8 或更高版本
- 一個 Venv Python 環境
- 一個運行中的 Elasticsearch 實例,以及其端點和 API 密鑰
- 一個存儲在環境變量名 OPENAI_API_KEY 下的 OpenAI API 密鑰:
export OPENAI_API_KEY="your-openai-api-key"準備數據
對于數據,我們將保持簡單,使用 Elastic 樣本 Web 日志。你可以在這里了解如何將這些數據導入到你的集群。
每個文檔包括發出應用程序請求的主機的詳細信息,以及請求本身及其響應狀態的信息。以下是一個示例文檔:
{"agent": "Mozilla/5.0 (X11; Linux i686) AppleWebKit/534.24 (KHTML, like Gecko) Chrome/11.0.696.50 Safari/534.24","bytes": 8509,"clientip": "70.133.115.149","extension": "css","geo": {"srcdest": "US:IT","src": "US","dest": "IT","coordinates": {"lat": 38.05134111,"lon": -103.5106908}},"host": "cdn.elastic-elastic-elastic.org","index": "kibana_sample_data_logs","ip": "70.133.115.149","machine": {"ram": 5368709120,"os": "osx"},"memory": null,"message": "70.133.115.149 - - [2018-08-30T23:35:31.492Z] \"GET /styles/semantic-ui.css HTTP/1.1\" 200 8509 \"-\" \"Mozilla/5.0 (X11; Linux i686) AppleWebKit/534.24 (KHTML, like Gecko) Chrome/11.0.696.50 Safari/534.24\"","phpmemory": null,"referer": "http://twitter.com/error/john-phillips","request": "/styles/semantic-ui.css","response": 200,"tags": ["success","info"],"@timestamp": "2025-07-03T23:35:31.492Z","url": "https://cdn.elastic-elastic-elastic.org/styles/semantic-ui.css","utc_time": "2025-07-03T23:35:31.492Z","event": {"dataset": "sample_web_logs"},"bytes_gauge": 8509,"bytes_counter": 51201128
}
現在,讓我們獲取剛剛加載的索引 kibana_sample_data_logs 的映射:
INDEX_NAME = "kibana_sample_data_logs"es_client = Elasticsearch([os.getenv("ELASTICSEARCH_URL")],api_key=os.getenv("ELASTICSEARCH_API_KEY"),
)result = es_client.indices.get_mapping(index=INDEX_NAME)
index_mappings = result[list(result.keys())[0]]["mappings"]["properties"]
我們將把映射與稍后加載的圖像一起傳遞。
LLM 配置
讓我們配置 LLM 使用結構化輸出,以輸入圖像并接收我們需要傳遞給函數的 JSON,以生成 JSON 對象。
我們安裝依賴項:
pip install elasticsearch pydantic langchain langchain-openai -qElasticsearch 會幫助我們獲取索引映射。Pydantic 允許我們在 Python 中定義 schema,以便要求 LLM 遵循這個結構,而 LangChain 是一個框架,可以更方便地調用 LLMs 和 AI 工具。
我們將創建一個 Pydantic schema 來定義我們希望從 LLM 得到的輸出內容。我們需要從圖像中識別的信息包括:圖表類型、字段、可視化標題,以及儀表板標題:
class Visualization(BaseModel):title: str = Field(description="The dashboard title")type: List[Literal["pie", "bar", "metric"]]field: str = Field(description="The field that this visualization use based on the provided mappings")class Dashboard(BaseModel):title: str = Field(description="The dashboard title")visualizations: List[Visualization]請上傳你剛畫的儀表板圖片,我會根據圖像內容提取圖表類型、字段、可視化標題和儀表板標題。
現在我們聲明 LLM 模型調用和圖像加載。這個函數將接收 Elasticsearch 索引的 mappings 和我們想要生成的儀表板圖像。
通過使用 with_structured_output,我們可以將 Pydantic 的 Dashboard schema 作為 LLM 生成的響應對象。使用 Pydantic,我們可以定義帶有驗證的數據模型,確保 LLM 輸出符合預期結構。
要將圖像轉換為 base64 并作為輸入發送,可以使用在線轉換工具,或通過代碼實現。
prompt = f"""You are an expert in analyzing Kibana dashboards from images for the version 9.0.0 of Kibana.You will be given a dashboard image and an Elasticsearch index mapping.Below are the index mappings for the index that the dashboard is based on.Use this to help you understand the data and the fields that are available.Index Mappings:{index_mappings}Only include the fields that are relevant for each visualization, based on what is visible in the image."""message = [{"role": "user","content": [{"type": "text", "text": prompt},{"type": "image","source_type": "base64","data": image_base64,"mime_type": "image/png",},],}
]try:llm = init_chat_model("gpt-4.1-mini")llm = llm.with_structured_output(Dashboard)dashboard_values = llm.invoke(message)print("Dashboard values generated by the LLM successfully")print(dashboard_values)
except Exception as e:print(f"Failed to analyze image and match fields: {str(e)}")
LLM 已經具備關于 Kibana 儀表板的上下文,因此我們不需要在提示詞中解釋所有內容,只需添加一些細節,以確保它不會忘記當前處理的是 Elasticsearch 和 Kibana。
讓我們來拆解這個提示詞:
| Section | Reason |
|---|---|
| You are an expert in analyzing Kibana dashboards from images for the version 9.0.0 of Kibana. | 通過強調這是 Elasticsearch 以及指定 Elasticsearch 的版本,可以降低 LLM 產生舊的或無效參數的可能性。 |
| You will be given a dashboard image and an Elasticsearch index mapping. | 我們說明圖像是關于儀表板的,以避免 LLM 產生錯誤的解讀。 |
| Below are the index mappings for the index that the dashboard is based on.Use this to help you understand the data and the fields that are available. Index Mappings: {index_mappings} | 提供 mappings 至關重要,這樣 LLM 才能動態選擇有效字段。否則我們只能在這里寫死 mappings,太死板,或者依賴圖像中包含正確的字段名,但這種方式不可靠。 |
| Only include the fields that are relevant for each visualization, based on what is visible in the image. | 我們必須添加這個強化說明,因為有時它會嘗試添加與圖像無關的字段。 |
這將返回一個包含可顯示可視化數組的對象:
"Dashboard values generated by the LLM successfully
title=""Client, Extension, OS, and Response Keyword Analysis""visualizations="["Visualization(title=""Count of Client IP","type="["metric"],"field=""clientip"")","Visualization(title=""Extension Keyword Distribution","type="["pie"],"field=""extension.keyword"")","Visualization(title=""Most Used OS","type="["bar"],"field=""machine.os.keyword"")","Visualization(title=""Response Keyword Distribution","type="["bar"],"field=""response.keyword"")"
]
處理 LLM 響應
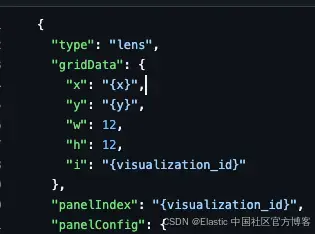
我們創建了一個示例的 2x2 面板儀表板,然后使用 Get a dashboard API 導出為 JSON,再將面板存儲為可視化模板(餅圖、條形圖、指標),可以根據問題替換部分參數以創建不同字段的新可視化。
你可以在這里看到模板 JSON 文件。注意我們如何用 {variable_name} 替換想要后續替換的對象值。
根據 LLM 提供的信息,我們可以決定使用哪個模板以及替換哪些值。
fill_template_with_analysis 函數將接收單個面板的參數,包括可視化的 JSON 模板、標題、字段,以及可視化在網格上的坐標。
然后,它會替換模板中的值,返回最終的 JSON 可視化結果。
def fill_template_with_analysis(template: Dict[str, Any],visualization: Visualization,grid_data: Dict[str, Any],
):template_str = json.dumps(template)replacements = {"{visualization_id}": str(uuid.uuid4()),"{title}": visualization.title,"{x}": grid_data["x"],"{y}": grid_data["y"],}if visualization.field:replacements["{field}"] = visualization.fieldfor placeholder, value in replacements.items():template_str = template_str.replace(placeholder, str(value))return json.loads(template_str)
為了簡化,我們會使用固定坐標分配給 LLM 決定創建的面板,生成如上圖所示的 2x2 網格儀表板。
# Filling templates fields
panels = []
grid_data = [{"x": 0, "y": 0},{"x": 12, "y": 0},{"x": 0, "y": 12},{"x": 12, "y": 12},
]i = 0for vis in dashboard_values.visualizations:for vis_type in vis.type:template = templates.get(vis_type, templates.get("bar", {}))filled_panel = fill_template_with_analysis(template, vis, grid_data[i])panels.append(filled_panel)i += 1
根據 LLM 決定的可視化類型,我們會選擇對應的 JSON 模板文件,使用 fill_template_with_analysis 替換相關信息,然后將新面板添加到數組,稍后用來創建儀表板。
當儀表板準備好后,我們會使用 Create a dashboard API 將新的 JSON 文件推送到 Kibana,生成儀表板:
try:dashboard_id = str(uuid.uuid4())# post request to create the dashboard endpointurl = f"{os.getenv('KIBANA_URL')}/api/dashboards/dashboard/{dashboard_id}"dashboard_config = {"attributes": {"title": dashboard_values.title,"description": "Generated by AI","timeRestore": True,"panels": panels, # Visualizations with the values generated by the LLM"timeFrom": "now-7d/d","timeTo": "now",},}headers = {"Content-Type": "application/json","kbn-xsrf": "true","Authorization": f"ApiKey {os.getenv('ELASTICSEARCH_API_KEY')}",}requests.post(url,headers=headers,json=dashboard_config,)# Url to the generated dashboarddashboard_url = f"{os.getenv('KIBANA_URL')}/app/dashboards#/view/{dashboard_id}"print("Dashboard URL: ", dashboard_url)print("Dashboard ID: ", dashboard_id)except Exception as e:print(f"Failed to create dashboard: {str(e)}")要執行腳本并生成儀表板,請在控制臺運行以下命令:
python <file_name>.py最終結果將如下所示:
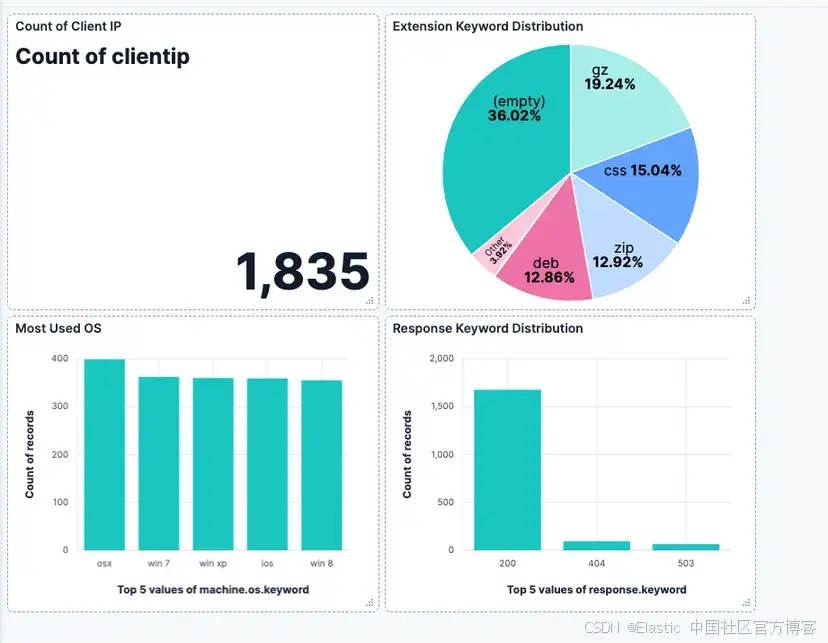
Dashboard ID: generated-dashboard-id
結論
LLM 在文本轉代碼或將圖像轉為代碼時展現出強大的視覺能力。儀表板 API 也使得將 JSON 文件轉換為儀表板成為可能,結合 LLM 和一些代碼,我們可以將圖像轉成 Kibana 儀表板。
下一步是通過使用不同的網格設置、儀表板尺寸和位置,提升儀表板視覺的靈活性。同時,支持更復雜的可視化和更多類型的可視化,將是該應用的有益補充。
原文:AI-powered dashboards: From a vision to Kibana - Elasticsearch Labs

)


)


