seaborn 子圖
Data visualizations are essential in data analysis. The famous saying “one picture is worth a thousand words” holds true in the scope of data visualizations as well. In this post, I will explain a well-structured, very informative collection of subplots: FacetGrid.
數據可視化在數據分析中至關重要。 著名的諺語“一張圖片值得一千個單詞”在數據可視化的范圍內也是如此。 在這篇文章中,我將解釋一個結構良好,內容豐富的子圖集合: FacetGrid 。
FacetGrid is basically a grid of subplots. Matplotlib supports creating figures with multiple axes and thus allows to have subplots in one figure. What FacetGrid puts on top of matplotlib’s subplot structure:
FacetGrid基本上是子圖的網格。 Matplotlib支持創建具有多個軸的圖形,因此允許在一個圖形中包含子圖。 FacetGrid在matplotlib的子圖結構之上放了什么:
- Making the process easier and smoother (with less code) 使過程更輕松,更流暢(使用更少的代碼)
- Transfering the structure of dataset to subplots 將數據集的結構轉移到子圖
The distribution of a variable or relationship among variables can easily be discovered with FacetGrids. They can have up to three dimensions: row, column, and hue. It will be more clear as we go through examples. So, let’s start.
使用FacetGrids可以輕松發現變量的分布或變量之間的關系。 它們最多可以具有三個維度: row , column和hue 。 通過示例我們將更加清楚。 所以,讓我們開始吧。
As always we start with importing libraries.
與往常一樣,我們從導入庫開始。
Note: FacetGrid requires the data stored in a pandas dataframe where each row represents an observation and columns represent variables. Thus, we also import pandas.
注意 :FacetGrid要求將數據存儲在pandas數據框中,其中每一行代表一個觀測值,而各列代表變量。 因此,我們也進口大熊貓。
import numpy as np
import pandas as pdimport matplotlib.pyplot as plt
import seaborn as sns
sns.set(style='darkgrid', color_codes=True)%matplotlib inline
We will use the built-in “tips” dataset of seaborn.
我們將使用seaborn的內置“提示”數據集。
tip = sns.load_dataset("tips")
tip.head()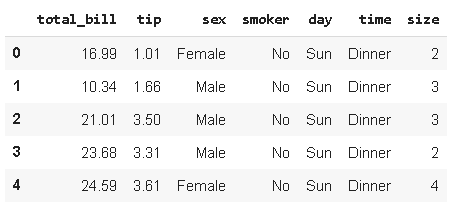
FacetGrid object is initialized by passing a dataframe and name of variables to create the structure of axes. The variables used to initialize FacetGrid object needs to be categorical or discrete. The grid structure is created according to the number of categories. For instance, “time” column has two unique values.
通過傳遞數據框和變量名稱以創建軸的結構來初始化FacetGrid對象。 用于初始化FacetGrid對象的變量必須是分類的或離散的 。 根據類別數創建網格結構。 例如,“時間”列具有兩個唯一值。
tip['time'].value_counts()
Dinner    176
Lunch      68
Name: time, dtype: int64
Let’s initialize a FacetGrid object by passing “time” variable to col parameter.
讓我們通過將“ time”變量傳遞給col參數來初始化FacetGrid對象。
g = sns.FacetGrid(tip, col='time')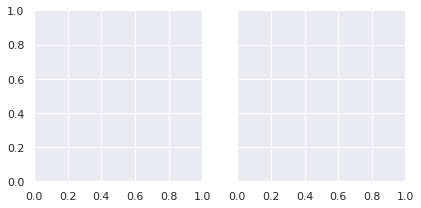
We’ve just created a very simple grid with two facets (each subplot is a facet). The size of facets are adjusted using height and aspect parameters.
我們剛剛創建了一個非常簡單的帶有兩個小平面的網格(每個子圖都是一個小平面)。 使用高度和高 寬比參數調整構面的大小。
- Height is the height of facets in inches 高度是刻面的高度,以英寸為單位
- Aspect is the ratio of width and height (width=aspect*height). Default value of aspect is 1. 寬高比是寬度與高度的比率(寬=高寬比*高)。 方面的默認值為1。
Let’s update the grid with larger facets.
讓我們用更大的方面更新網格。
g = sns.FacetGrid(tip, col='time', height=5)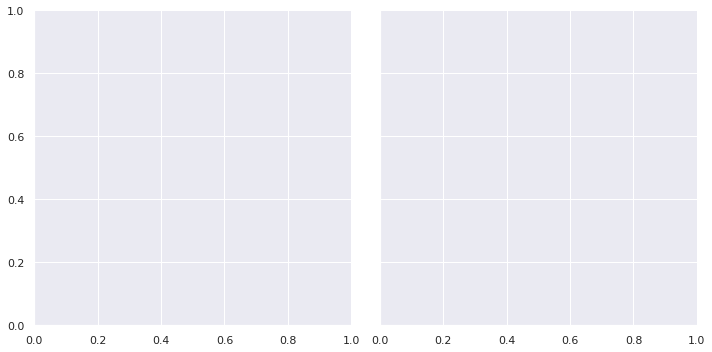
It is time to plot data on the grid using FacetGrid.map() method. It takes a plotting function and variable(s) to plot as arguments.
現在該使用FacetGrid.map()方法在網格上繪制數據了。 它需要一個繪圖函數和一個或多個變量作為參數進行繪圖。
g = sns.FacetGrid(tip, col='time', height=5)
g.map(plt.hist, "total_bill")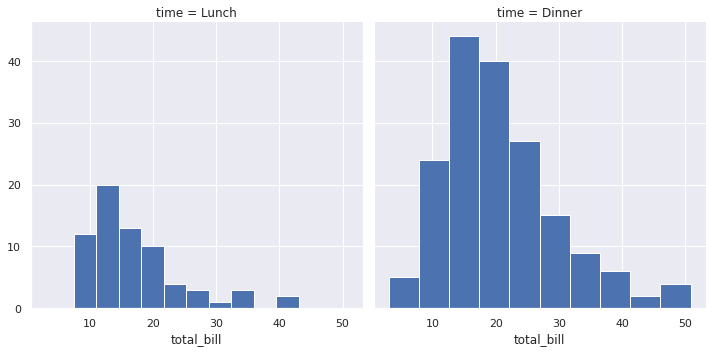
The grid shows histogram of “total_bill” based on “time”. Depending on the plotting function, we may need to pass multiple variables for map method. For instance, scatter plots require two variables.
網格顯示基于“時間”的“總賬單”直方圖。 根據繪圖功能,我們可能需要為map方法傳遞多個變量。 例如,散點圖需要兩個變量。
g = sns.FacetGrid(tip, col='time', height=5)
g.map(plt.scatter, "total_bill", "tip")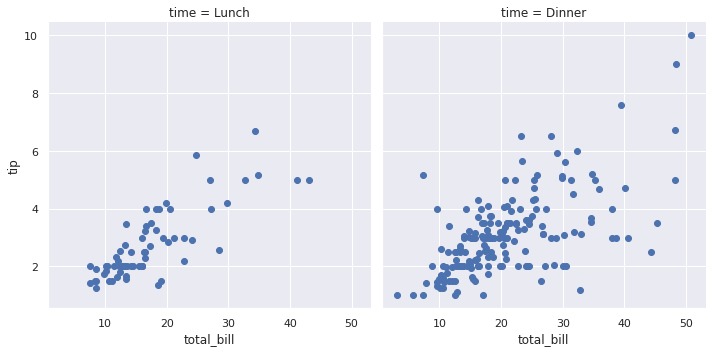
Let’s add one more dimension to the grid with row parameter.
讓我們通過row參數向網格添加一個維度。
g = sns.FacetGrid(tip, row='sex', col='time', height=4)
g.map(plt.scatter, "total_bill", "tip")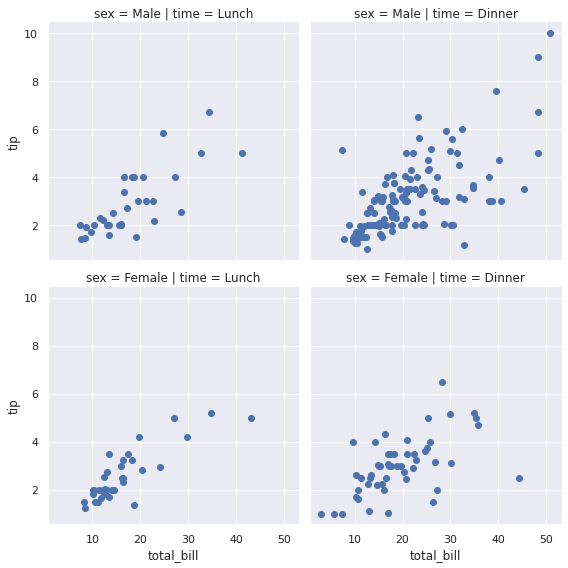
Both “sex” and “time” columns have two distinct values so a 2x2 FacetGrid is created. As we can see from the plot above, “total_bill” and “tip” variables have a similar trend for males and females.
“性別”和“時間”列都有兩個不同的值,因此創建了2x2 FacetGrid。 從上圖可以看出,男性和女性的“ total_bill”和“ tip”變量趨勢相似。
The hue parameter allows to add one more dimension to the grid with colors.
hue參數允許使用顏色向網格添加一個維度。
g = sns.FacetGrid(tip, row='sex', col='time', hue='smoker',
                  height=4)
g.map(plt.scatter, "total_bill", "tip")
g.add_legend()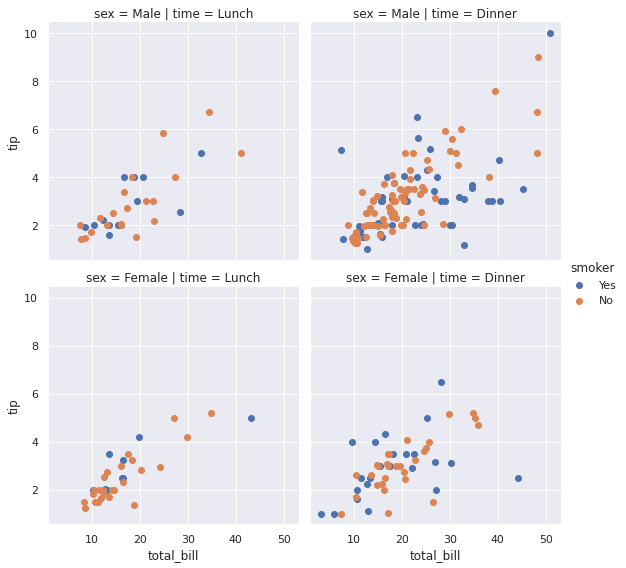
We now have an overview of the relationship among “total_bill”, “tip”, and “smoker” variables.
現在,我們對“ total_bill”,“ tip”和“ smoker”變量之間的關系進行了概述。
The “day” column has 4 unique values:
“天”列具有4個唯一值:
tip.day.value_counts()
Sat     87
Sun     76
Thur    62
Fri     19
Name: day, dtype: int64
We can create a FacetGrid that shows the distribution of “total_bill” in different days. It will show if customers spend more on any particular day.
我們可以創建一個FacetGrid來顯示“ total_bill”在不同日期的分布。 它將顯示客戶在特定日期是否花費更多。
g = sns.FacetGrid(tip, row='day',
                  row_order = tip.day.value_counts().index,
                  height=1.5, aspect=4)g.map(sns.distplot, "total_bill", hist=False)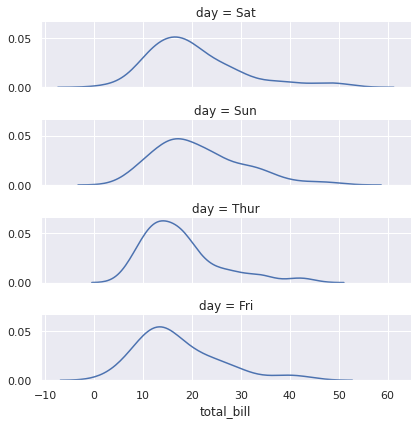
It seems like people tend to spend a little more on the weekend. We have used row_order parameter for this plot. As the name suggests, it determines the order of facets. In the previous plots, we used plotting functions from matplotlib.pyplot interface. But, for the last one, we used a plotting function from seaborn package. It is a nice feature of FacetGrid that provides additional flexibility.
人們似乎傾向于在周末花更多的錢。 我們已為此圖使用row_order參數。 顧名思義,它決定了構面的順序。 在先前的繪圖中,我們使用了來自matplotlib.pyplot接口的繪圖函數。 但是,對于最后一個,我們使用了seaborn包中的繪圖功能。 這是FacetGrid的一項不錯的功能,可提供額外的靈活性。
There are many more features that can be added on FacetGrids in order to enrich both the functionality and appearance of them. If you want to go deeper, I suggest going over seaborn documentation on FacetGrid.
可以在FacetGrids上添加更多功能,以豐富其功能和外觀。 如果你想更深入,我建議去了上seaborn文檔FacetGrid 。
Thank you for reading. Please let me know if you have any feedback.
感謝您的閱讀。 如果您有任何反饋意見,請告訴我。
https://seaborn.pydata.org/generated/seaborn.FacetGrid.html
https://seaborn.pydata.org/Generated/seaborn.FacetGrid.html
https://seaborn.pydata.org/tutorial/axis_grids.html#grid-tutorial
https://seaborn.pydata.org/tutorial/axis_grids.html#grid-tutorial
翻譯自: https://towardsdatascience.com/seaborn-facetgrid-taking-subplots-further-15ee7af54e44
seaborn 子圖
本文來自互聯網用戶投稿,該文觀點僅代表作者本人,不代表本站立場。本站僅提供信息存儲空間服務,不擁有所有權,不承擔相關法律責任。 如若轉載,請注明出處:http://www.pswp.cn/news/388072.shtml 繁體地址,請注明出處:http://hk.pswp.cn/news/388072.shtml 英文地址,請注明出處:http://en.pswp.cn/news/388072.shtml
如若內容造成侵權/違法違規/事實不符,請聯系多彩編程網進行投訴反饋email:809451989@qq.com,一經查實,立即刪除!相關文章
——Draw2d的擴展(一))
基于easyui開發Web版Activiti流程定制器詳解(六)——Draw2d的擴展(一)


異常檢測時間序列_時間序列的無監督異常檢測
:組合模式)
python設計模式(七):組合模式

Django框架是什麼?

存款驚人_如何使您的圖快速美麗驚人

pytest自動化6:pytest.mark.parametrize裝飾器--測試用例參數化
——Draw2d詳解(二))
基于easyui開發Web版Activiti流程定制器詳解(六)——Draw2d詳解(二)

c#中ReadLine,Read,ReadKey的區別

Ubuntu16.04 開啟多個終端,一個終端多個小窗口

敏捷 橄欖球運動_澳大利亞橄欖球迷的研究聲稱南非裁判的偏見被證明是錯誤的

activiti 部署流程圖后中文亂碼

Luogu 4755 Beautiful Pair

網絡傳播動力學_通過簡單的規則傳播動力
![【左偏樹】【P3261】 [JLOI2015]城池攻占](http://pic.xiahunao.cn/【左偏樹】【P3261】 [JLOI2015]城池攻占)
【左偏樹】【P3261】 [JLOI2015]城池攻占

【原創】數據庫中為什么不推薦使用外鍵約束

初識Activiti

開源軟件 安全風險_3開源安全風險及其解決方法

React-Router 源碼分析1
